


Disclaimer - We are not SEBI registered !! Nothing that you will read below is investment advice. We are sharing “High Performing stocks that are Undervalued” based on Q1’25 performance in Food Processing Indian Sector with you, for you to do deeper research.
Food Processing (Indian) Custom Index Returns as compared to NIFTY
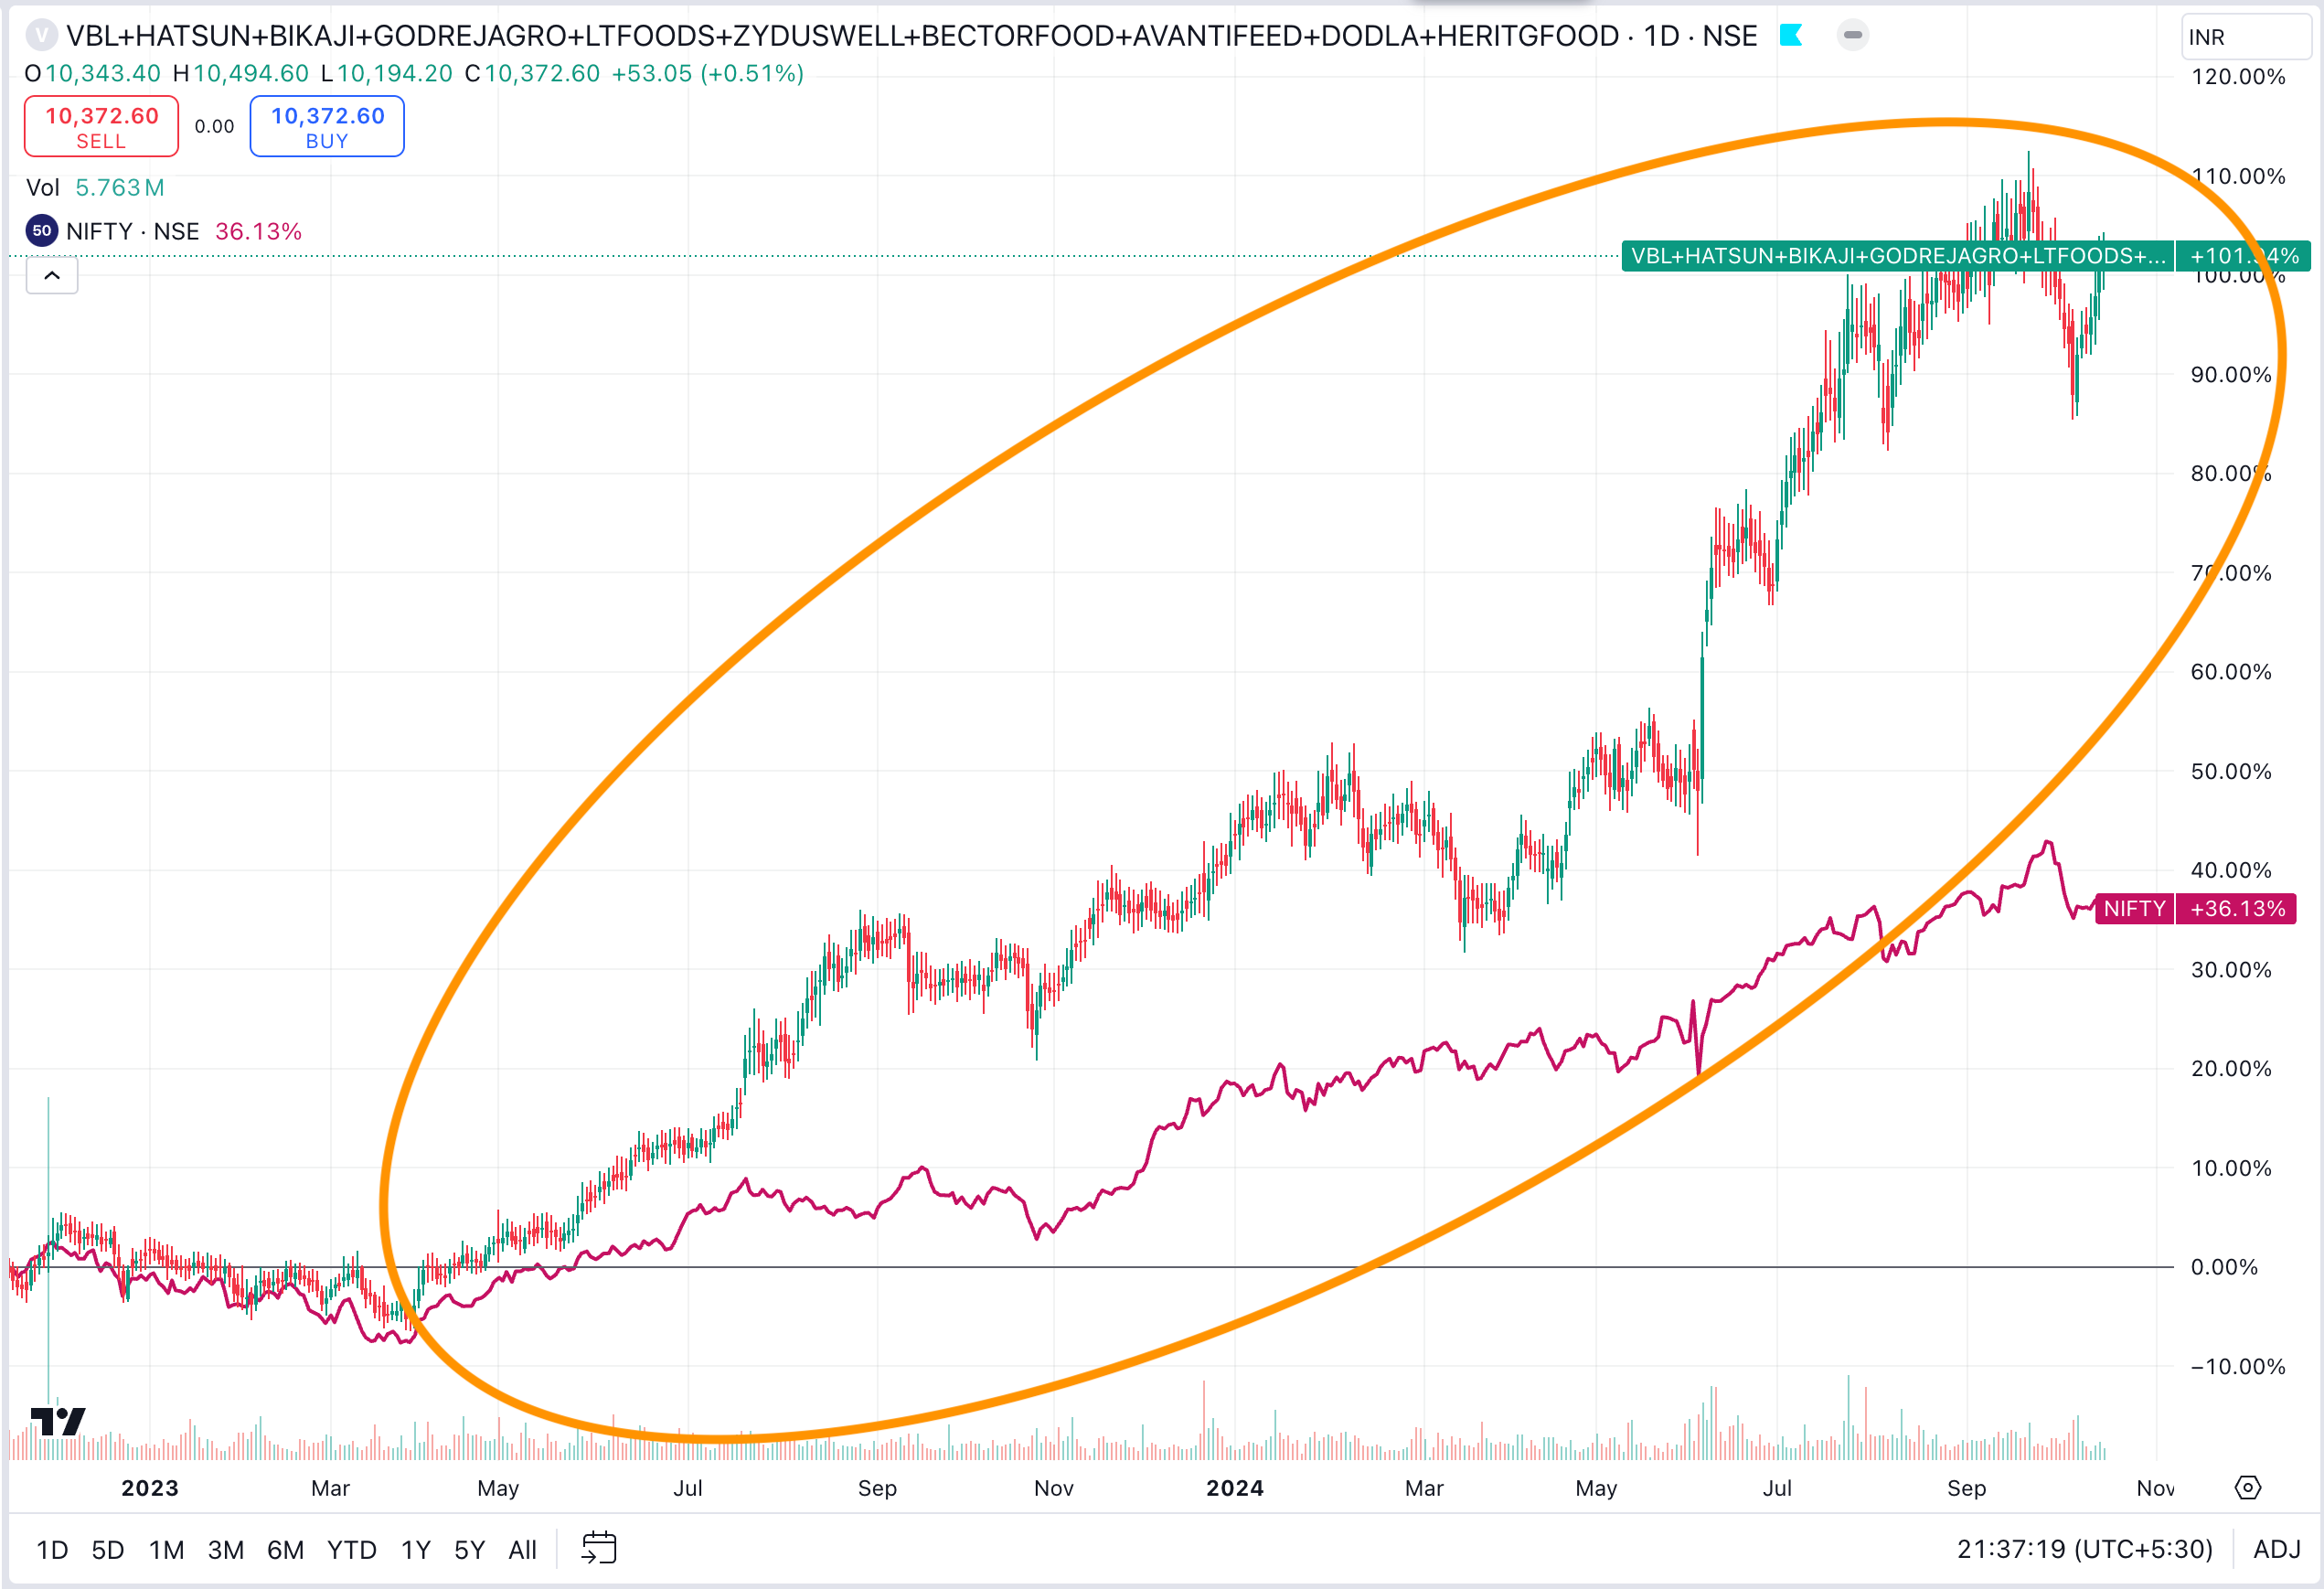
If we see returns for the last 2 years, our Food Processing (Indian) custom index started outperforming NIFTY since March 23 and since Oct 22 has given returns of 101% vs NIFTY 36%
What is happening fundamentally in Food Processing Sector in Q1 25 i.e. from April 24 to June 24
When multiple companies in a sector show Increase in Sales and OPM in a quarter… it usually indicates that there are strong tailwinds in the sector. This generally results in multiple companies in that sector out performing Fundamentally and Price wise.
For Food Processing Sector
16 Companies grew their Sales by 16% and Operating Profit Margins by 51% Quarter on Quarter in Q1 25 i.e. compared with Q4 2024
15 Companies grew their Sales by 13% and Operating Profit Margins by 21% Year on Year i.e. compared with Q1 2024
Also you will notice that for most of the companies mentioned below (The 9 Best performing Food Processing stocks that are undervalued) -
3 Profit metrics
Gross Profit Margin per quarter
Operating Profit Margin per quarter
Net Profit Margin per quarter
Started improving from March to May 23
Revenues started to scale up from May 23
Prices of most of these companies bottomed out in March 23 and since then have been on a tear, outperforming NIFTY since March 23
The reasons for the above fundamental outperformance (sector Tailwinds) are -
Margin Expansion: Most companies reported improved margins due to lower input costs, especially in dairy companies benefiting from reduced milk procurement prices. This indicates a favorable cost environment for the food processing sector.
Volume Growth: Companies across segments (dairy, rice, aquaculture) reported healthy volume growth, suggesting strong underlying demand for processed food products.
Value-Added Products Focus: There's a consistent strategy across companies to increase the share of value-added products to drive both growth and profitability. This includes products like cheese, yogurt, ready-to-eat items, and premium variants.
Distribution Expansion: Companies are focusing on expanding their distribution reach, both in terms of geographical coverage and channel diversification (e-commerce, modern trade, etc.), to drive growth.
Rural Market Potential: Several companies highlighted the growing importance of rural markets, with some reporting rural demand outpacing urban growth. This indicates a broadening consumer base for processed foods.
Operational Efficiency: There's an industry-wide focus on improving operational efficiencies through various initiatives like automation, digitization, and supply chain optimization to enhance margins.
New Product Launches: Companies across the board are emphasizing innovation and new product launches to cater to evolving consumer preferences and drive growth.
Commodity Price Volatility: While many companies benefited from lower input costs in the recent quarter, there's an underlying theme of commodity price volatility affecting the industry, requiring companies to maintain dynamic pricing and procurement strategies.
Check out the last section of the newsletter to see which sectors will we cover next…
9 Undervalued Food Processing Stocks that were the Best Performers listed by Decreasing Market Cap
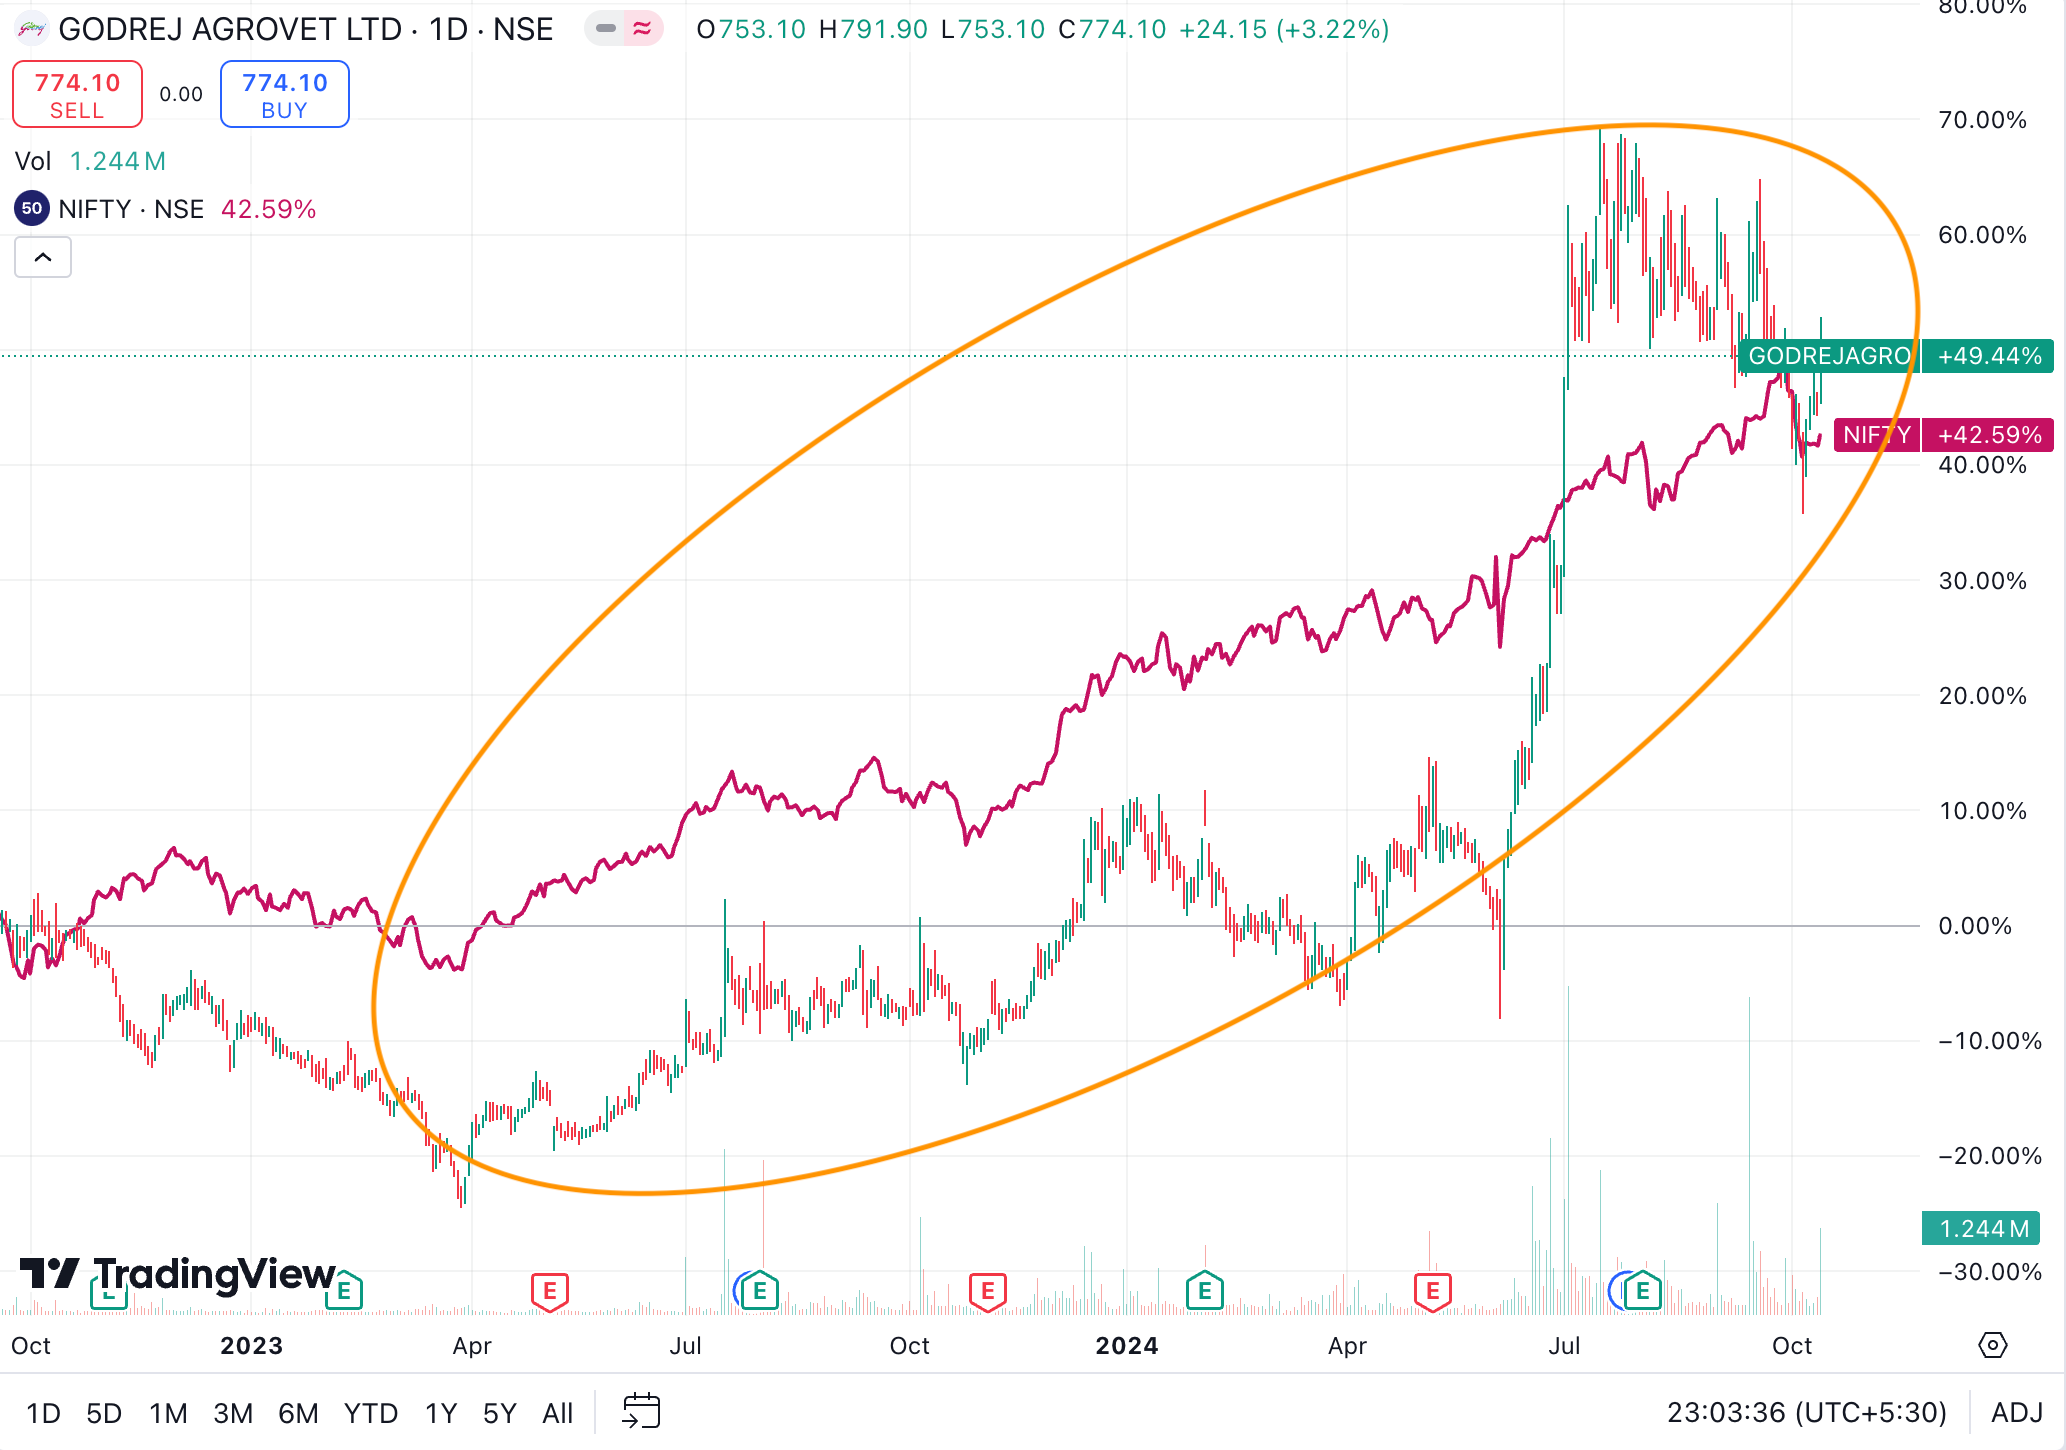
Godrej Agrovet Ltd - Market Cap 14,886+ Cr
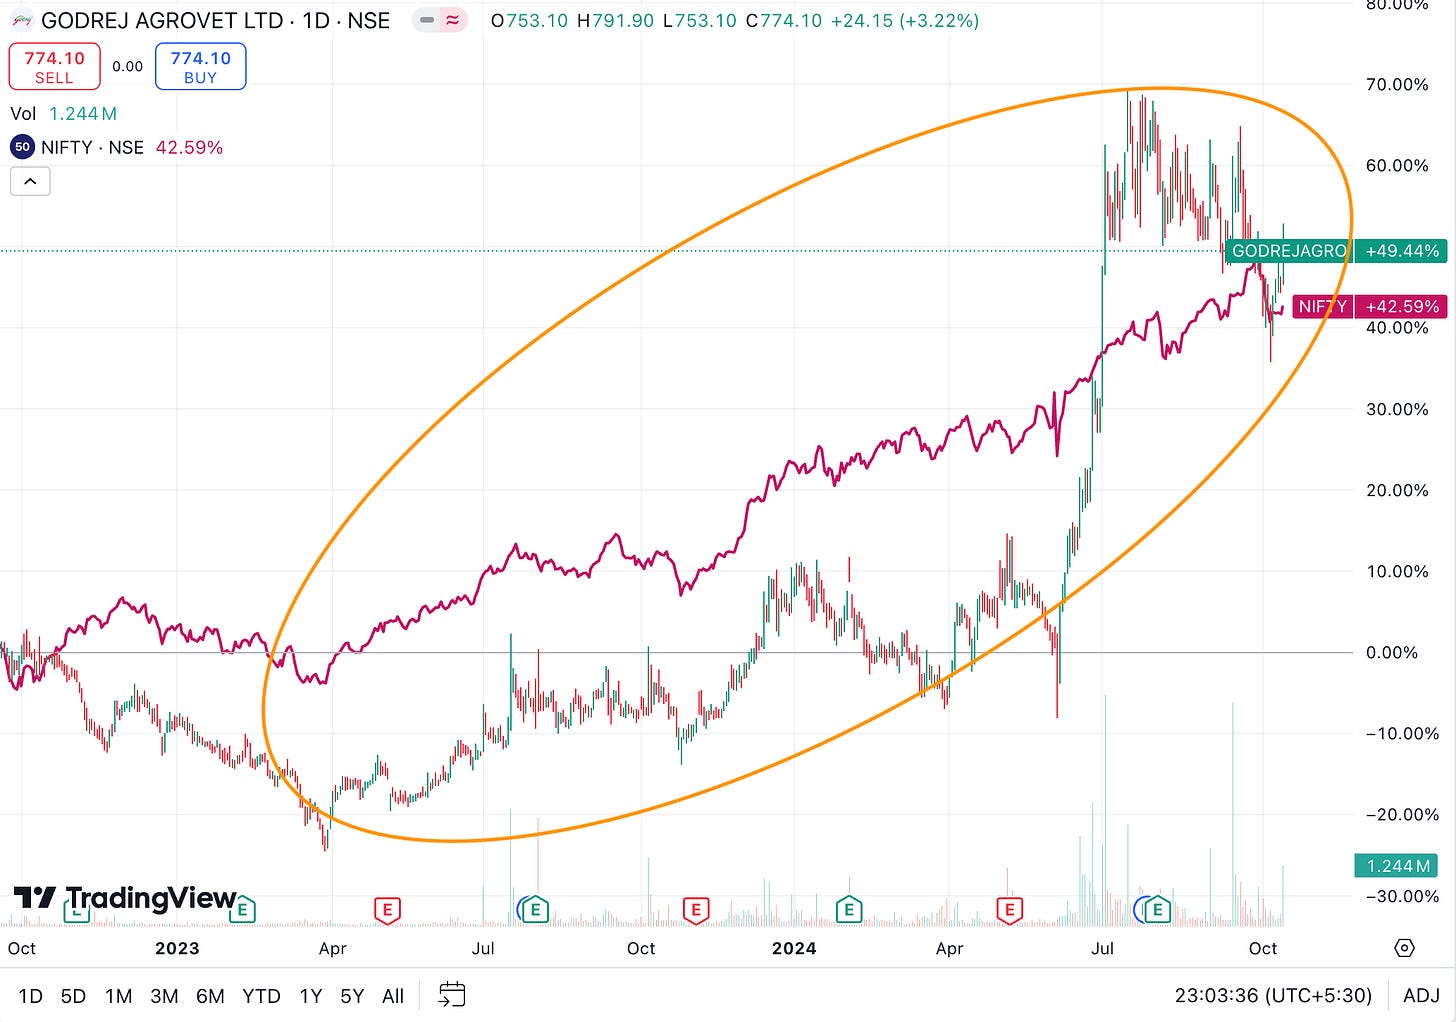
Price Action - Since Oct 22, Godrej Agrovet - 49%, NIFTY 43%
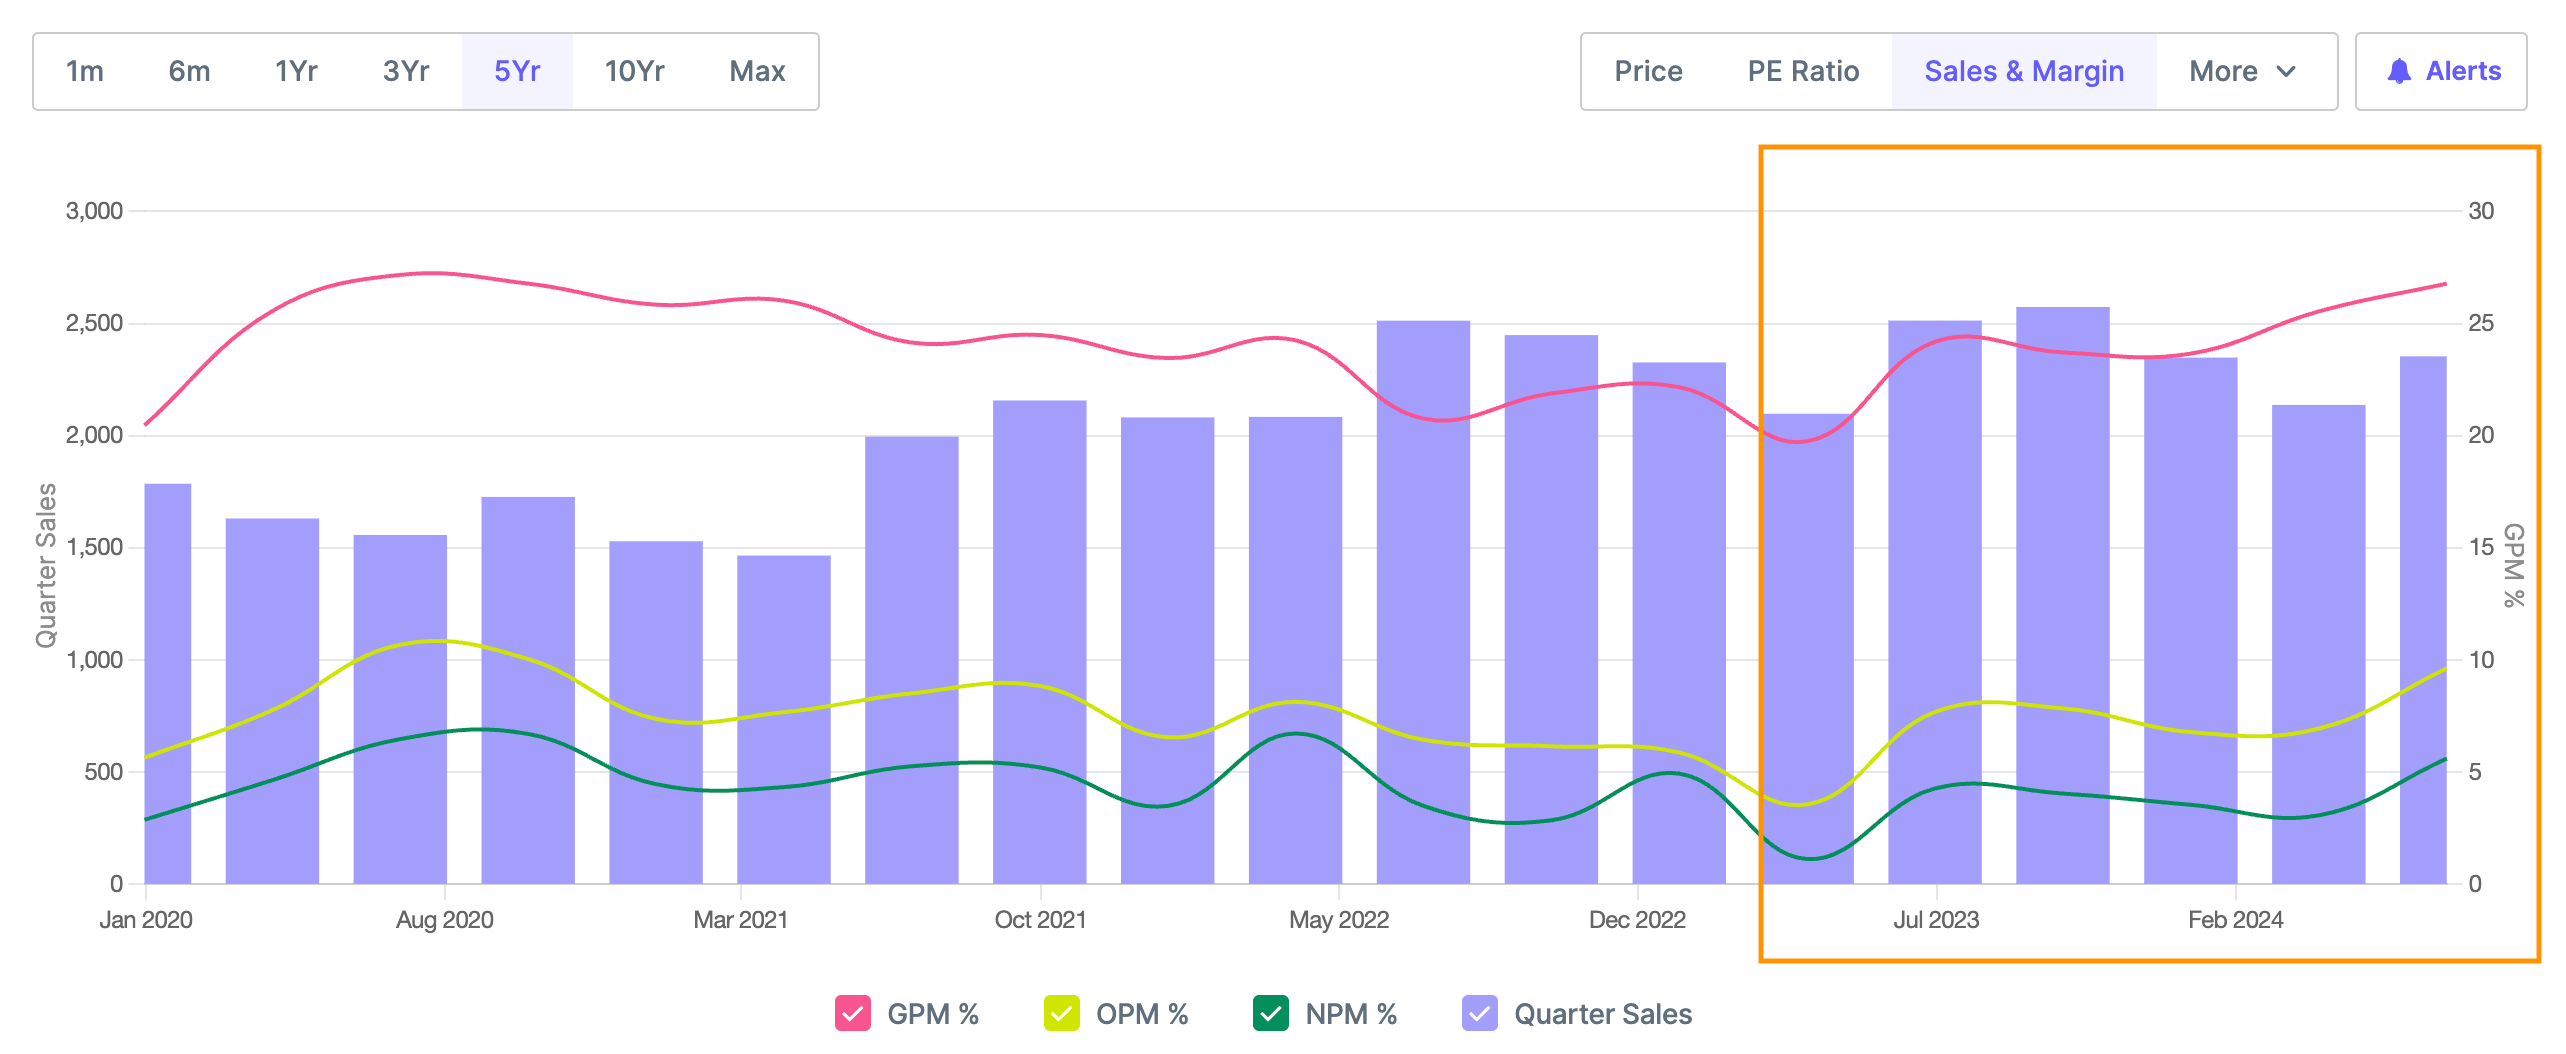
Operational metrics performance - Below chart shows Gross, Operating and Net Profit Margin improving quarterly since Mar 2023 but revenue being consistent from July 2023
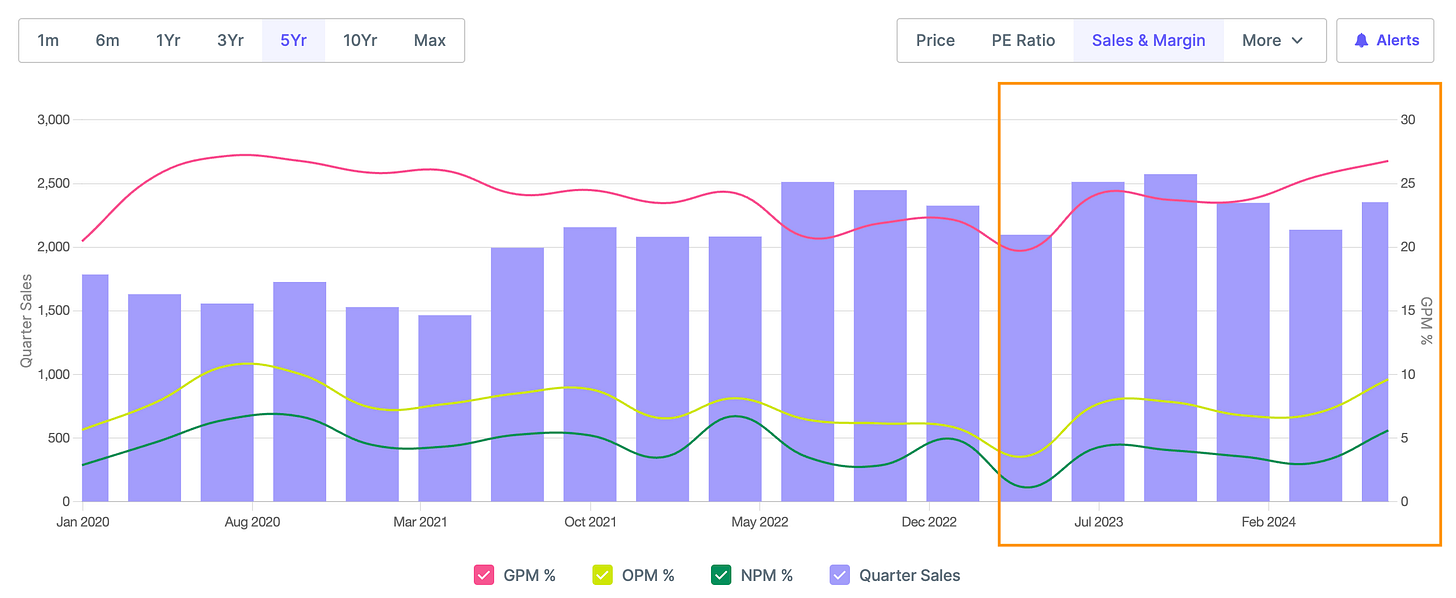
Q1 25 results (QoQ Increase) - Sales increased by 10% and Profits increased by 72%
Q1 25 results (YoY increase) - Sales decreased by 6% and Profits increased by 25%
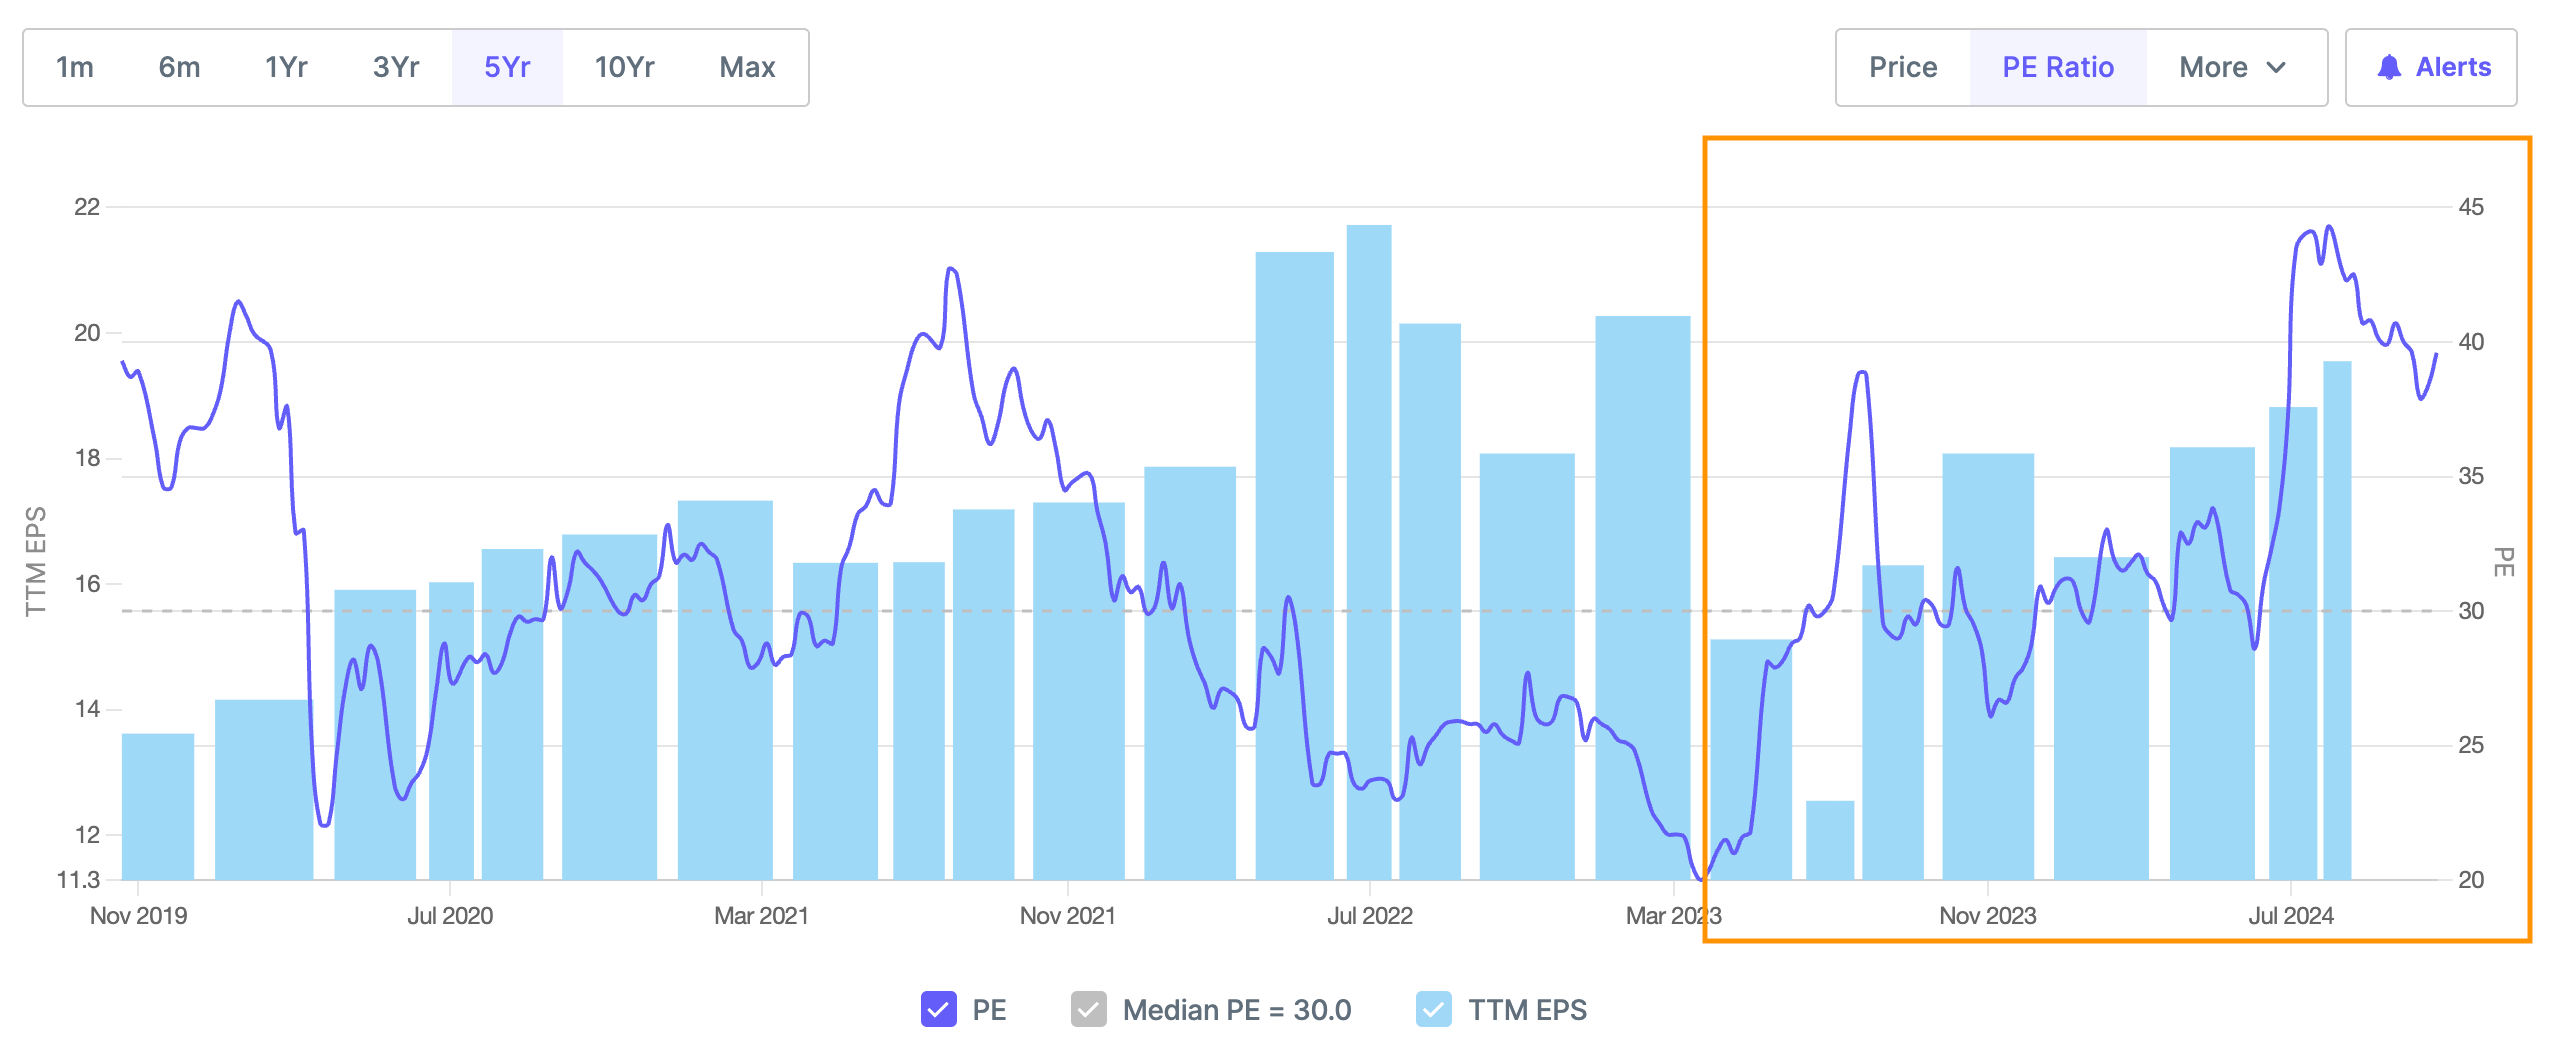
Valuations and EPS - Below chart shows Price has grown faster than TTM EPS (EPS of last 4 quarters) leading to a PE of 40, and above historical average
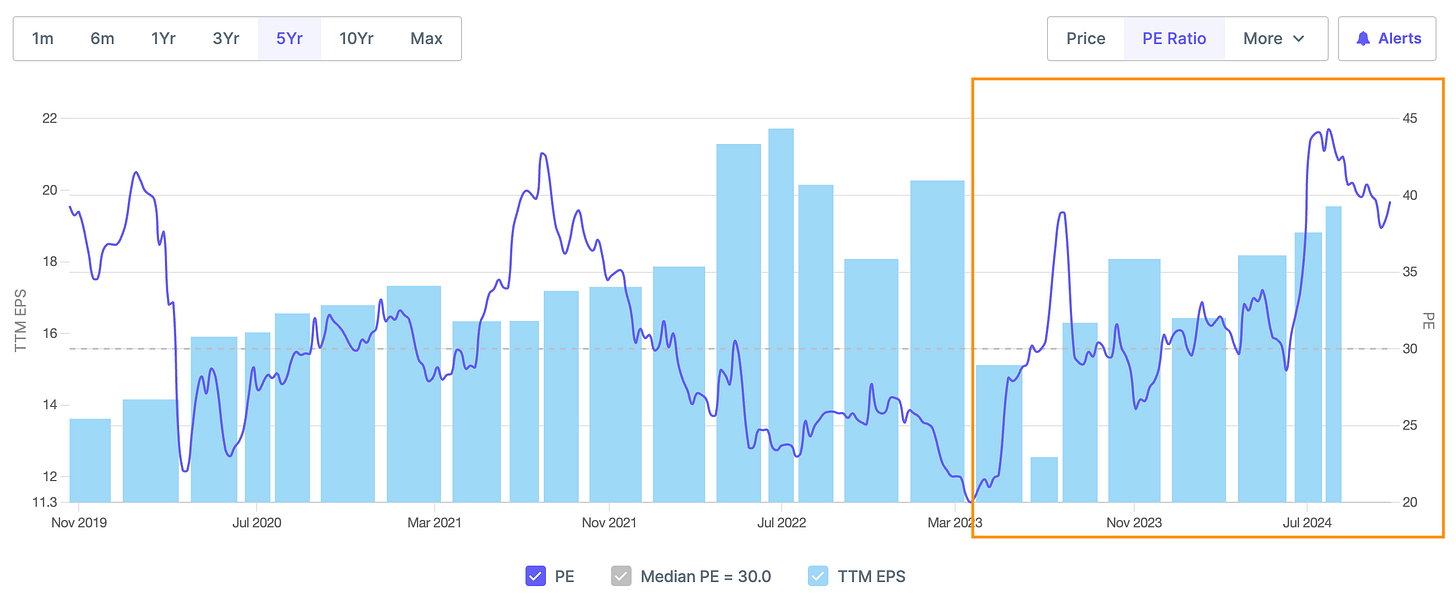
PE at 40 i.e. above historical average
TTM EPS (EPS of Last 4 quarters) - Growing consistently QoQ since May 2023
What led to outperformance
Margin Expansion
Consolidated EBITDA margin improved to 10.8% in Q1 FY25 from 8.2% in Q1 FY24, driven by robust volumes and improved realization in the domestic Crop Protection business and margin expansion in Animal Feed and Dairy businesses.
Animal Feed Segment Performance
Segment margins improved sharply from 4.2% in Q1 FY24 to 6.8% in Q1 FY25, with EBIT/MT rising from ₹1,443 to ₹2,258, due to favorable commodity positions allowing for better cost management.
Crop Protection Business Growth
Standalone Crop Protection segment margins improved from 32% in Q1 FY24 to 45% in Q1 FY25, primarily due to higher realization in herbicide and pesticides categories and volume growth in Plant Growth Regulators.
Dairy Segment Improvement
EBITDA margins in the Dairy segment improved by 490 basis points in Q1 FY25, driven by operational efficiency gains and an improved milk spread, despite a flat top line.
Cost Management
Profit before tax (excluding non-recurring items) improved by 36% to ₹169 crores in Q1 FY25, reflecting effective cost control measures and improved operational efficiencies across segments.
Value-Added Products Focus
Value-Added Products' salience in the Dairy segment improved from 36% of total sales in Q1 FY24 to 42% in Q1 FY25, reflecting successful portfolio optimization efforts leading to higher margins.
Strategic Shift in Poultry
Increased focus on branded business in the Poultry segment, moving away from the more volatile live bird business, aiming to improve margin stability and reduce exposure to commodity price fluctuations.
Raw Material Management
Favorable commodity positions and efficient raw material management, particularly in the Animal Feed segment where the company is covered for major raw materials, contributed to margin improvements across segments
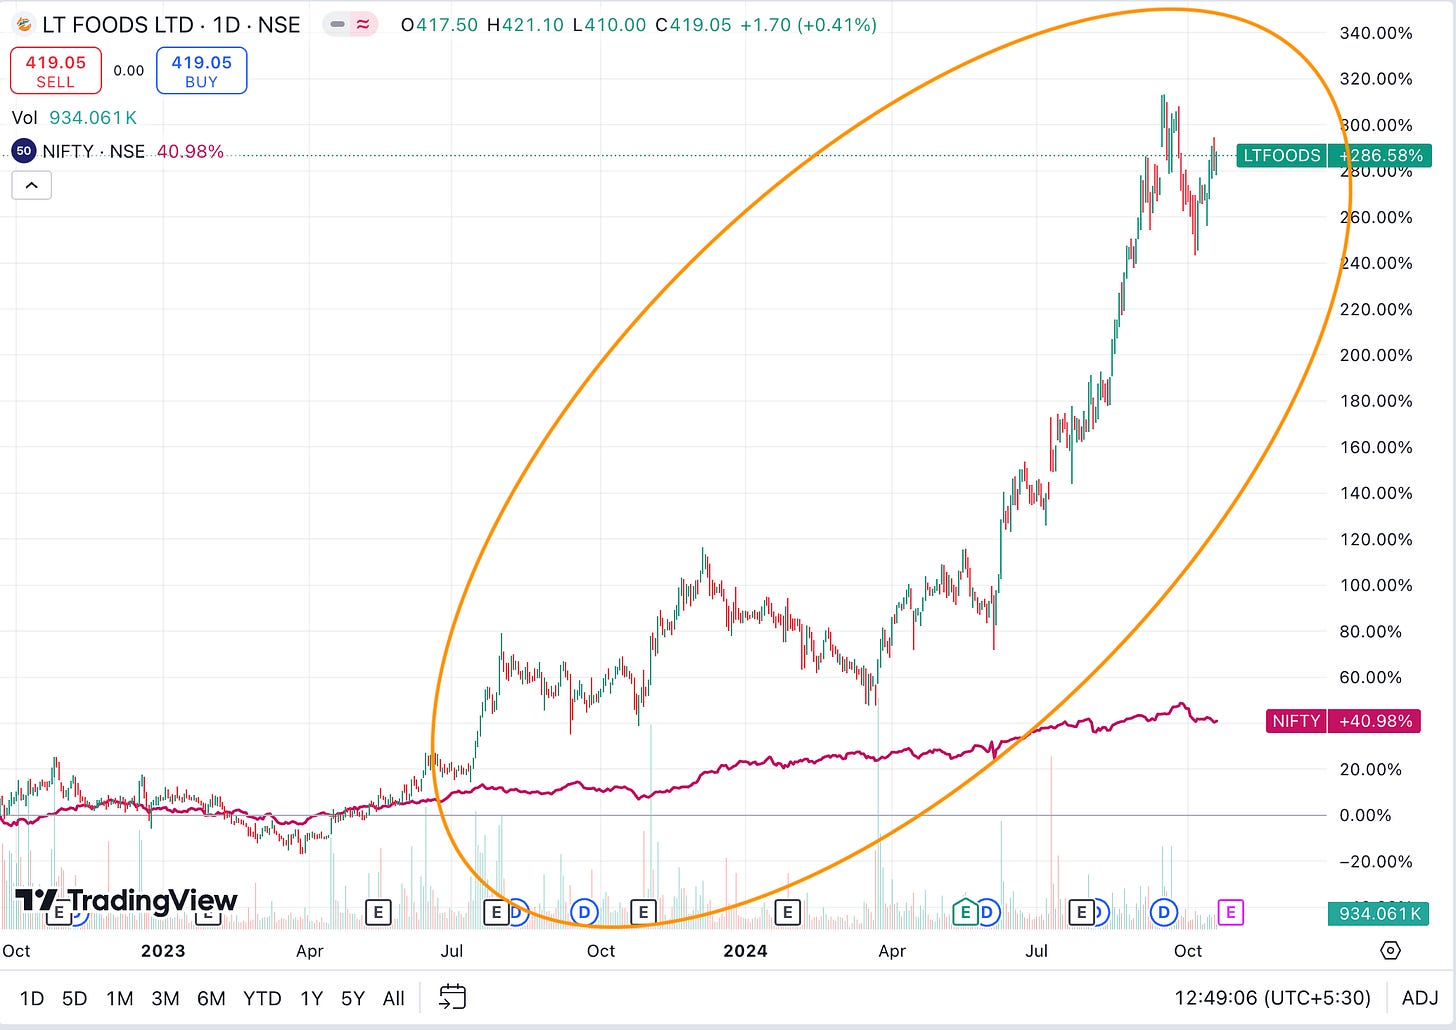
L T Foods Ltd - Market Cap 14,552 + Cr
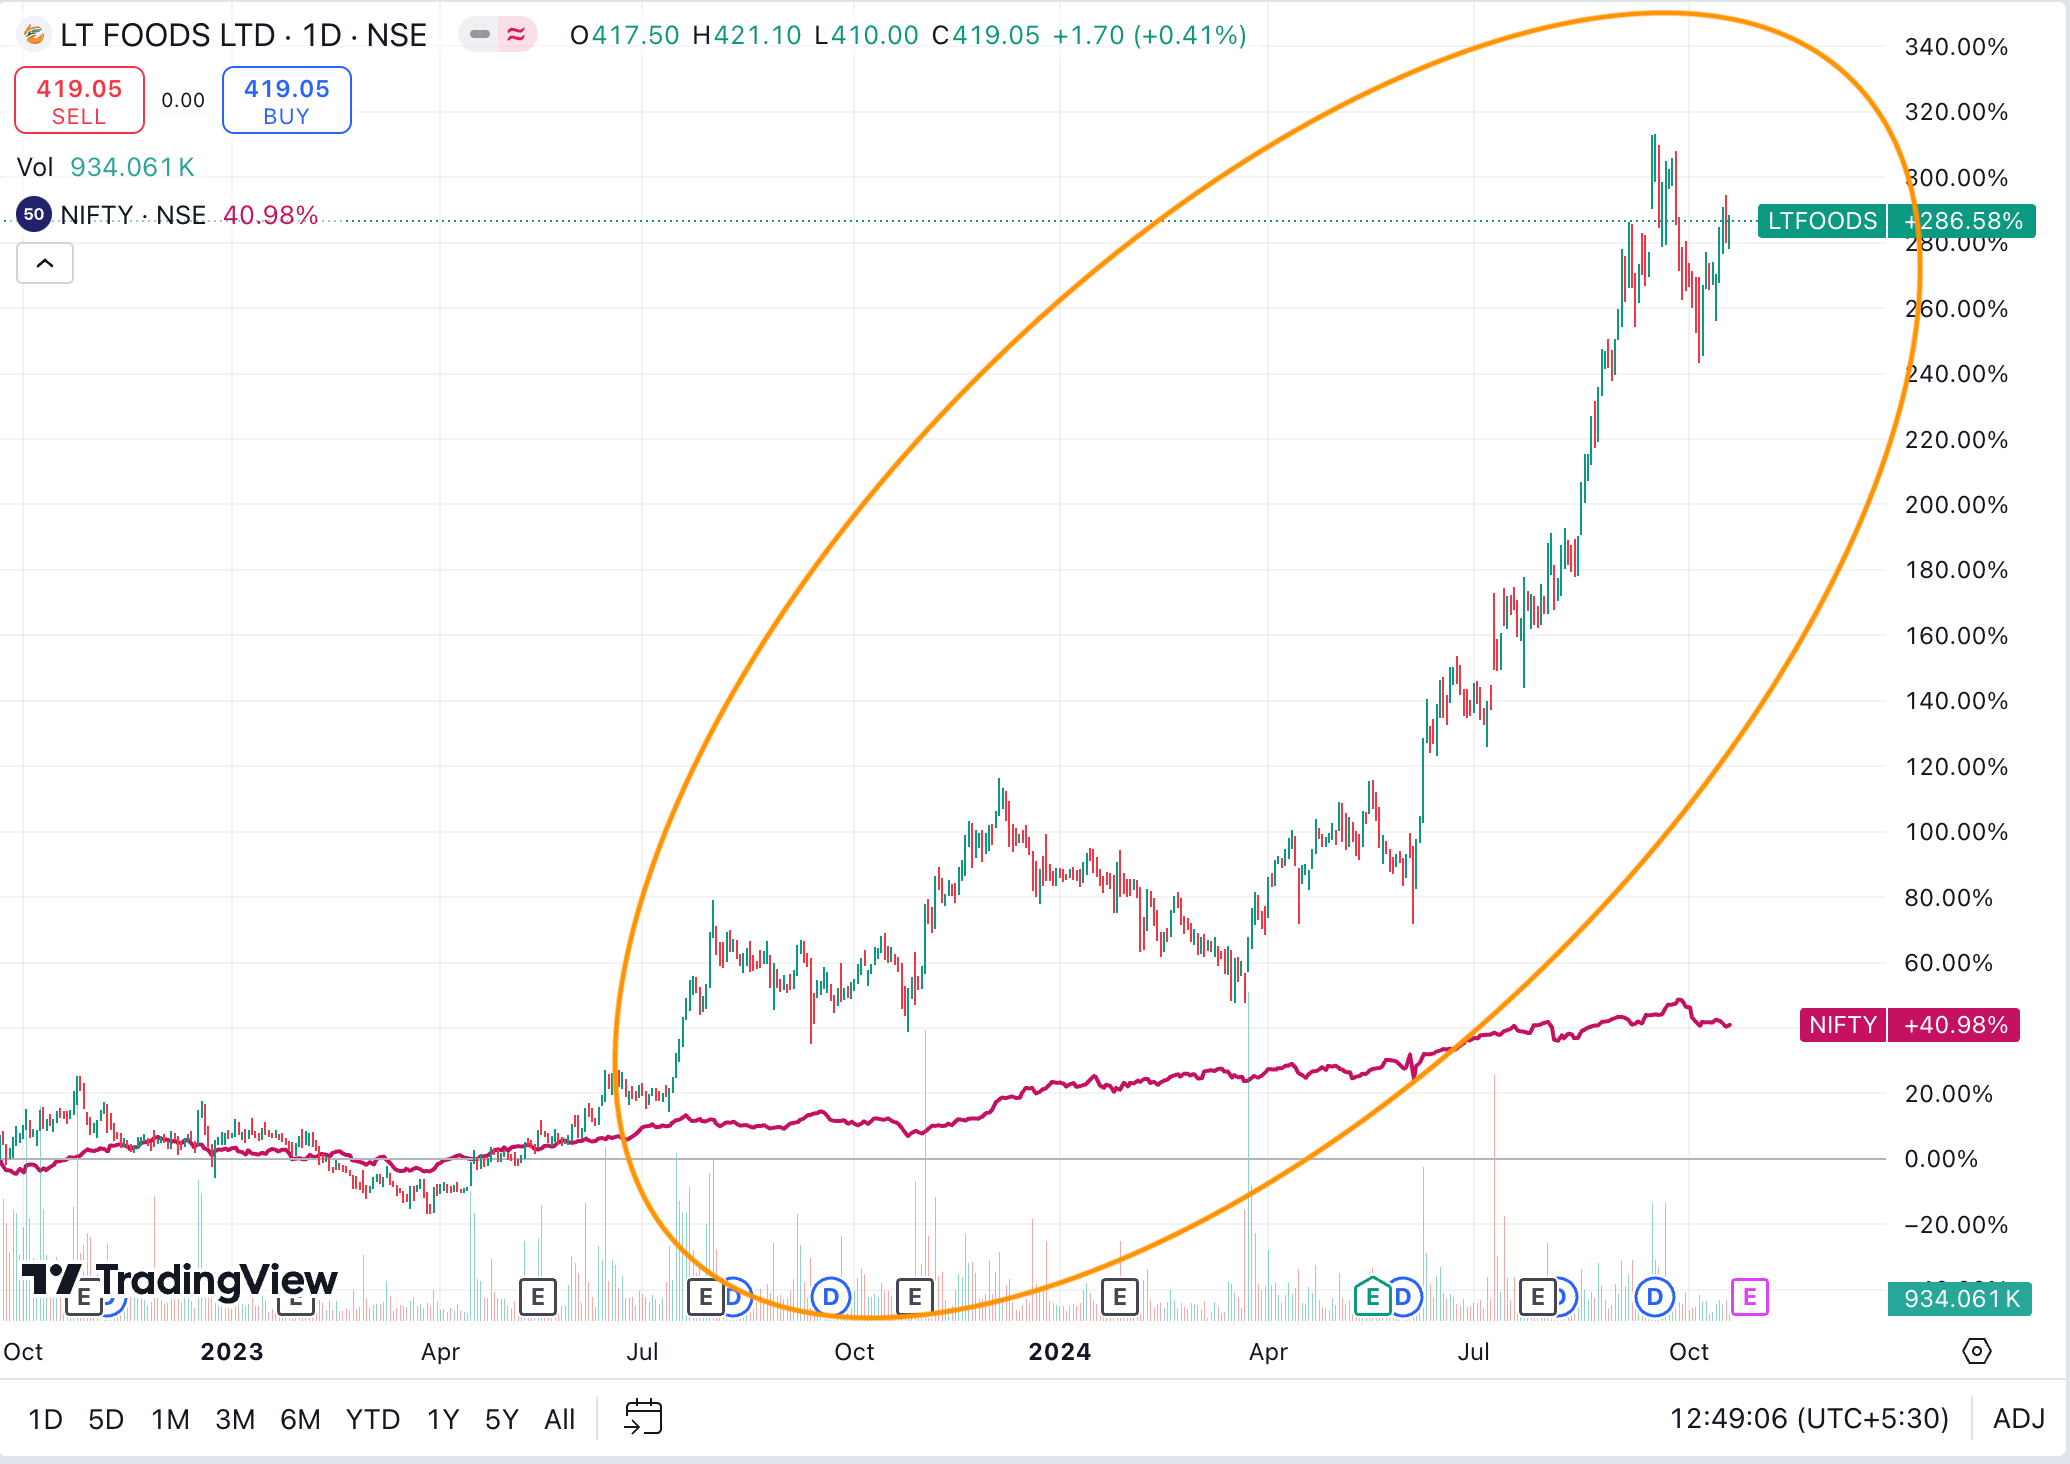
Price Action - Since Oct 22, L T Foods - 287%, NIFTY 41%
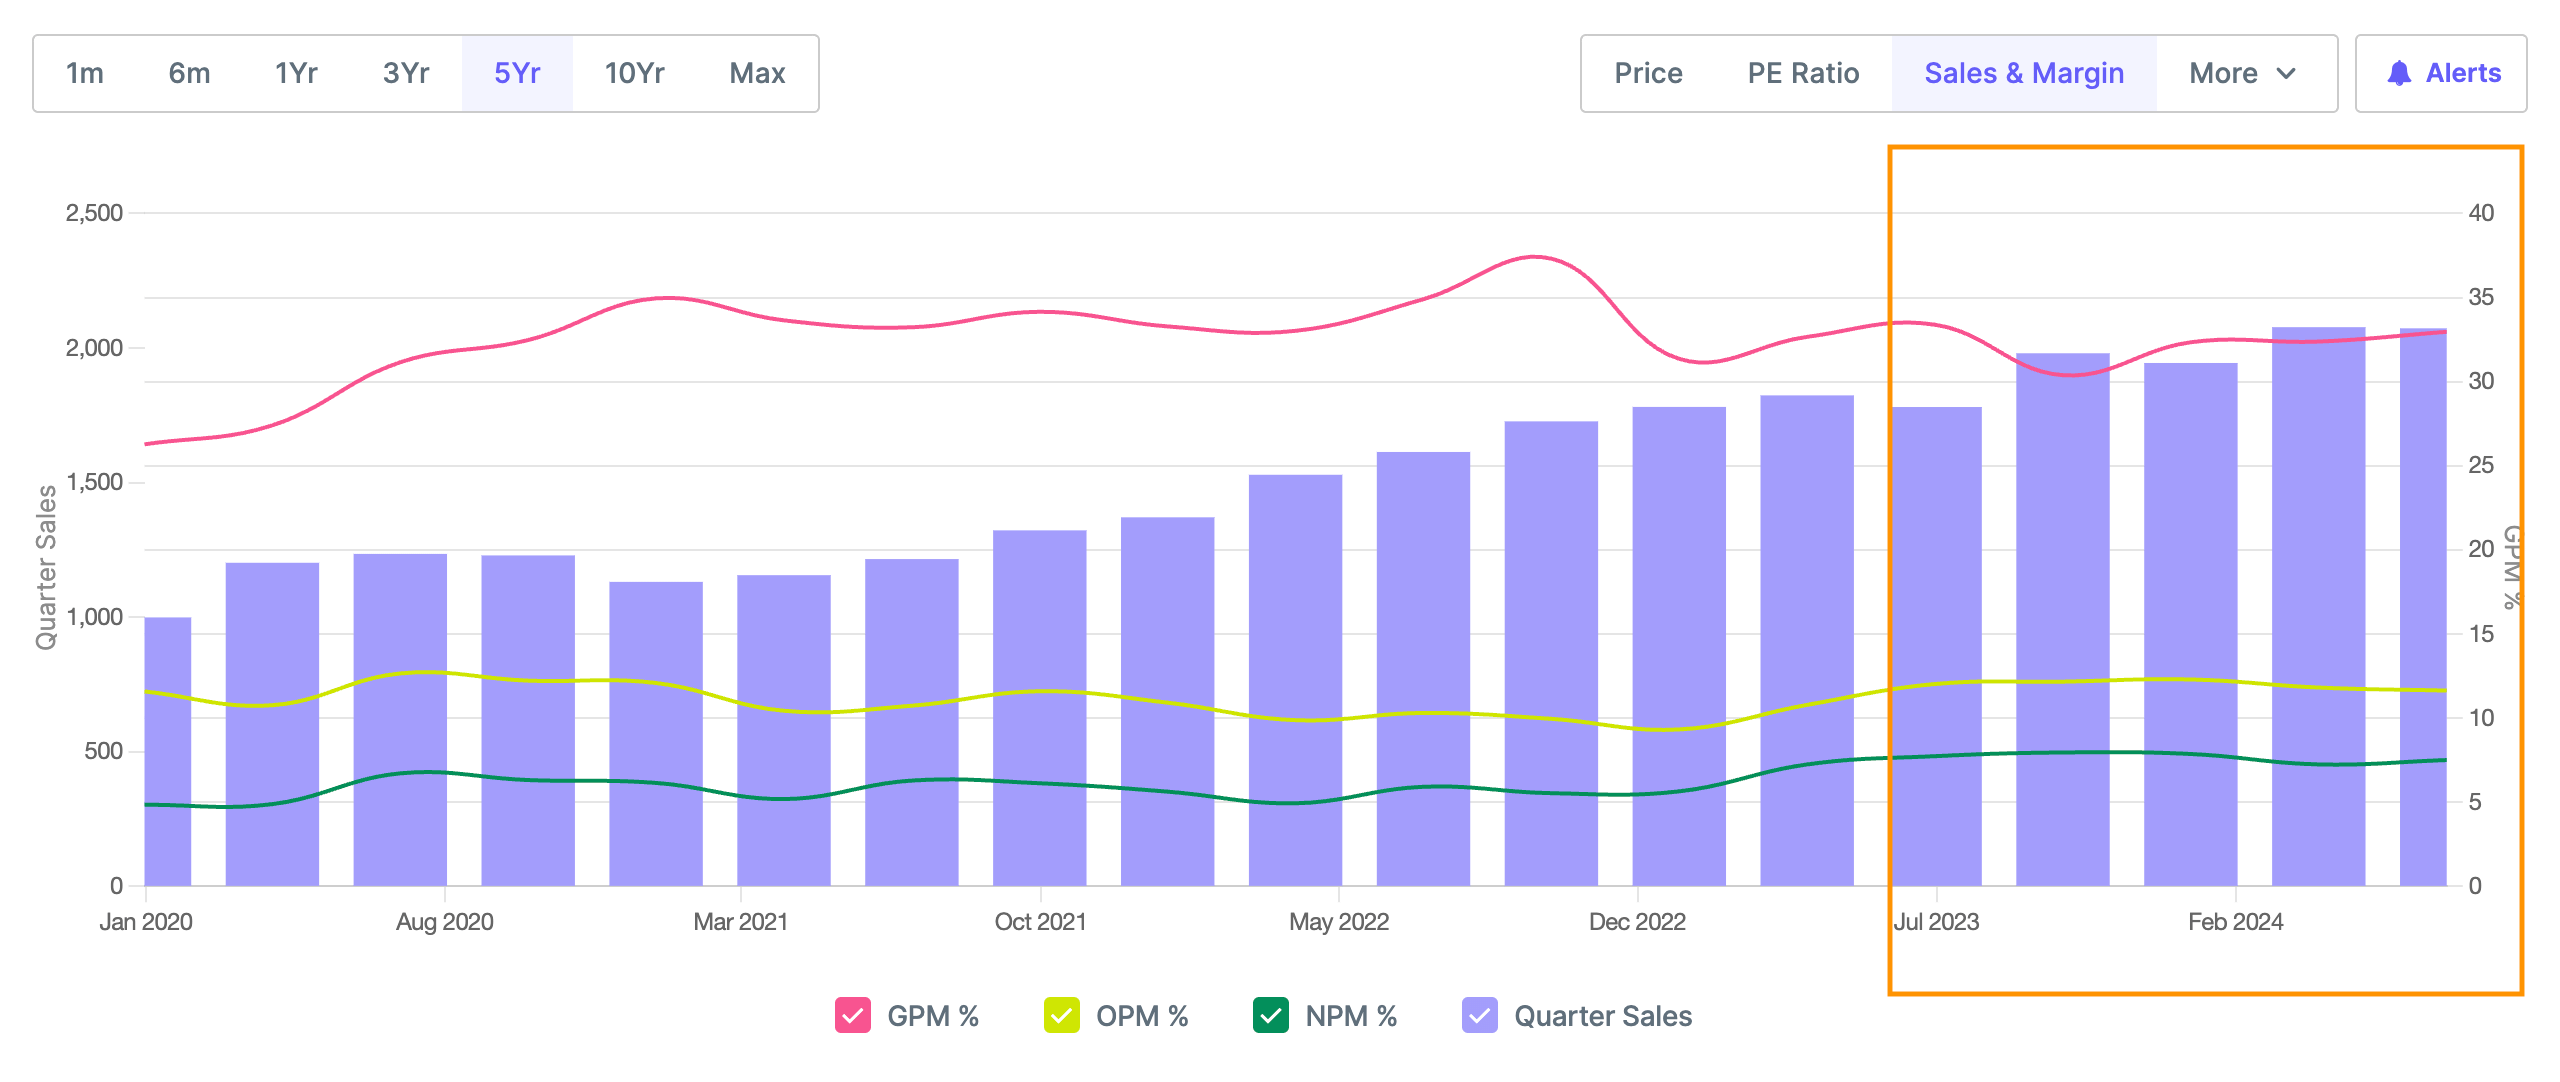
Operational metrics performance - Below chart shows Gross, Operating and Net Profit Margin improving quarterly since July 2022 but revenue scaling up from Oct 2021
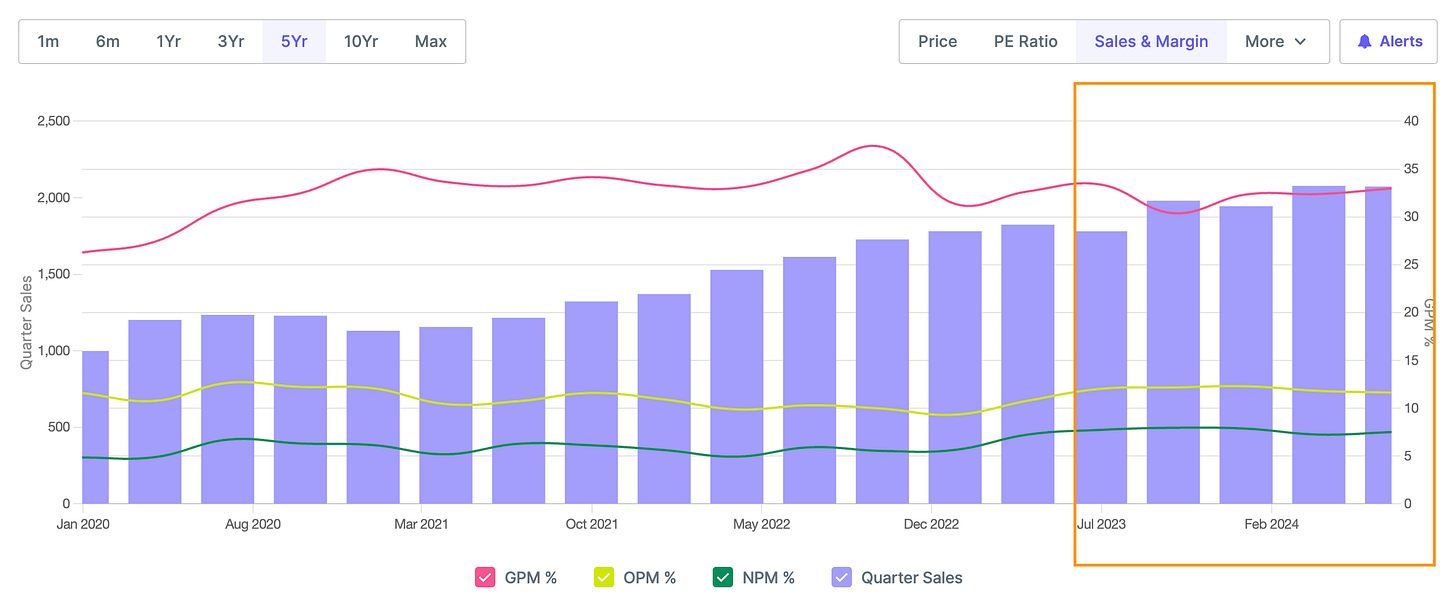
Q1 25 results (QoQ Increase) - Sales increased by 0% and Profits increased by 15%
Q1 25 results (YoY increase) - Sales increased by 16% and Profits decreased by 3%
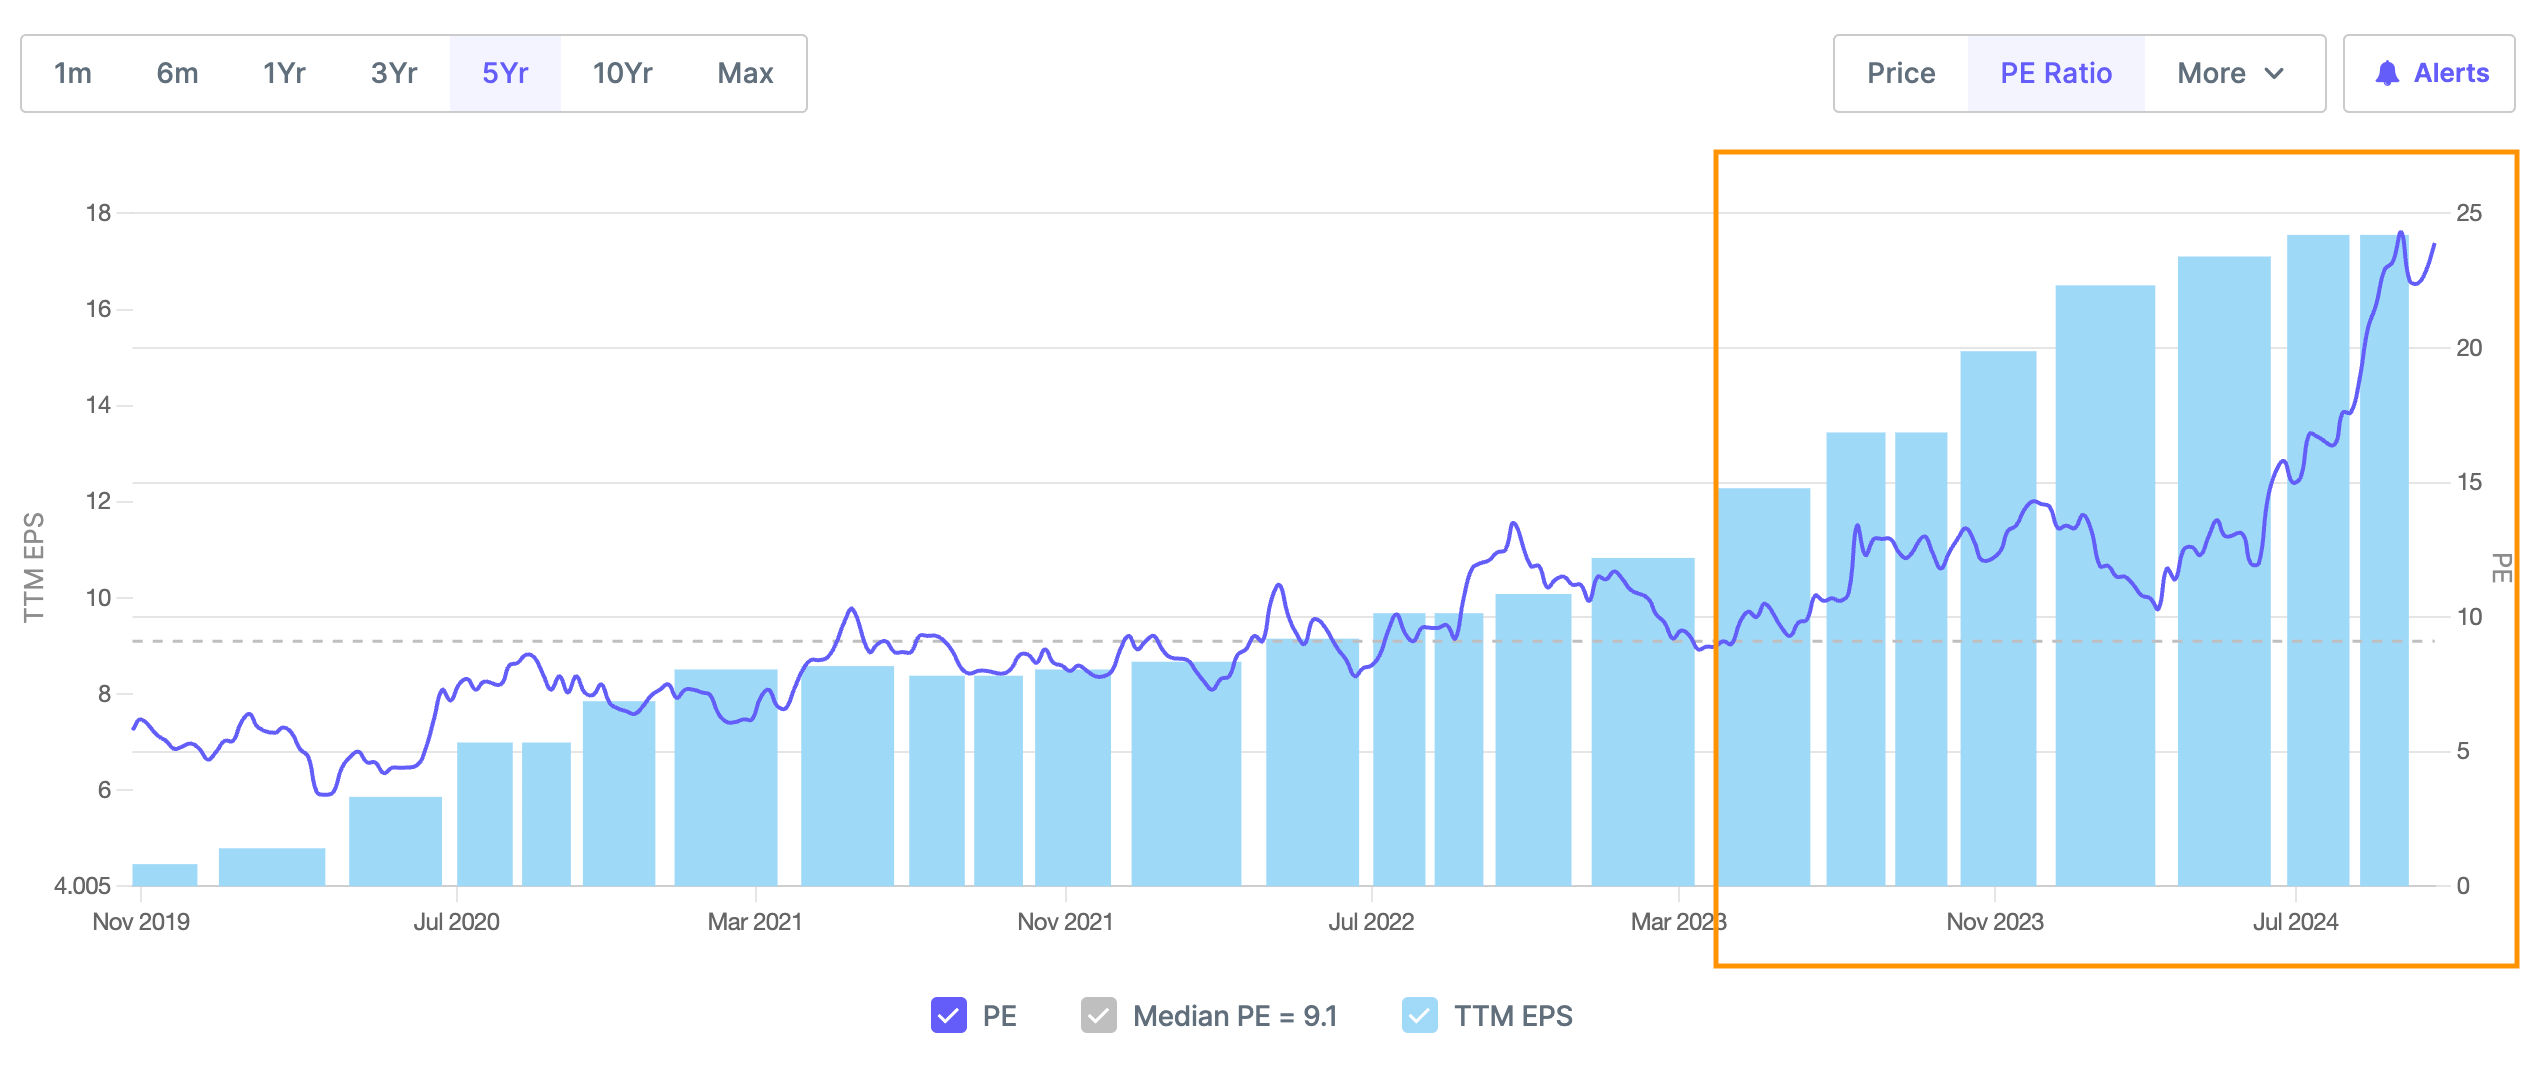
Valuations and EPS - Below chart shows Price and TTM EPS (EPS of last 4 quarters) has grown at the same rate from April 2023 to Jan 2024 and from Jan 2024 price has grown at a faster rate than TTM EPS leading to PE 24 i.e. being over valued as compared to historical average of 10.
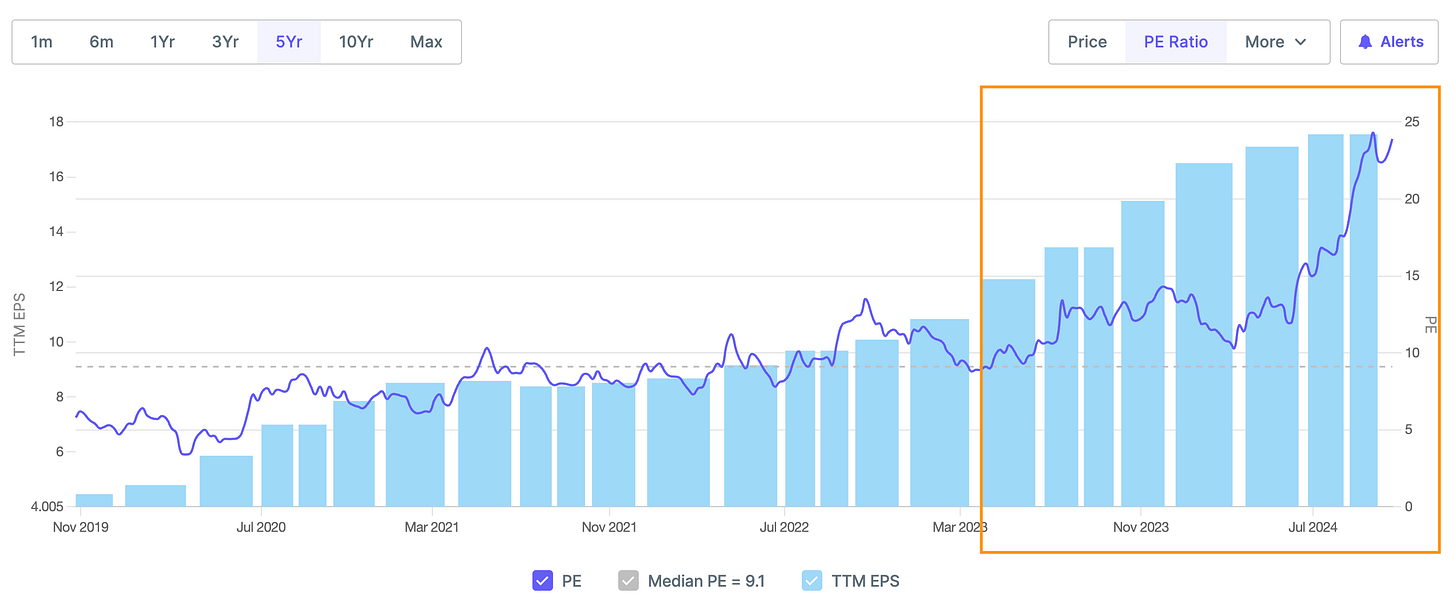
PE has expanded to 24 i.e. above historical average
TTM EPS (EPS of Last 4 quarters) - Growing consistently QoQ since May 2023
What led to outperformance
Revenue Growth
Consolidated revenue grew by 17% year-on-year to INR 2,088 crores in Q1 FY25, driven by increased sales across all segments.
EBITDA Expansion
EBITDA increased by 15% year-on-year to INR 258 crores in Q1 FY25, with EBITDA margin maintained at 12.4% despite input cost pressures.
Profit Growth
Profit before tax (PBT) increased by 18% to INR 198 crores, while profit after tax (PAT) grew by 13% to INR 155 crores in Q1 FY25.
International Business Performance
International business grew by approximately 17% year-on-year, indicating strong demand in key markets like USA and Europe.
Value-Added Products Focus
Increased focus on value-added products, with plans to double capacity for ready-to-heat products in the USA, driving higher margins.
Operational Efficiency
Net working capital days reduced by 8 days to 202 days compared to Q1 FY24, reflecting improved operational efficiency and working capital management.
Debt Reduction
Debt-to-equity ratio improved from 0.4x to 0.2x, while debt-to-EBITDA ratio improved from 1.2x to 0.8x in Q1 FY25, indicating stronger financial position.
Market Expansion
Entry into new markets like Saudi Arabia and plans to launch Daawat Jasmine rice in India, providing potential for further growth and operating leverage.y
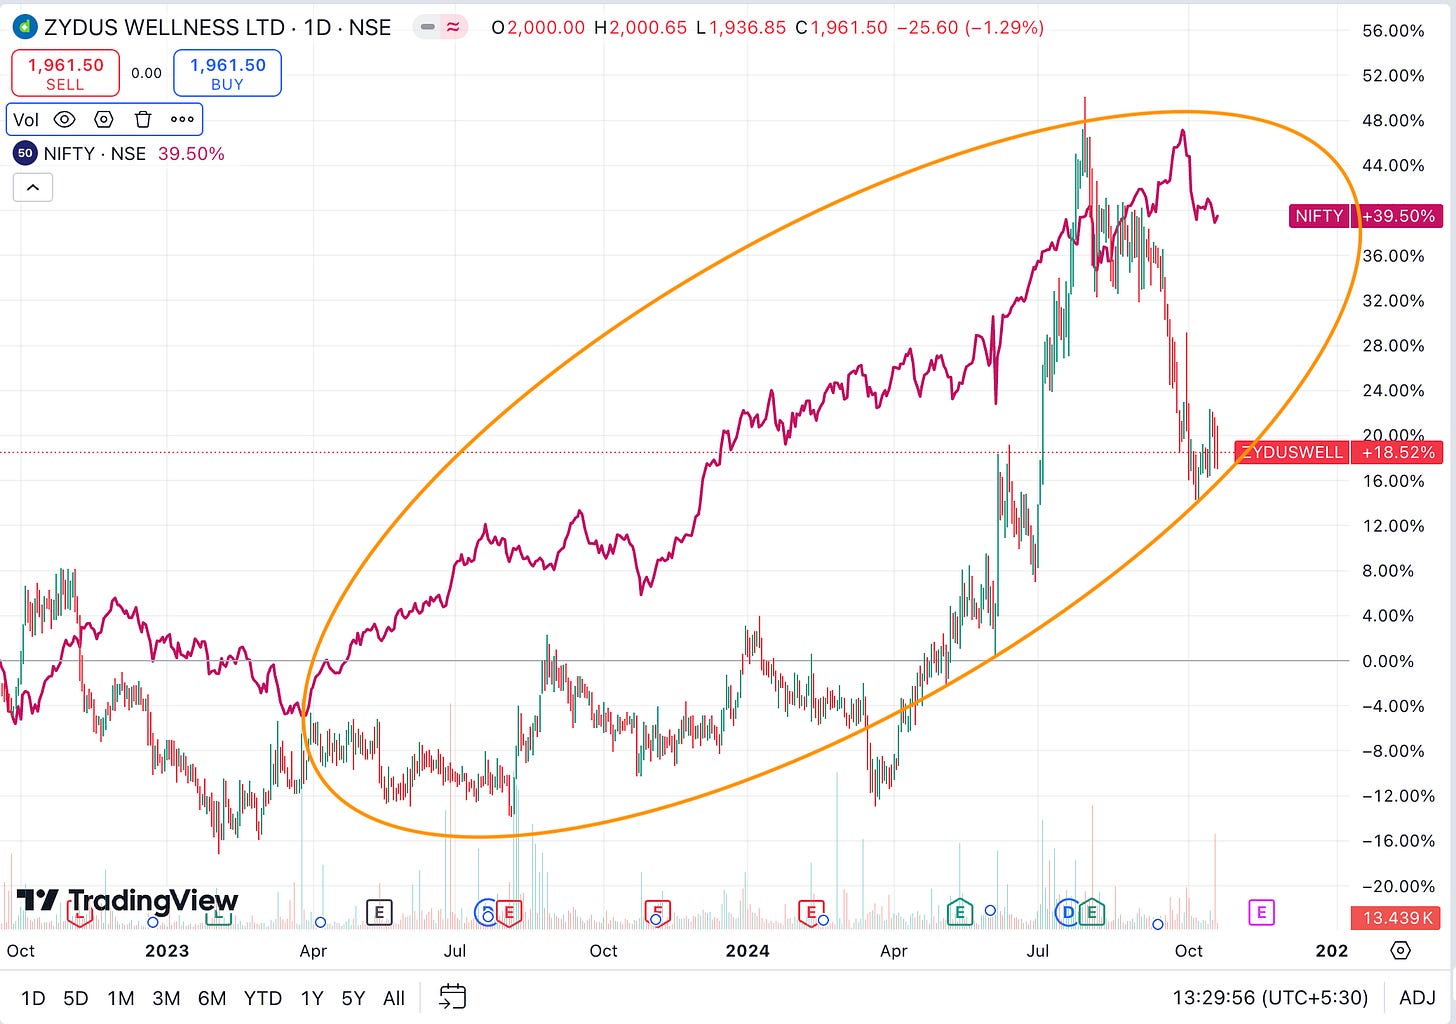
Zydus Wellness Ltd - Market Cap 12,481 + Cr
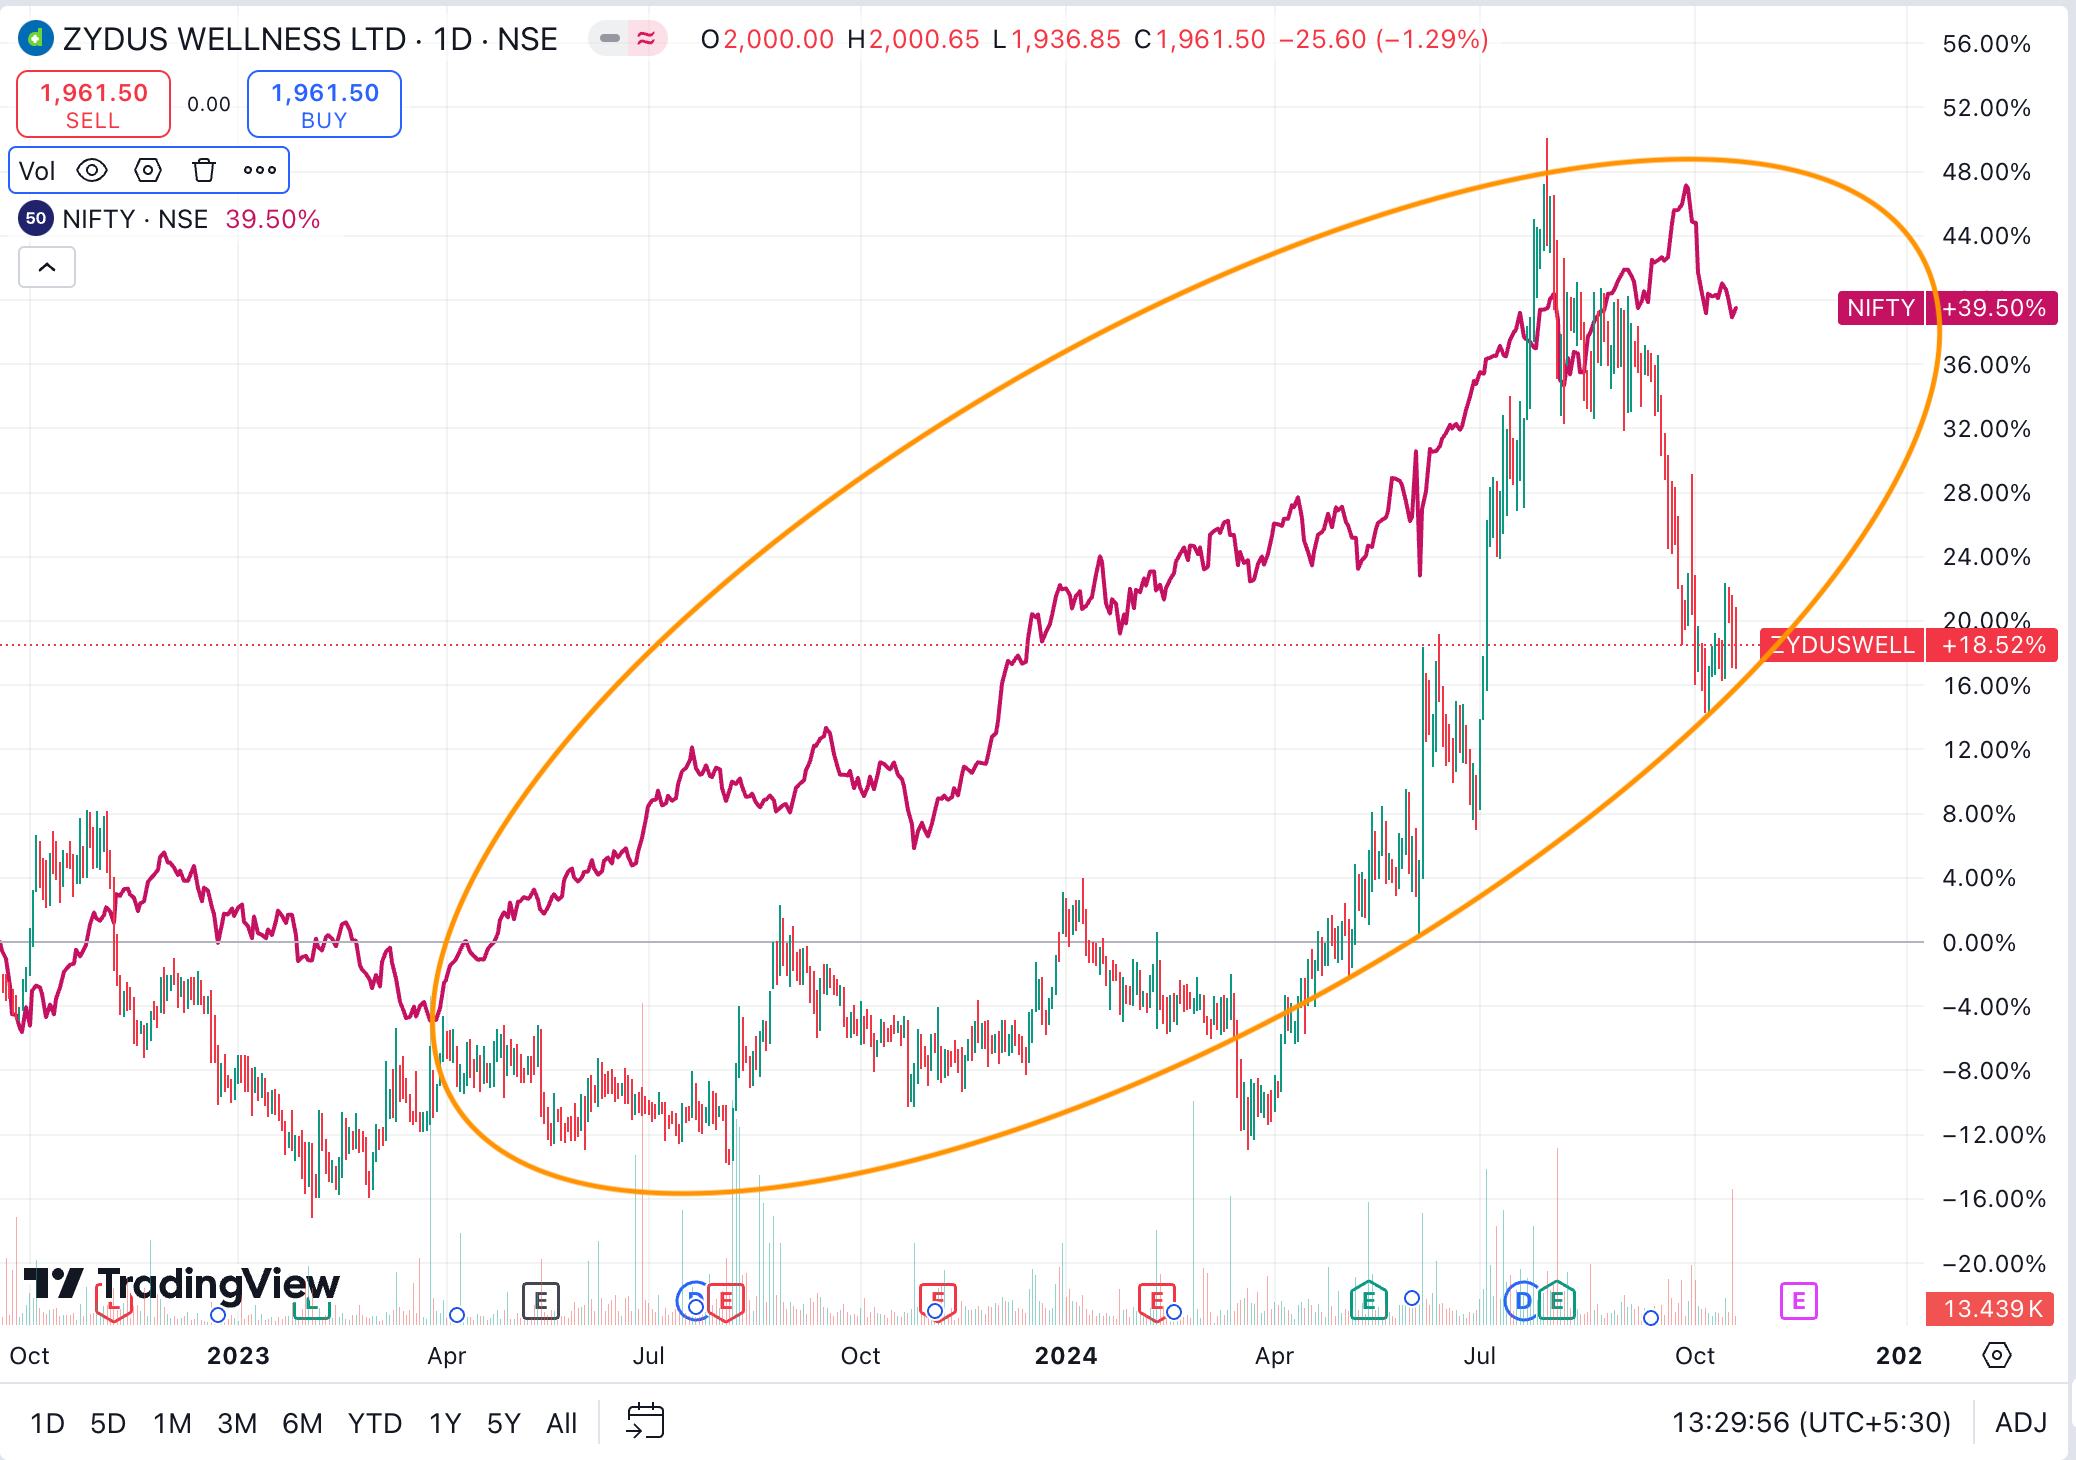
Price Action - Since Oct 22, Zydus Wellness - 18%, NIFTY 39%
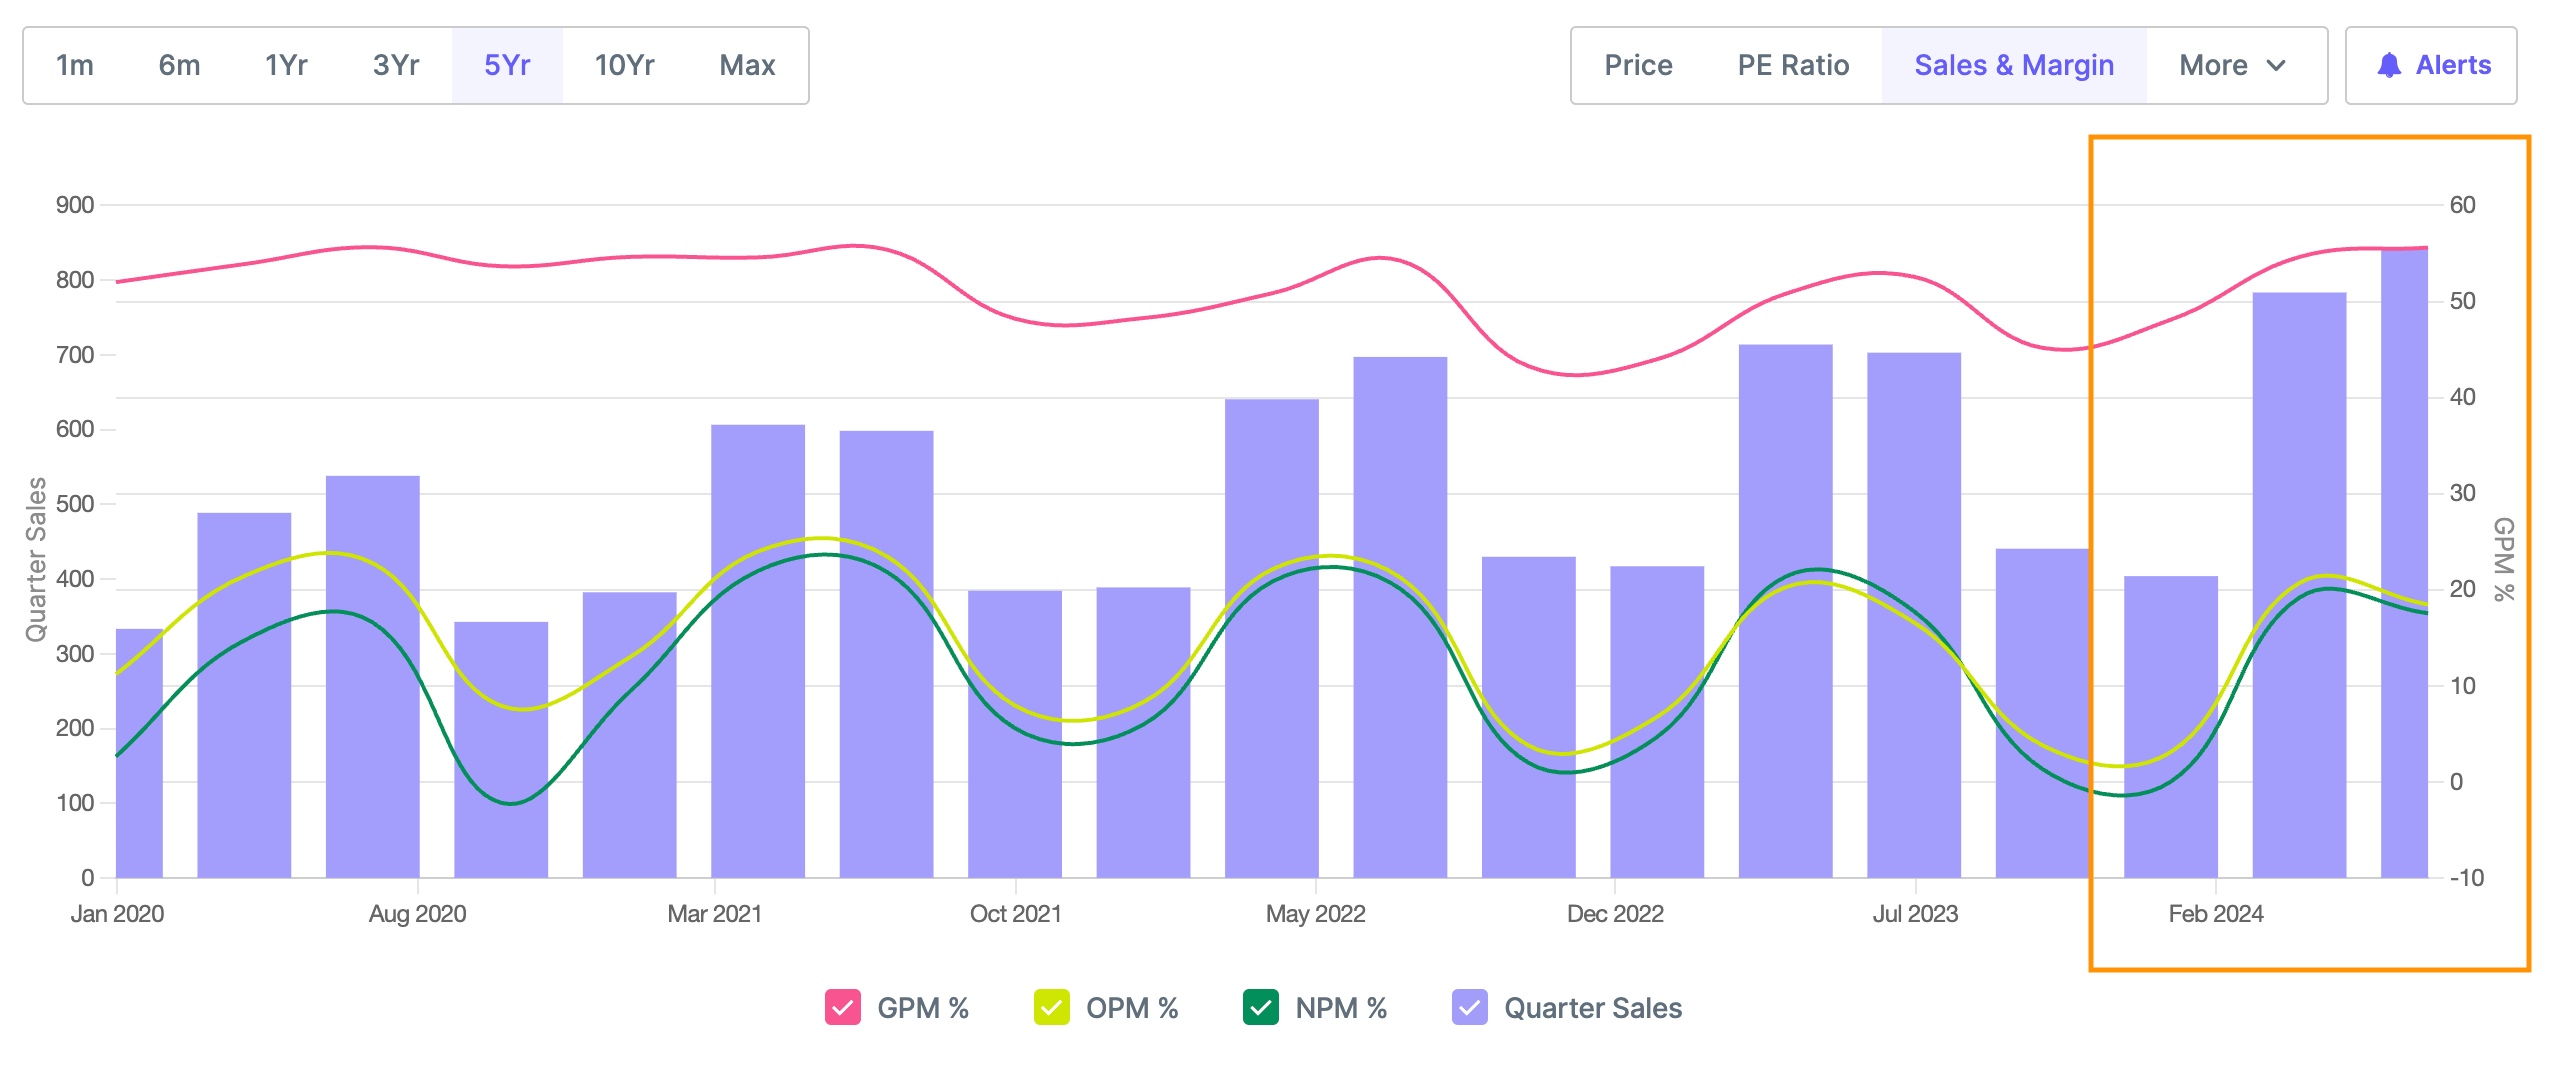
Operational metrics performance - Below chart shows Gross, Operating and Net Profit Margin following similar cyclical pattern showing consistent recovery in recent quarters
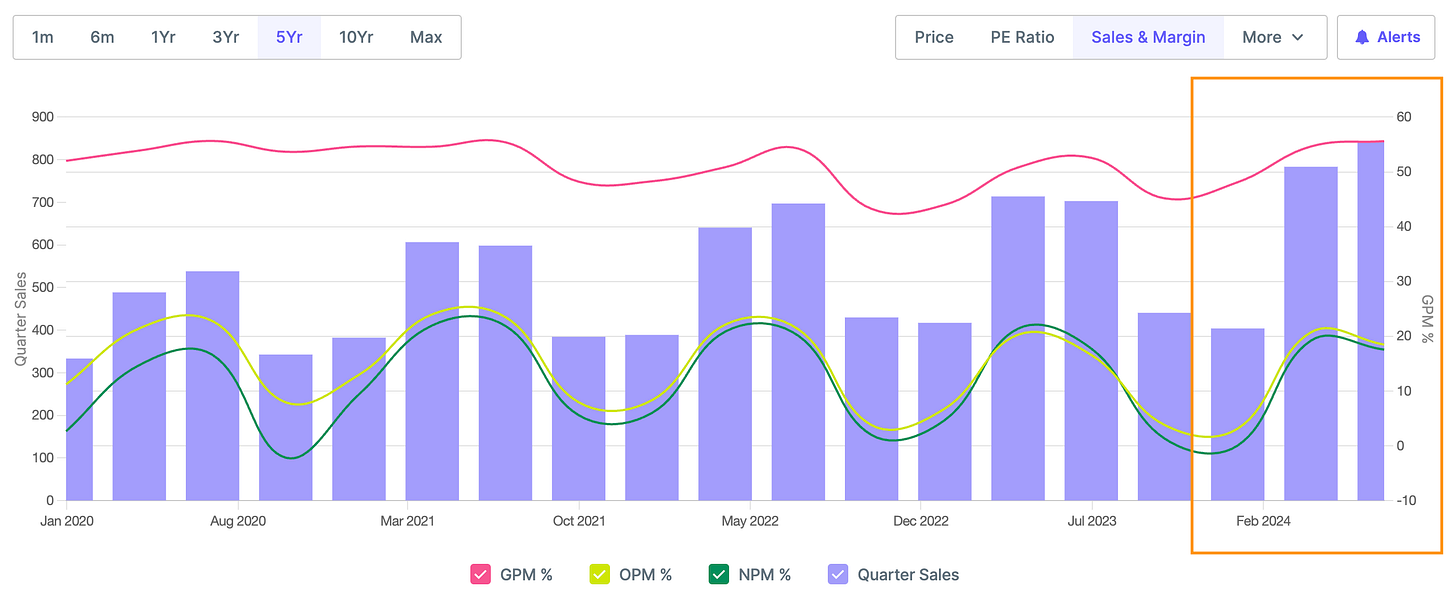
Q1 25 results (QoQ Increase) - Sales increased by 7% and Profits increased by 23%
Q1 25 results (YoY increase) - Sales increased by 20% and Profits increased by 11%
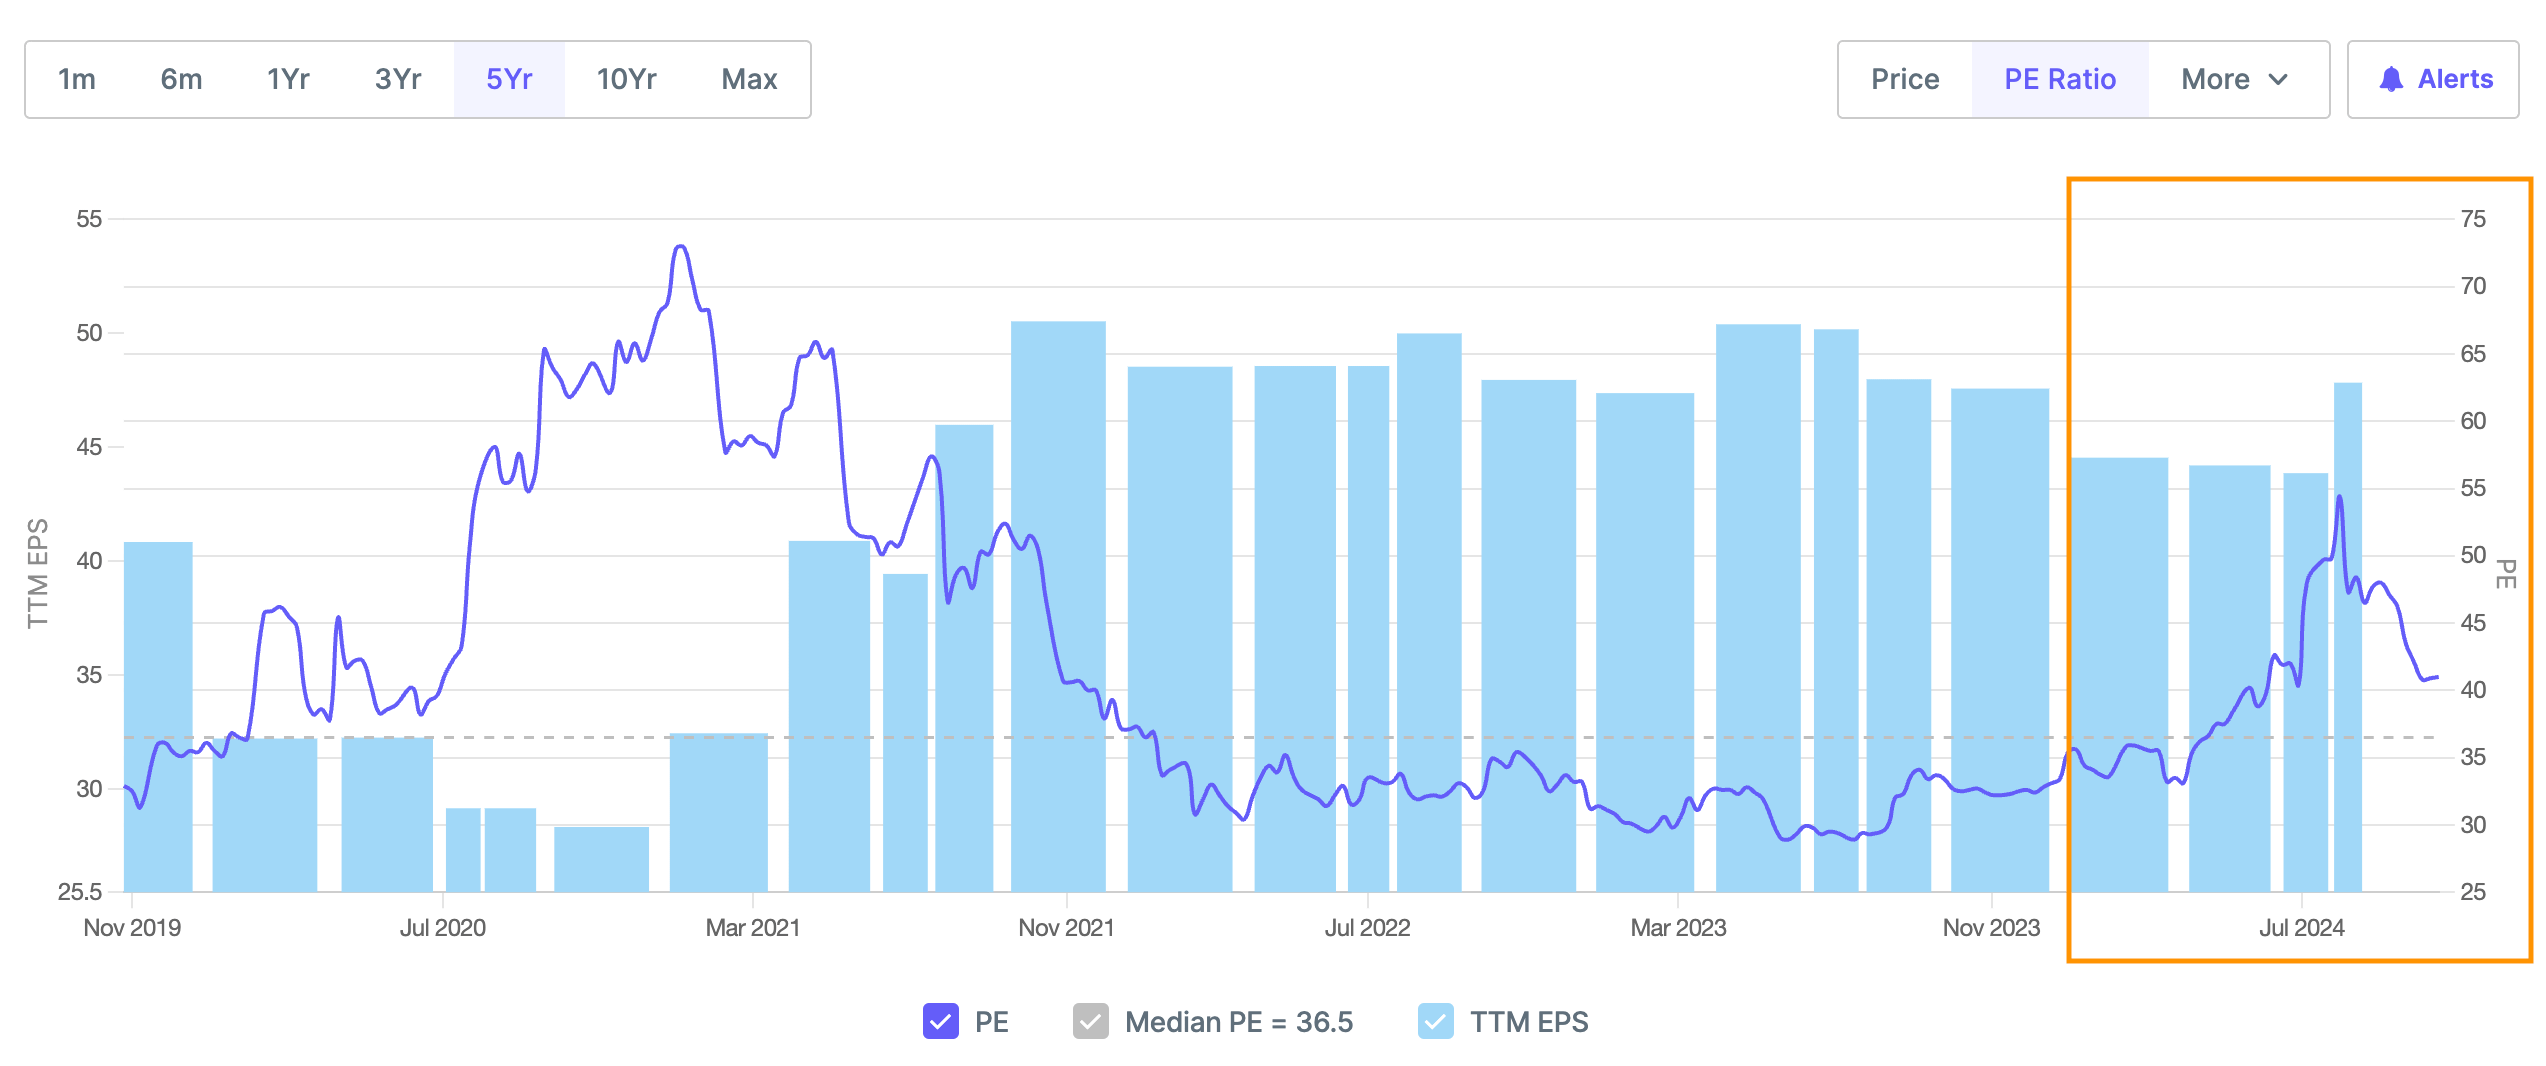
Valuations and EPS - Below chart shows Price and TTM EPS (EPS of last 4 quarters) has moved at the same rate from April 2023 to Jan 2024 and from Jan 2024 price has grown at a faster rate than EPS leading to PE at 40, i.e. overvalued from historical average of 35.
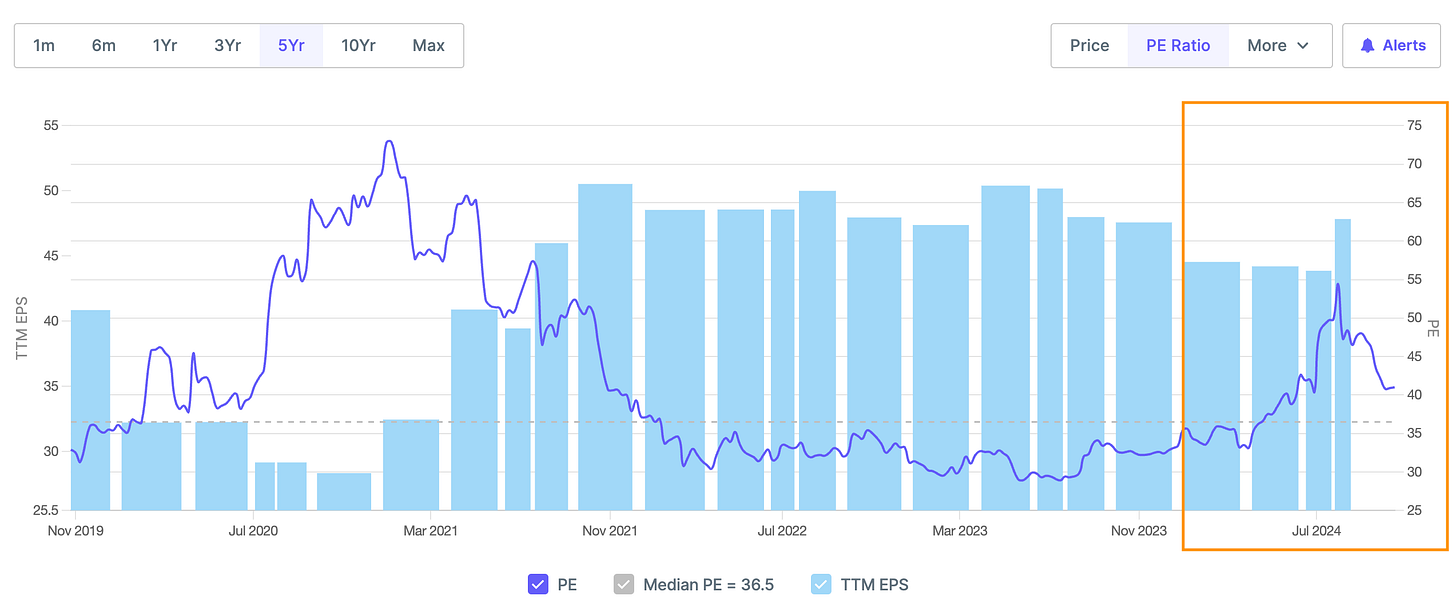
PE ratio is at 40, above historical average of 35
TTM EPS (EPS of Last 4 quarters) - relatively stable from July 22 to Nov 23, then slight decrease and then a jump in the latest quarter.
What led to outperformance
Revenue Growth
Consolidated net sales grew by 20% year-on-year, with 17.1% volume growth, indicating strong demand across categories.
Category Performance
Personal Care segment grew 41.8% year-on-year, while Food & Nutrition segment grew 15%, showing robust growth across key segments.
Margin Expansion
Gross margin improved by 314 basis points year-on-year and 114 basis points sequentially, driven by favorable product mix and commodity cost management.
EBITDA Growth
EBITDA grew by 33.3% year-on-year to INR 1,553 million, outpacing revenue growth and indicating operating leverage.
New Product Launches
Launched several new products across categories, with plans for 4 more innovations in coming quarters, potentially driving future growth.
Market Leadership
Maintained or improved market share across key categories like Everyuth, Nycil, Glucon-D, and Sugar Free, providing pricing power.
Distribution Expansion
Implemented hub-and-spoke model for suppliers, strengthening supply chain capabilities to support growth.
Debt Reduction
Repaid debt in full, deleveraging the balance sheet while maintaining a strong cash position, providing financial flexibility for future growth
Avanti Feeds Ltd - Market Cap 8,445+ Cr
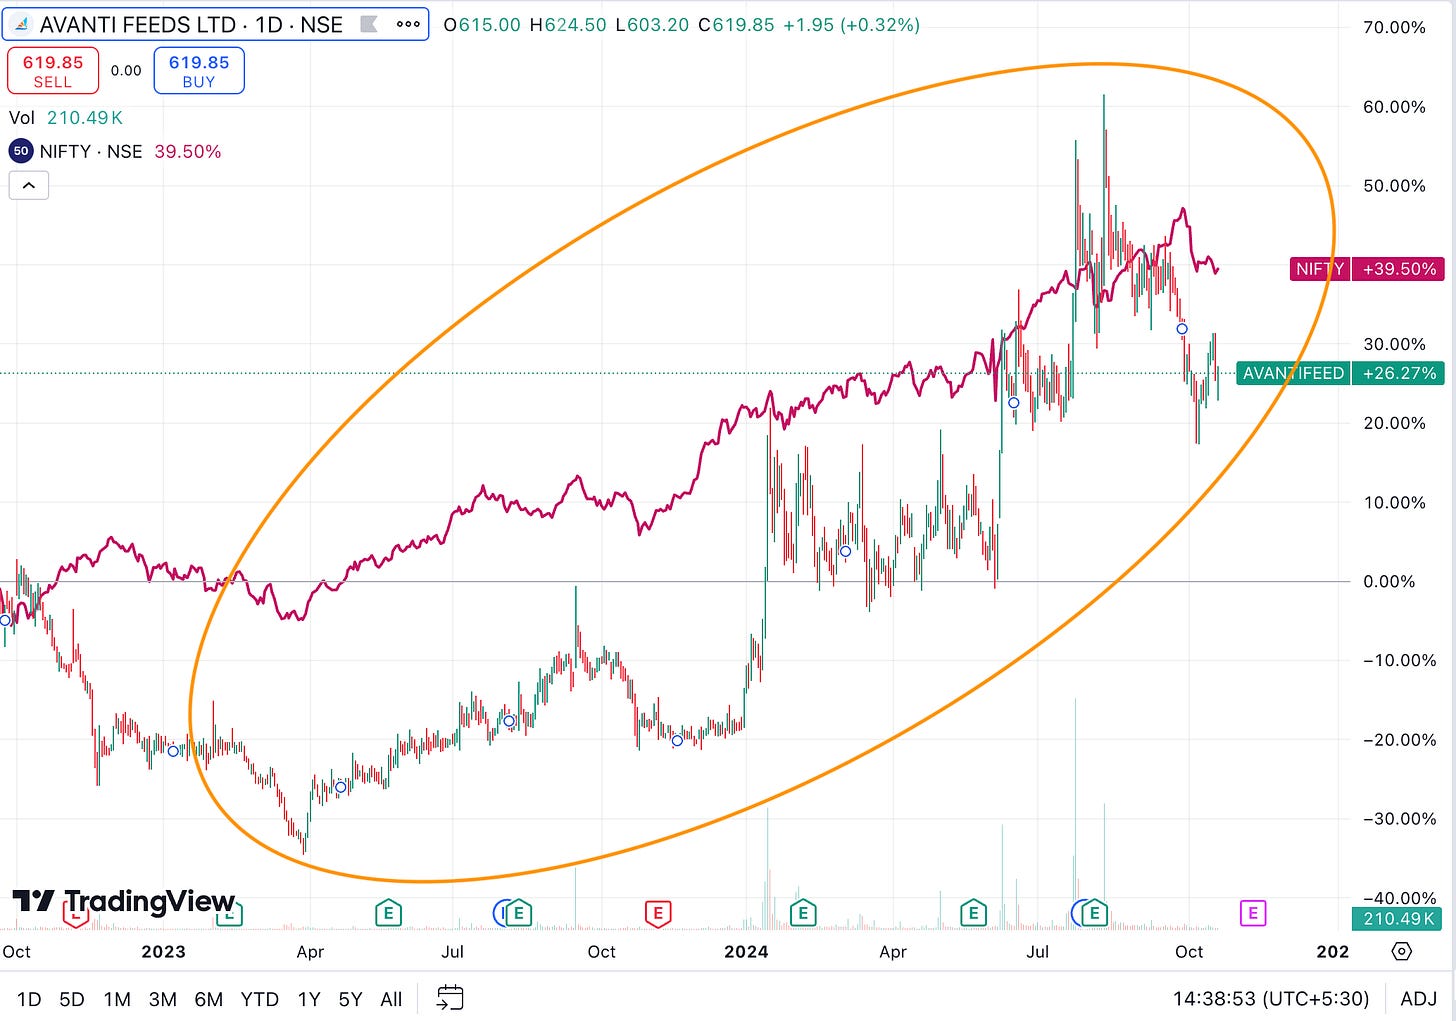
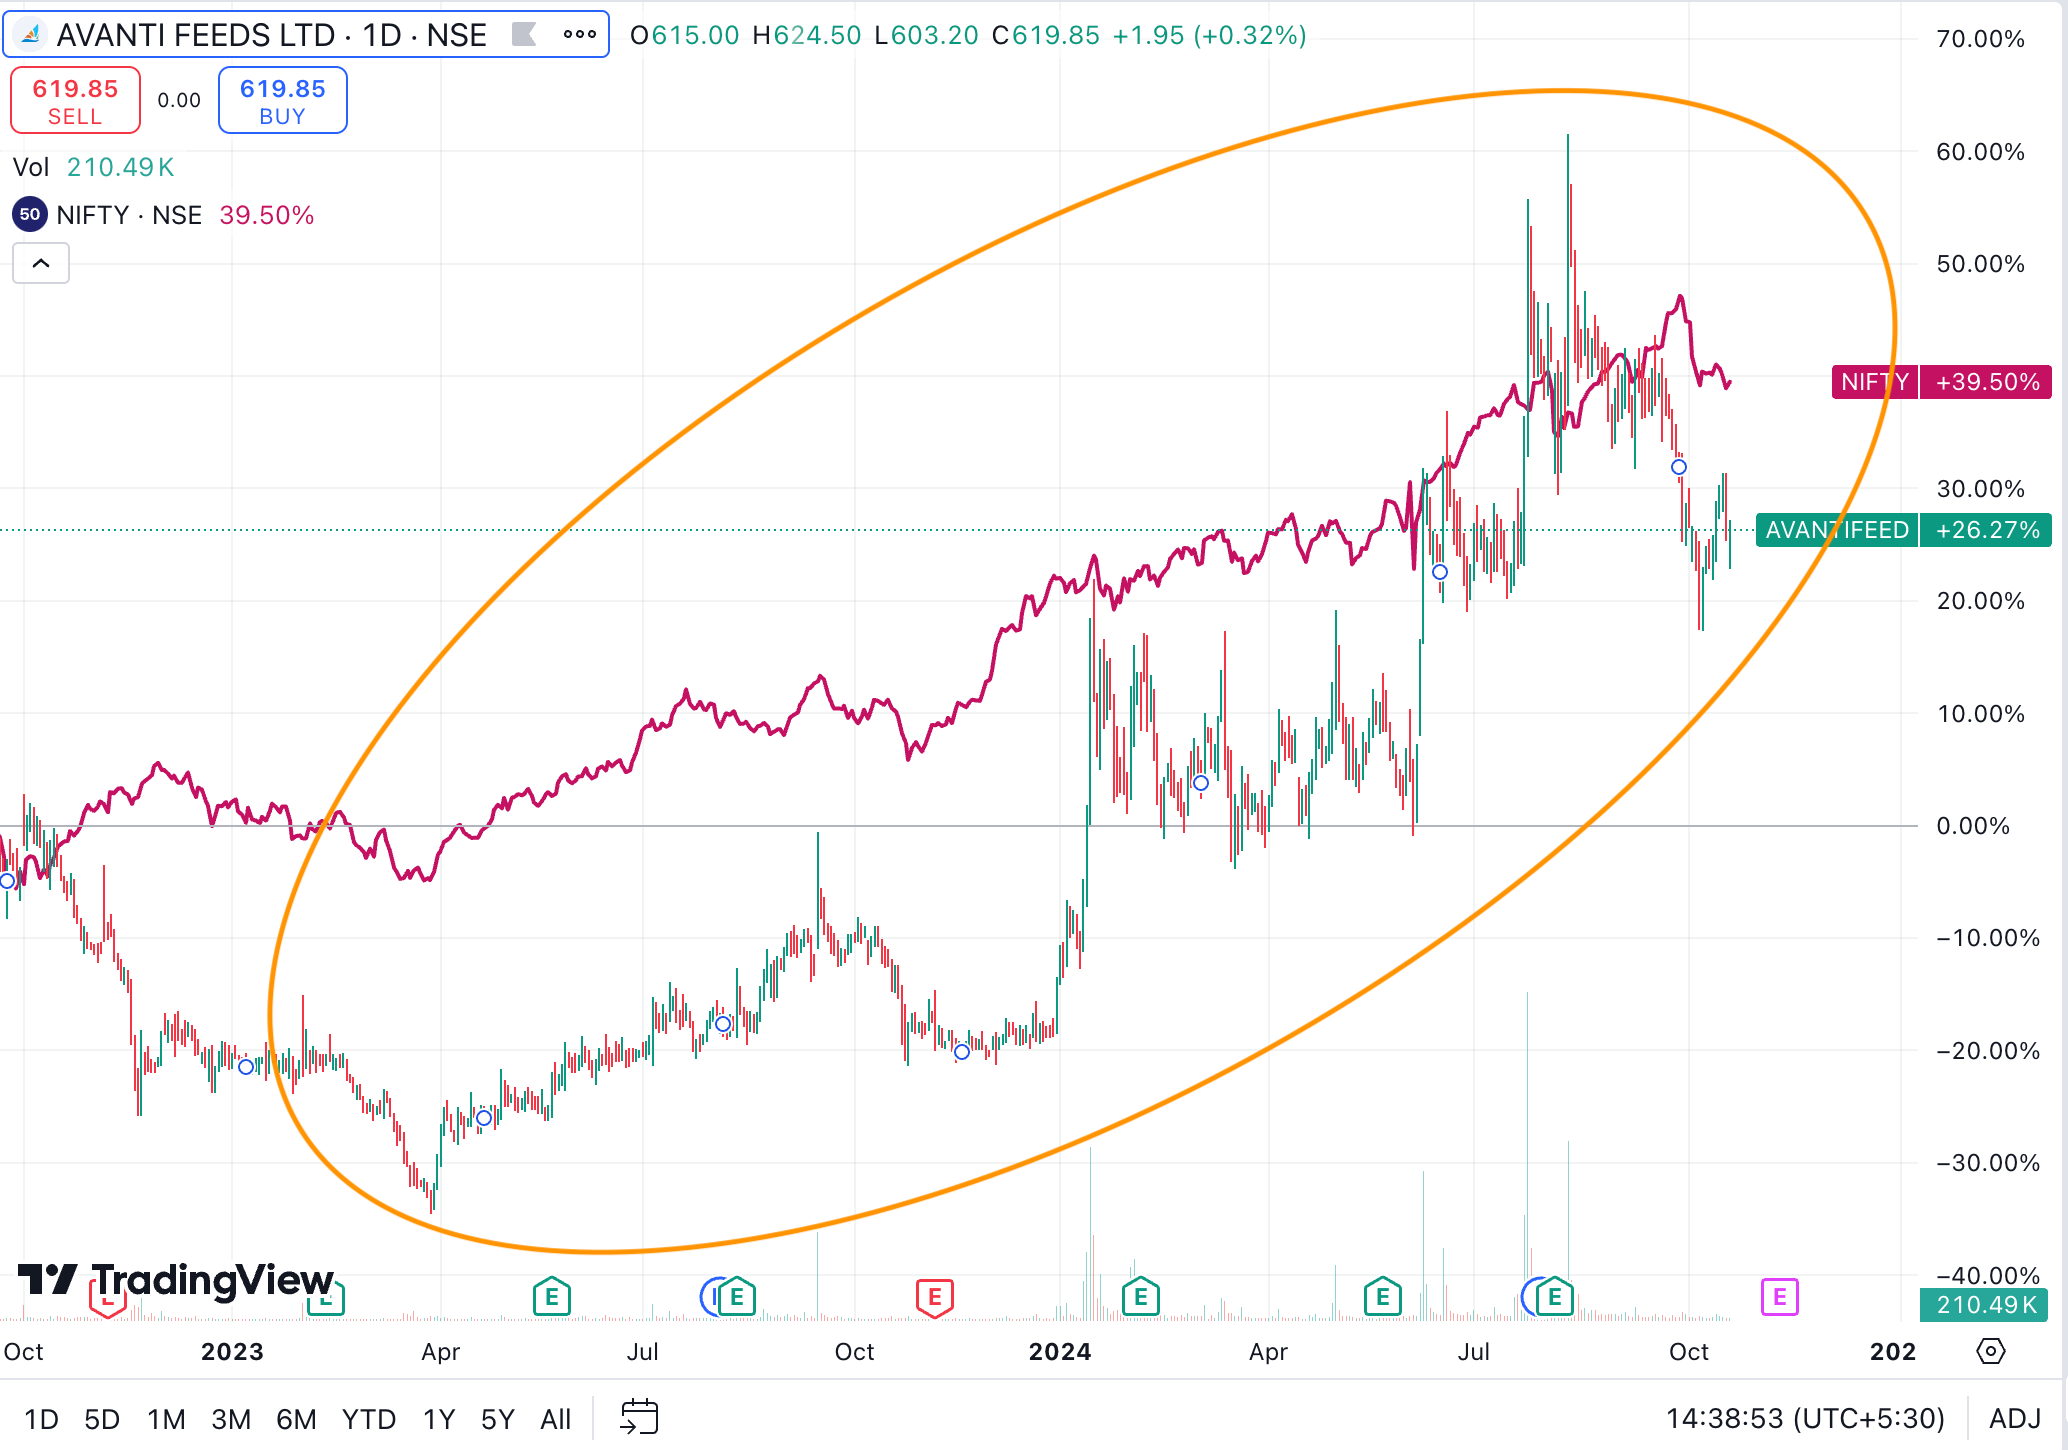
Price Action - Since Oct 22, Avanti Feeds - 26%, NIFTY 39%
Operational metrics performance - Below chart shows Gross, Operating and Net Profit Margin improving quarterly since July 2022 but revenue scaling up from July 2023
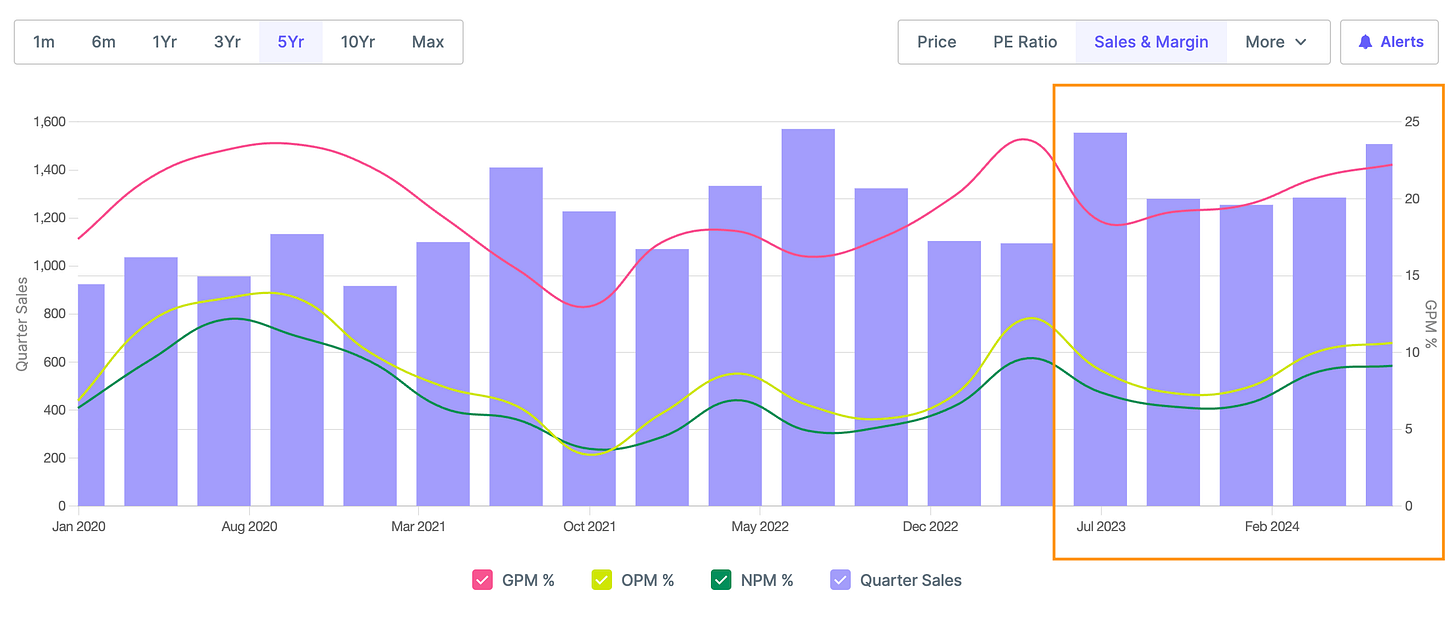
Q1 25 results (QoQ Increase) - Sales increased by 17% and Profits increased by 37%
Q1 25 results (YoY increase) - Sales decreased by 3% and Profits increased by 20%
Valuations and EPS - Below chart shows Price has grown at the same pace as TTM EPS (EPS of last 4 quarters) from April 2023 to Jan 2024 and from Jan 2024 price has grown faster than TTM EPS leading to PE being slightly overvalued from historical average of 20.
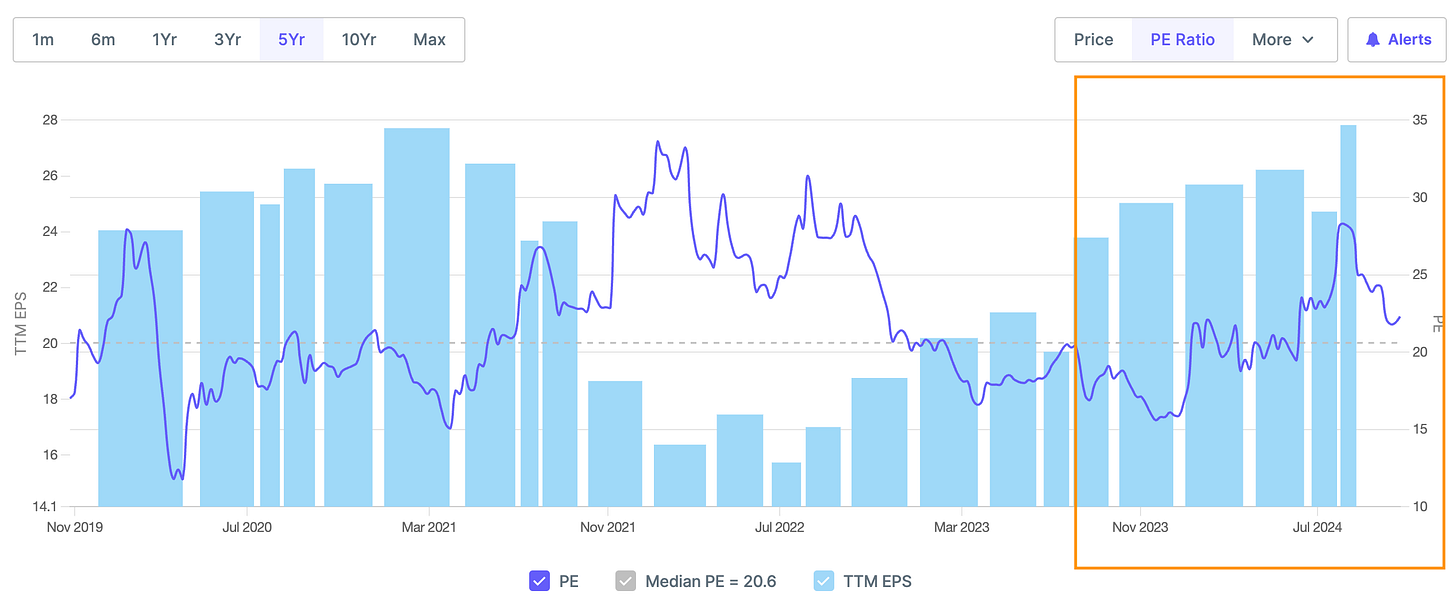
PE ratio has remained relatively stable around 15-25 since March 23.
TTM EPS (EPS of Last 4 quarters) - Growing consistently QoQ since Mar 2023
What led to outperformance
Revenue Growth
Consolidated gross income grew by 16.7% quarter-on-quarter to INR 1,541 crores in Q1 FY25, driven by increased feed sales volumes.
Profit Growth
Consolidated profit before tax (PBT) increased by 19.2% quarter-on-quarter and 14.64% year-on-year to INR 180 crores in Q1 FY25.
Feed Division Performance
Feed division PBT grew by 29.67% quarter-on-quarter to INR 153 crores, primarily due to higher sales volumes and better overhead absorption.
Processing Division Outlook
Company expects shrimp exports to increase to around 16,000 metric tons in FY25 compared to 13,443 metric tons in FY24.
Capacity Utilization
Feed sales volumes increased to 158,591 MT in Q1 FY25 compared to 122,278 MT in Q4 FY24, indicating improved capacity utilization.
New Business Initiatives
Company is diversifying into pet food and pet care products, with trading operations planned to start before March 2025.
Government Incentives
Company is availing production-linked incentives and grants from government schemes, which can support profitability.
Market Leadership
Company maintains strong market position in key categories like shrimp feed, providing pricing power and scale benefits.
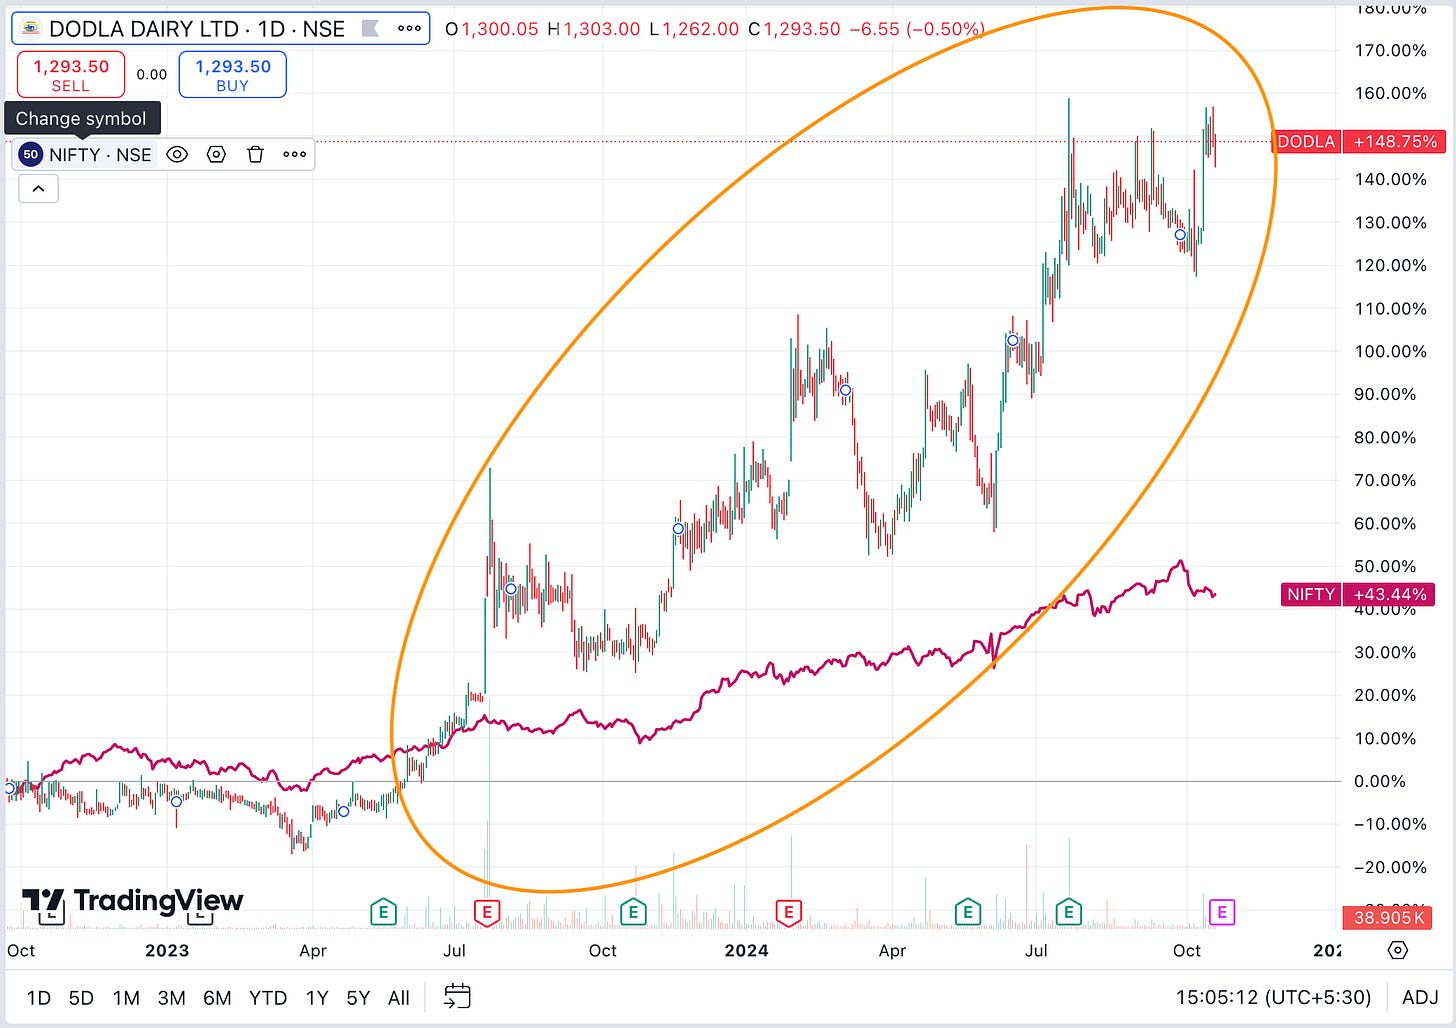
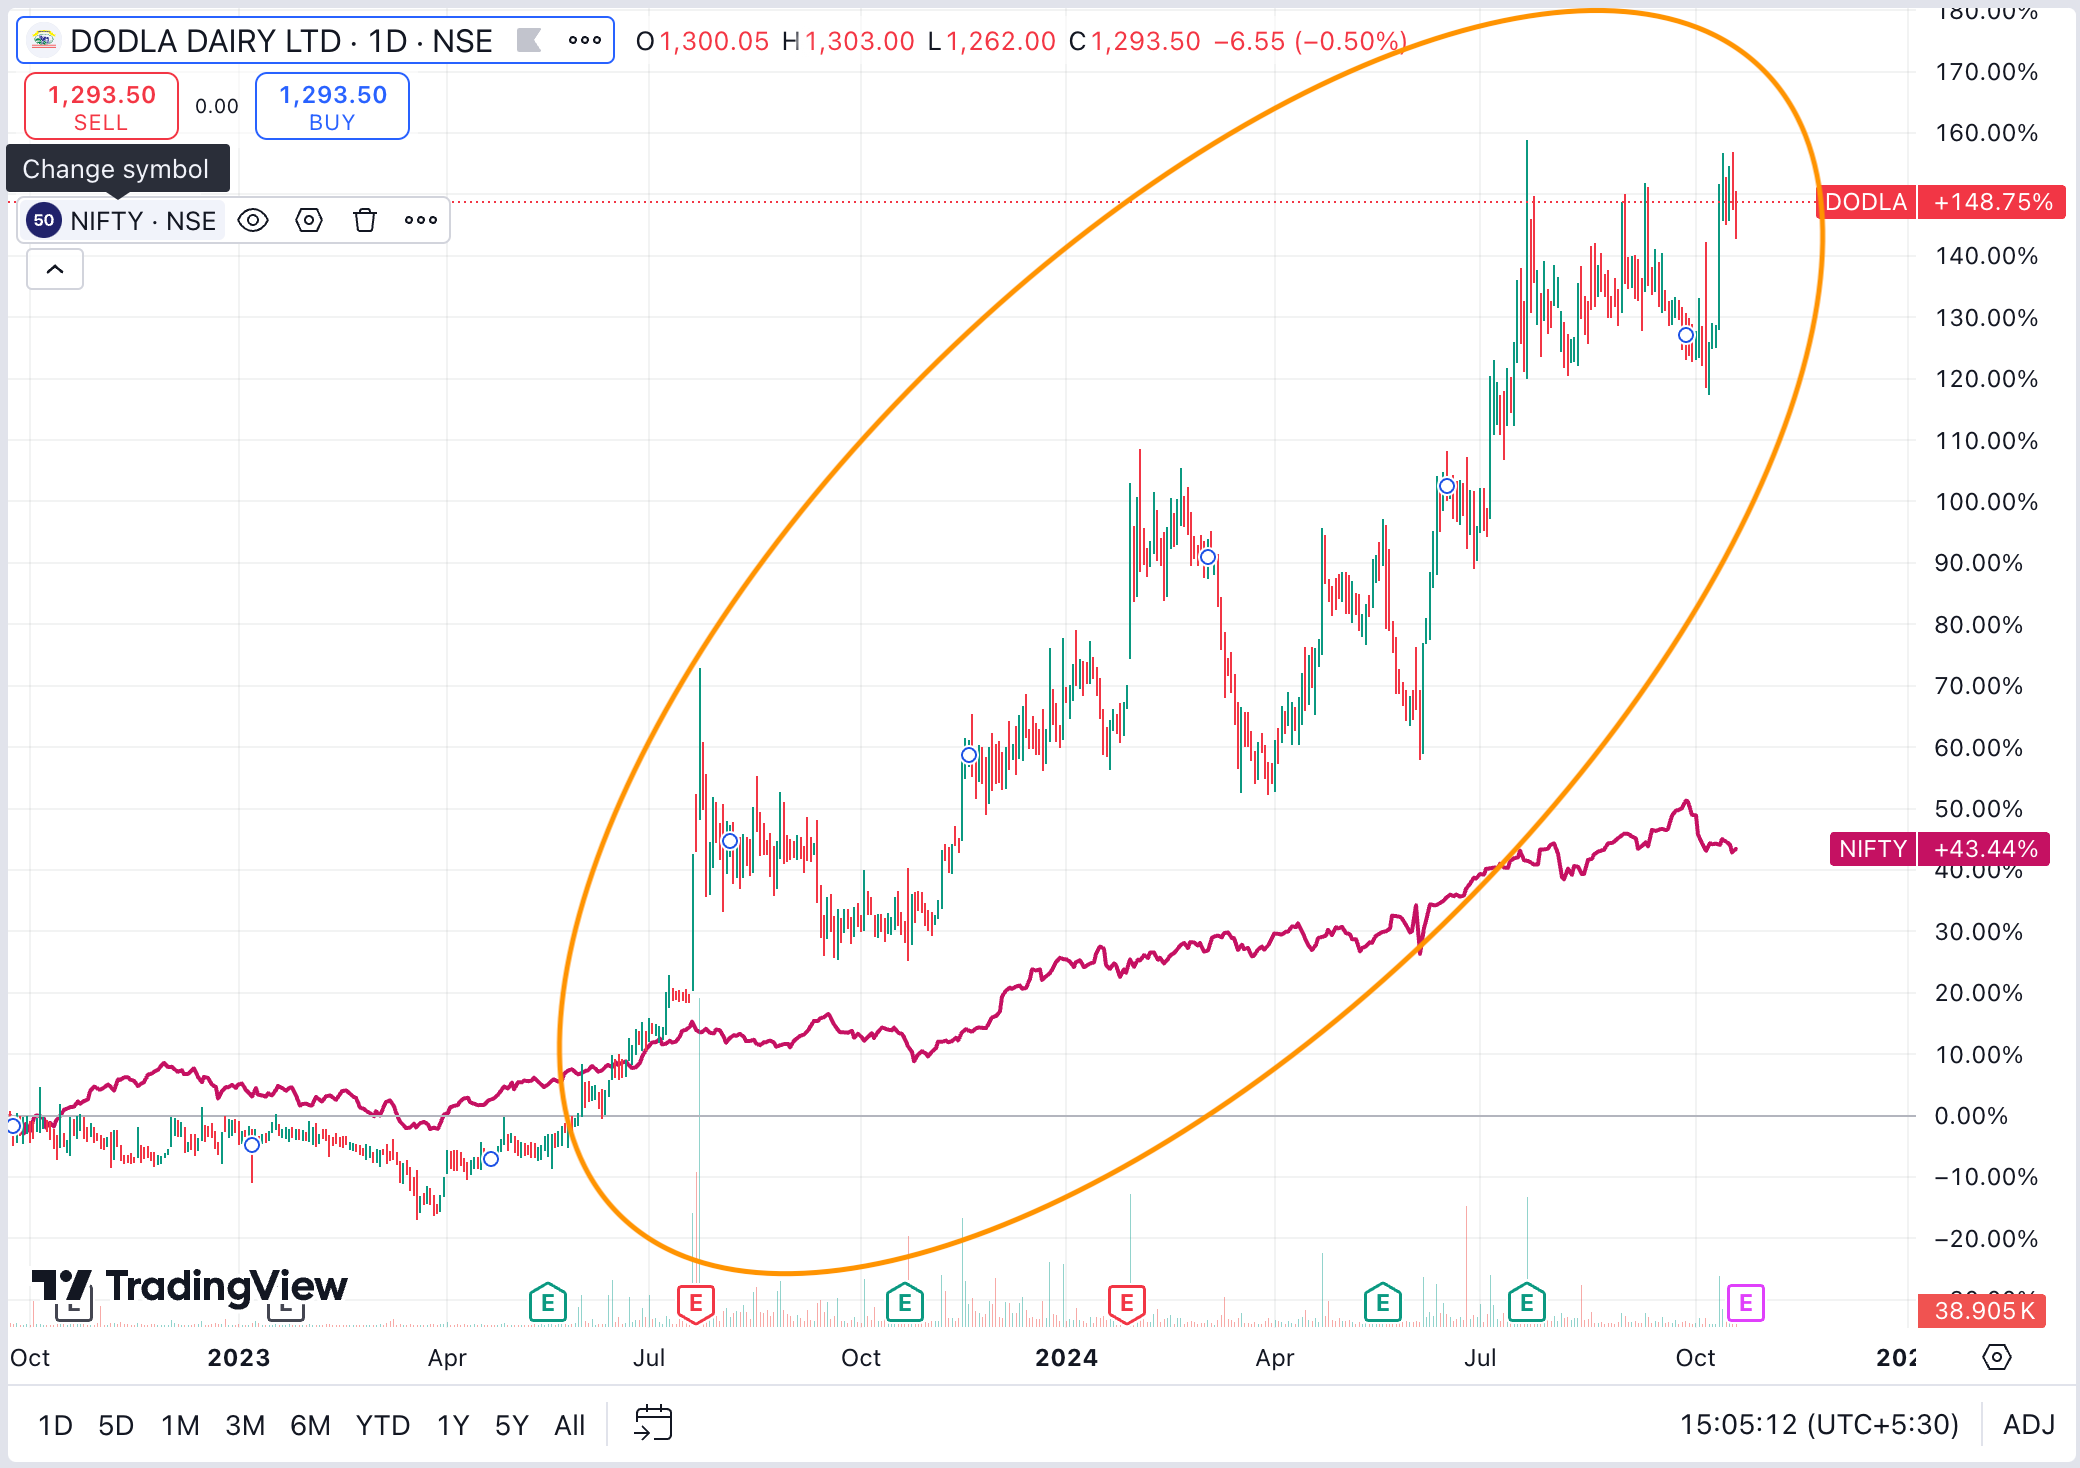
Dodla Dairy Ltd - Market Cap 7,803+ Cr
Price Action - Since Oct 22, Dodla Dairy - 149%, NIFTY 43%
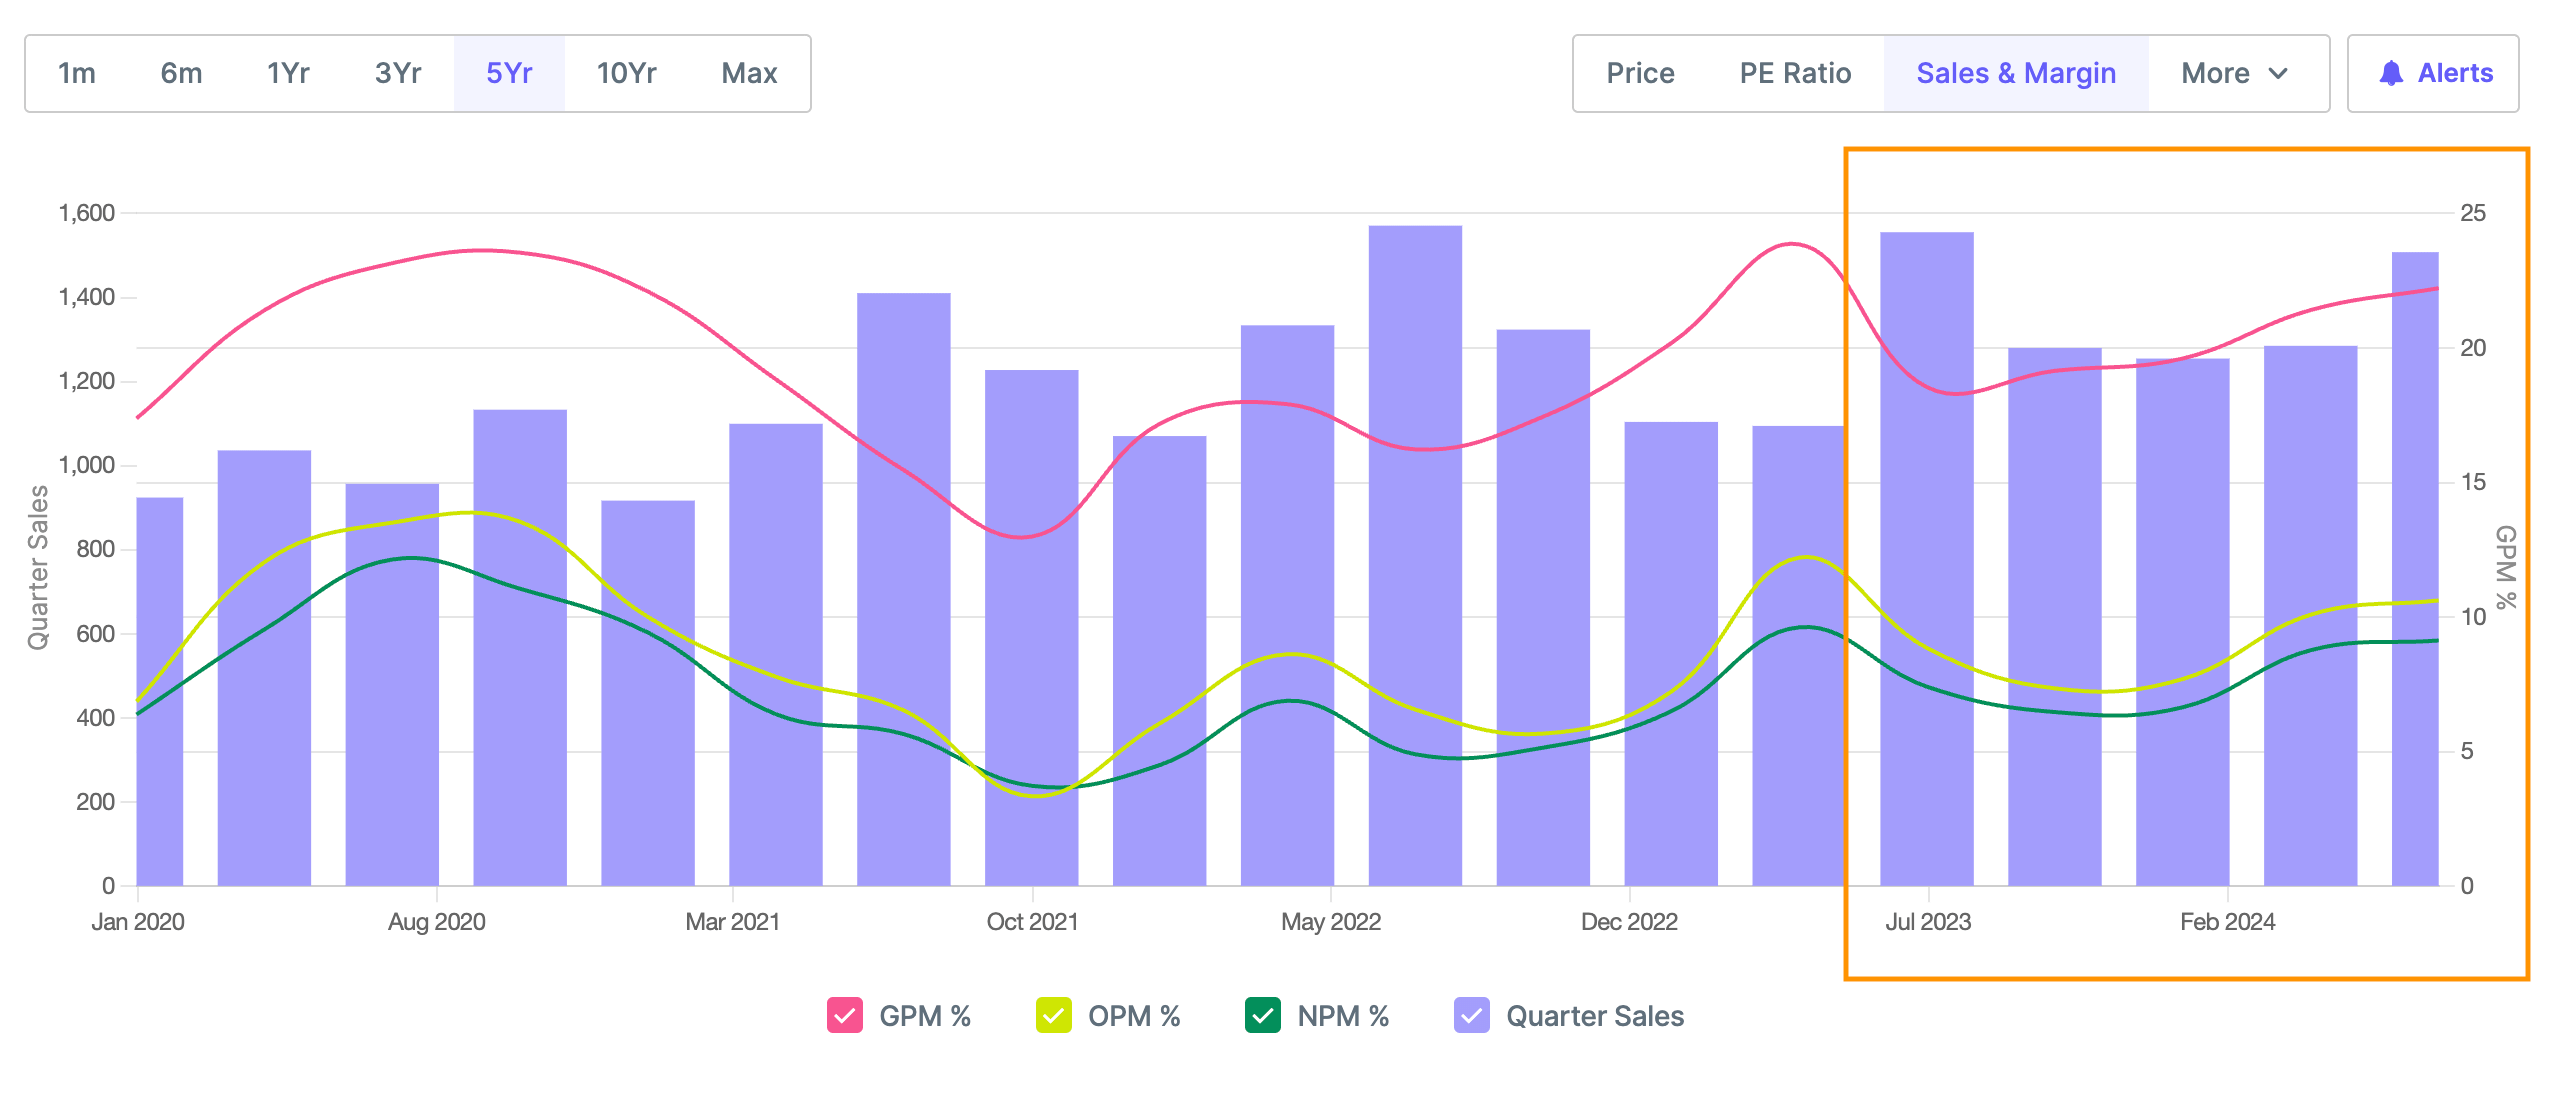
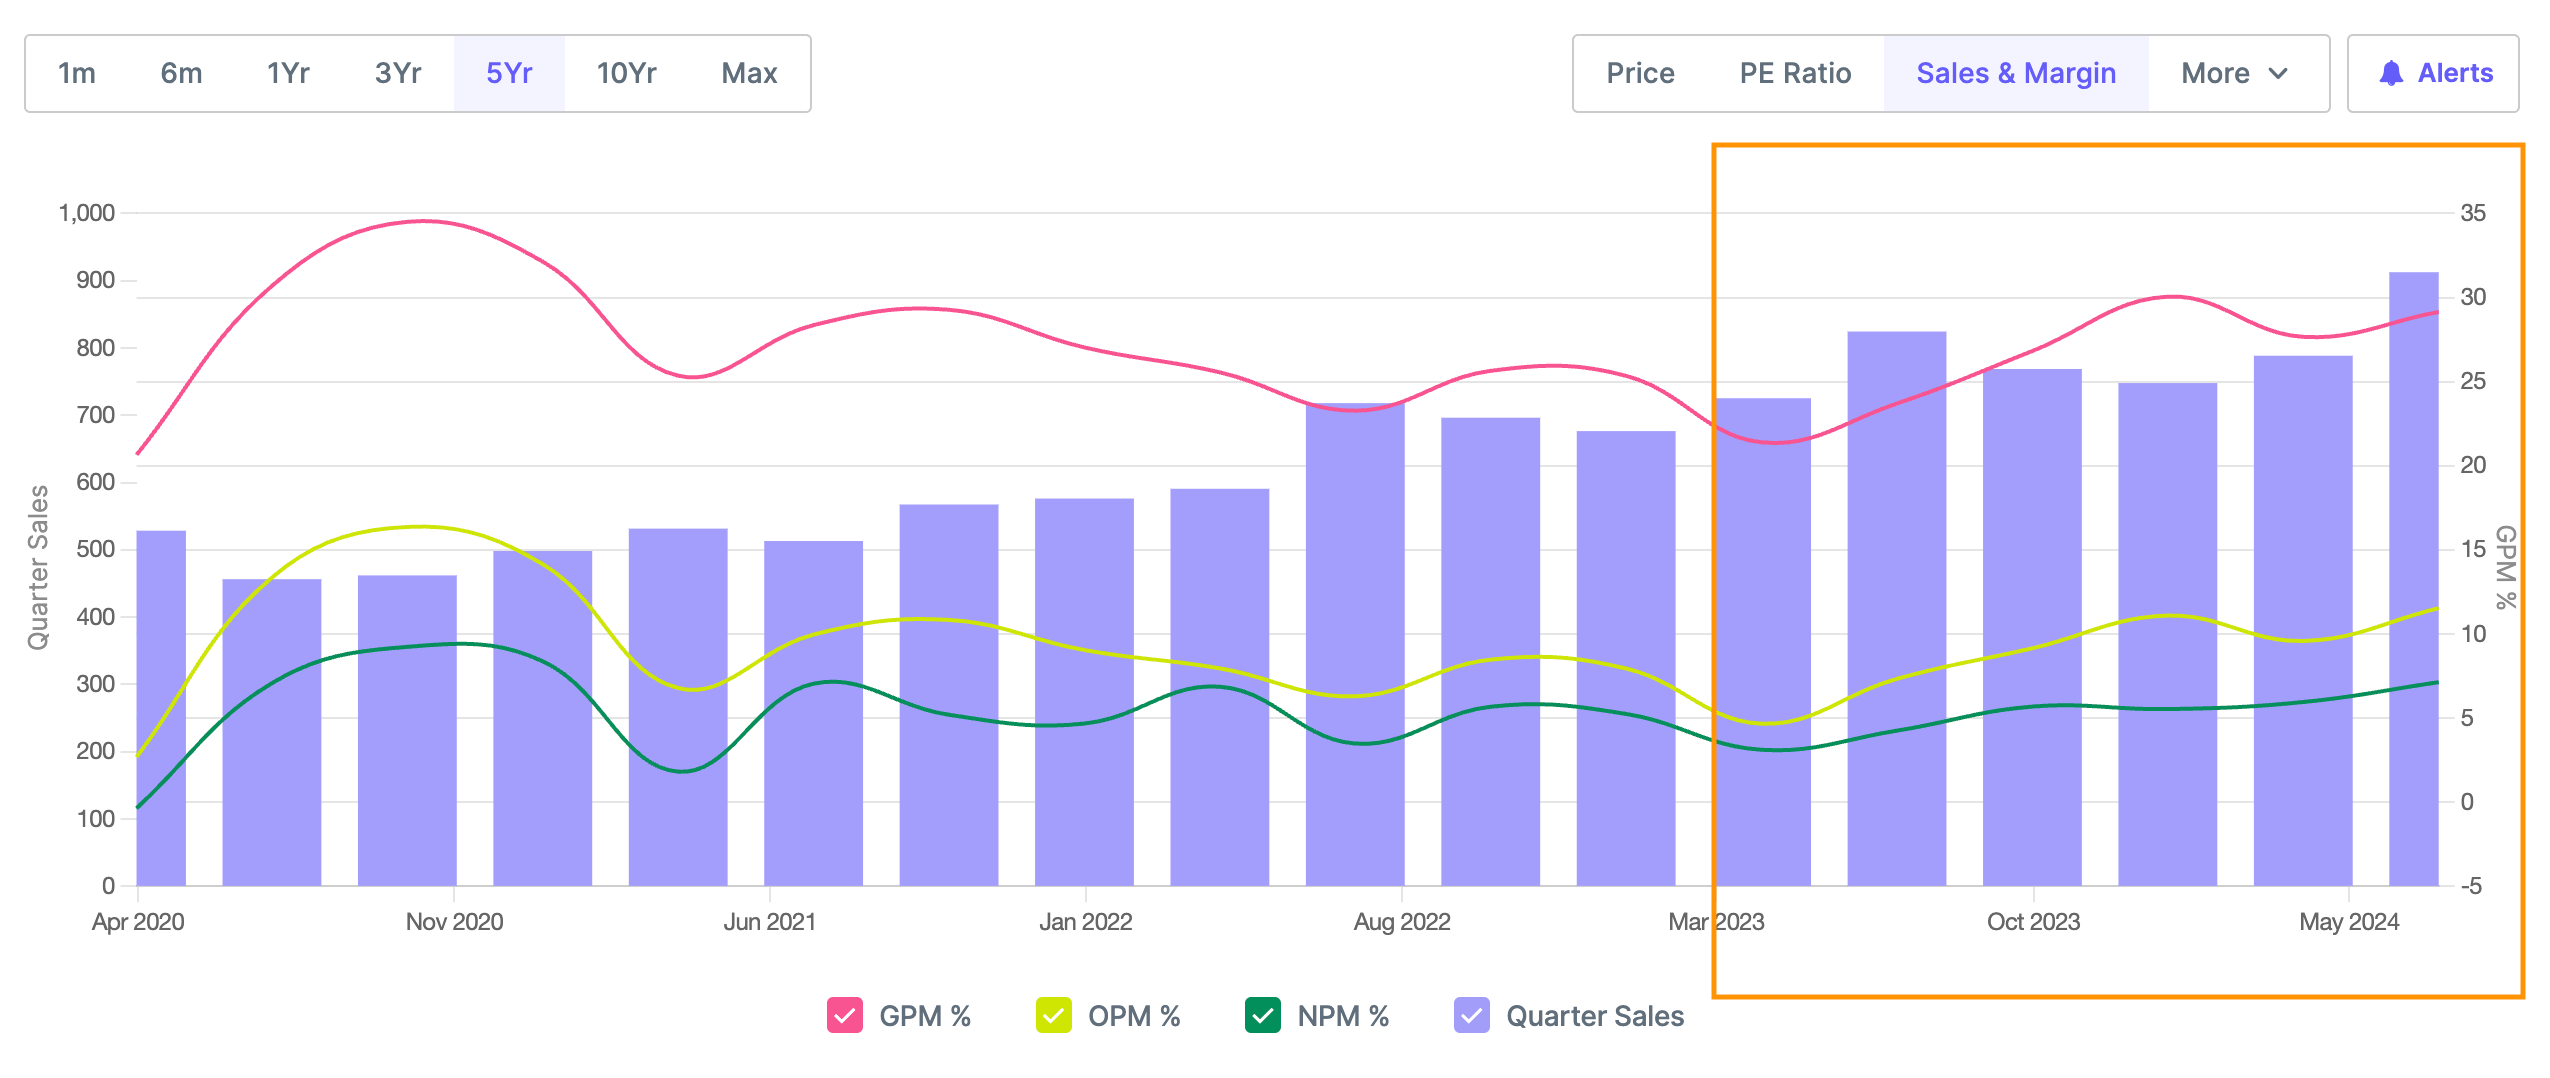
Operational metrics performance - Below chart shows Gross, Operating and Net Profit Margin improving quarterly since Mar 2023 and revenue scaling up from Mar 2023
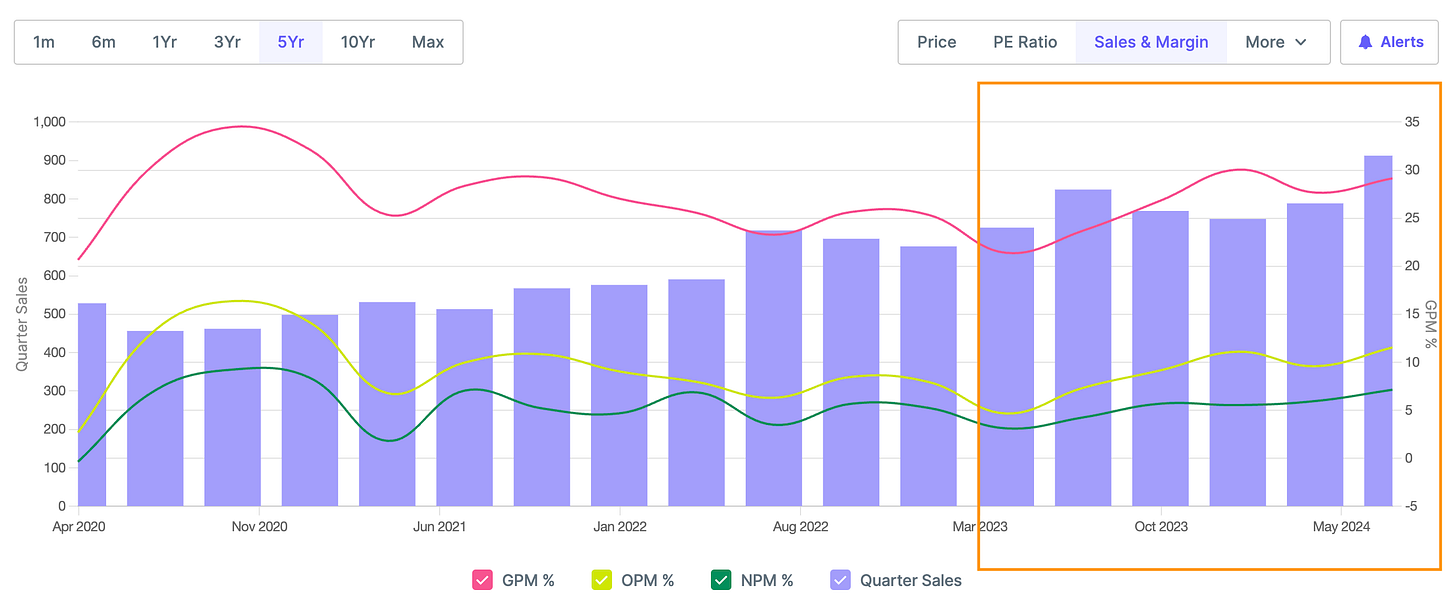
Q1 25 results (QoQ Increase) - Sales increased by 16% and Profits increased by 68%
Q1 25 results (YoY increase) - Sales increased by 11% and Profits increased by 57%
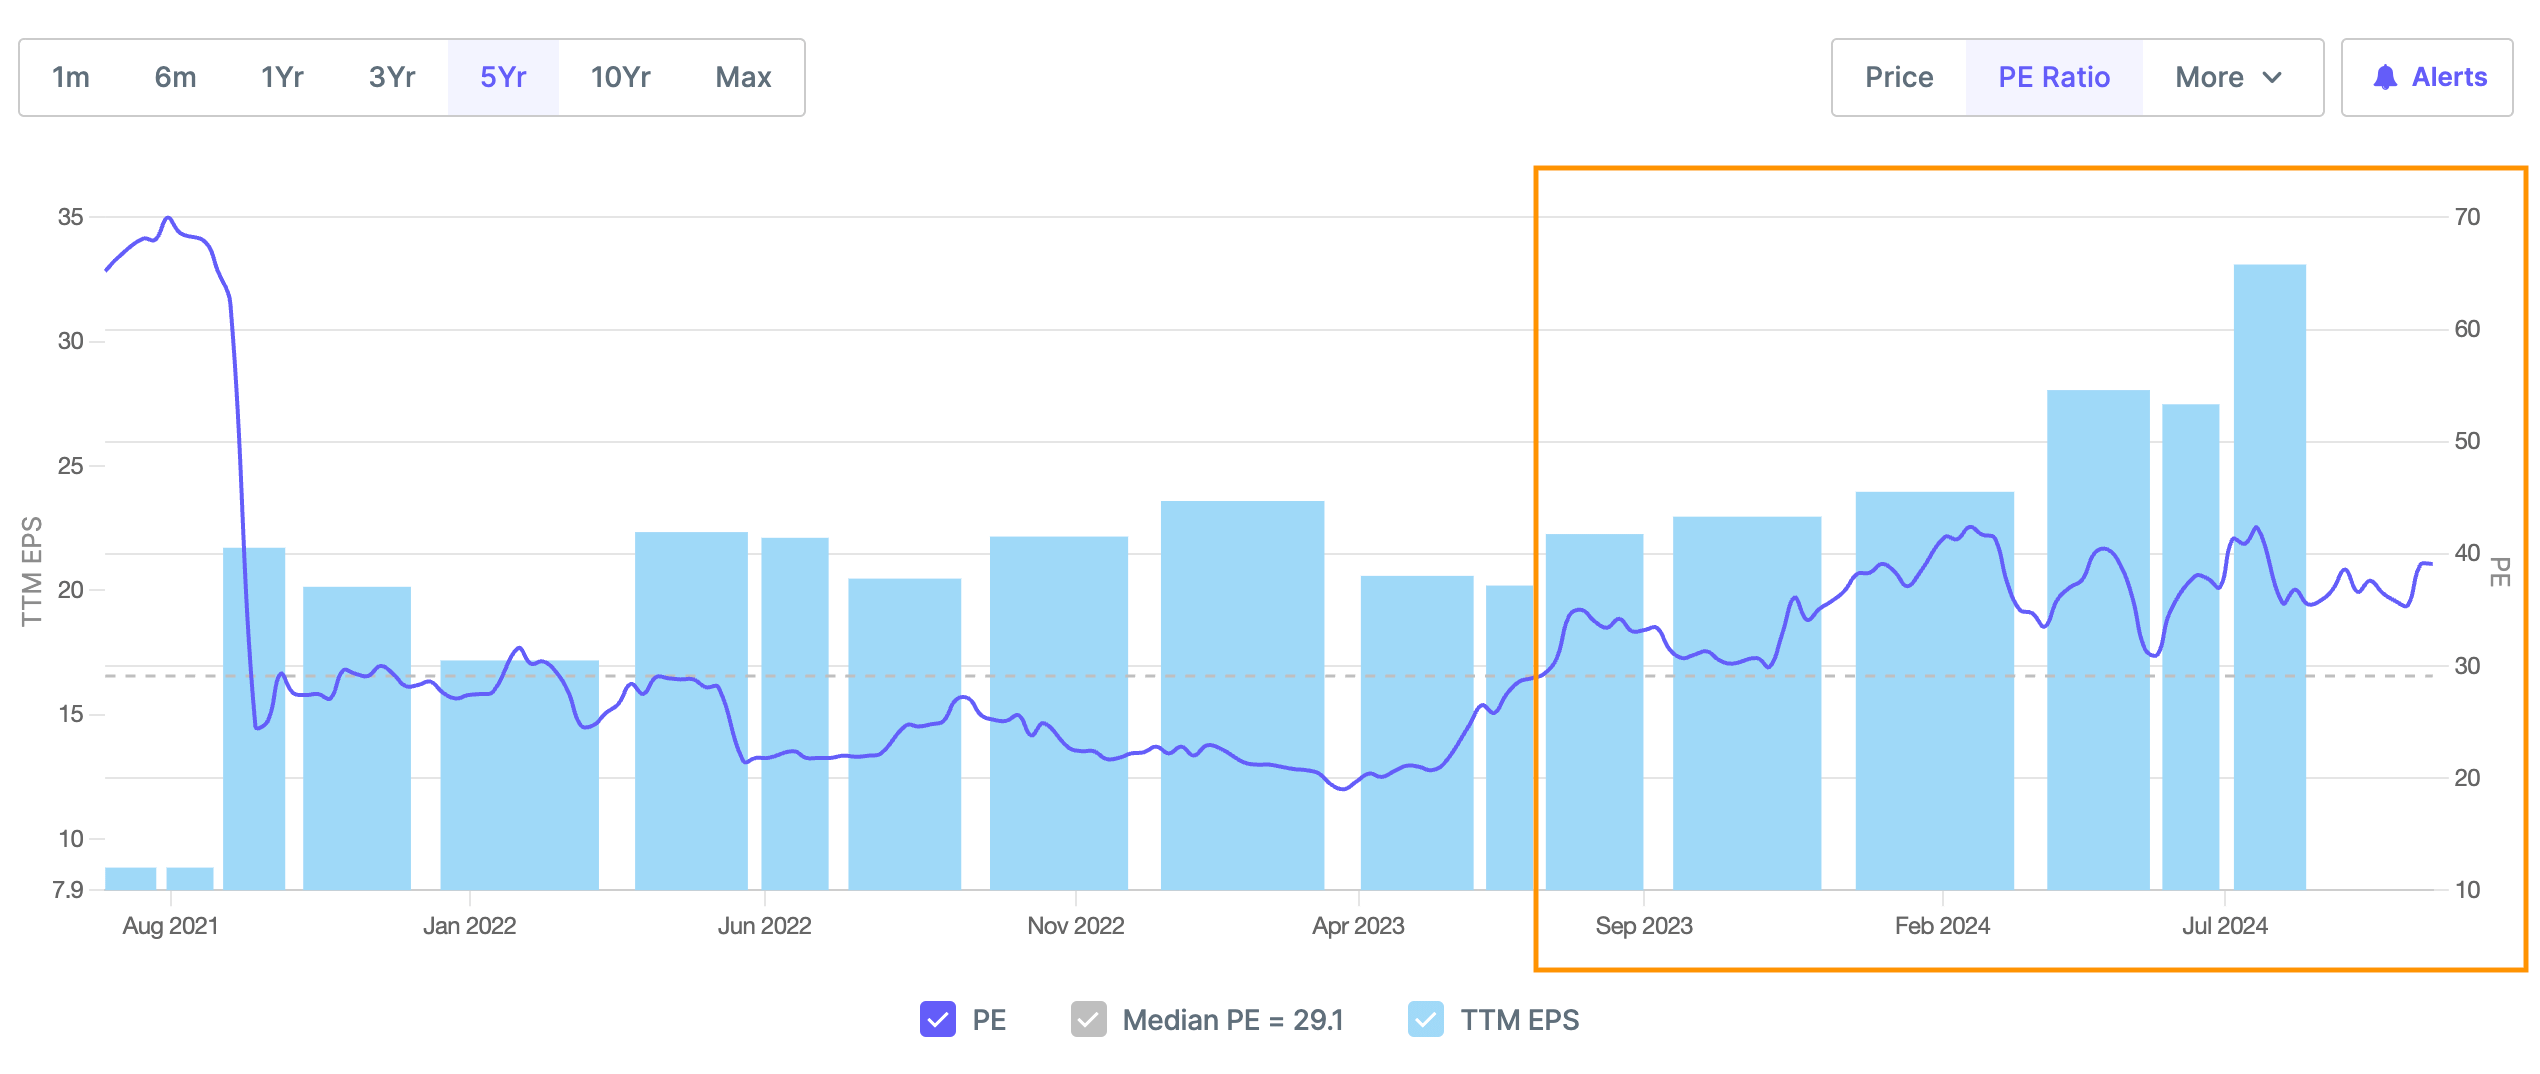
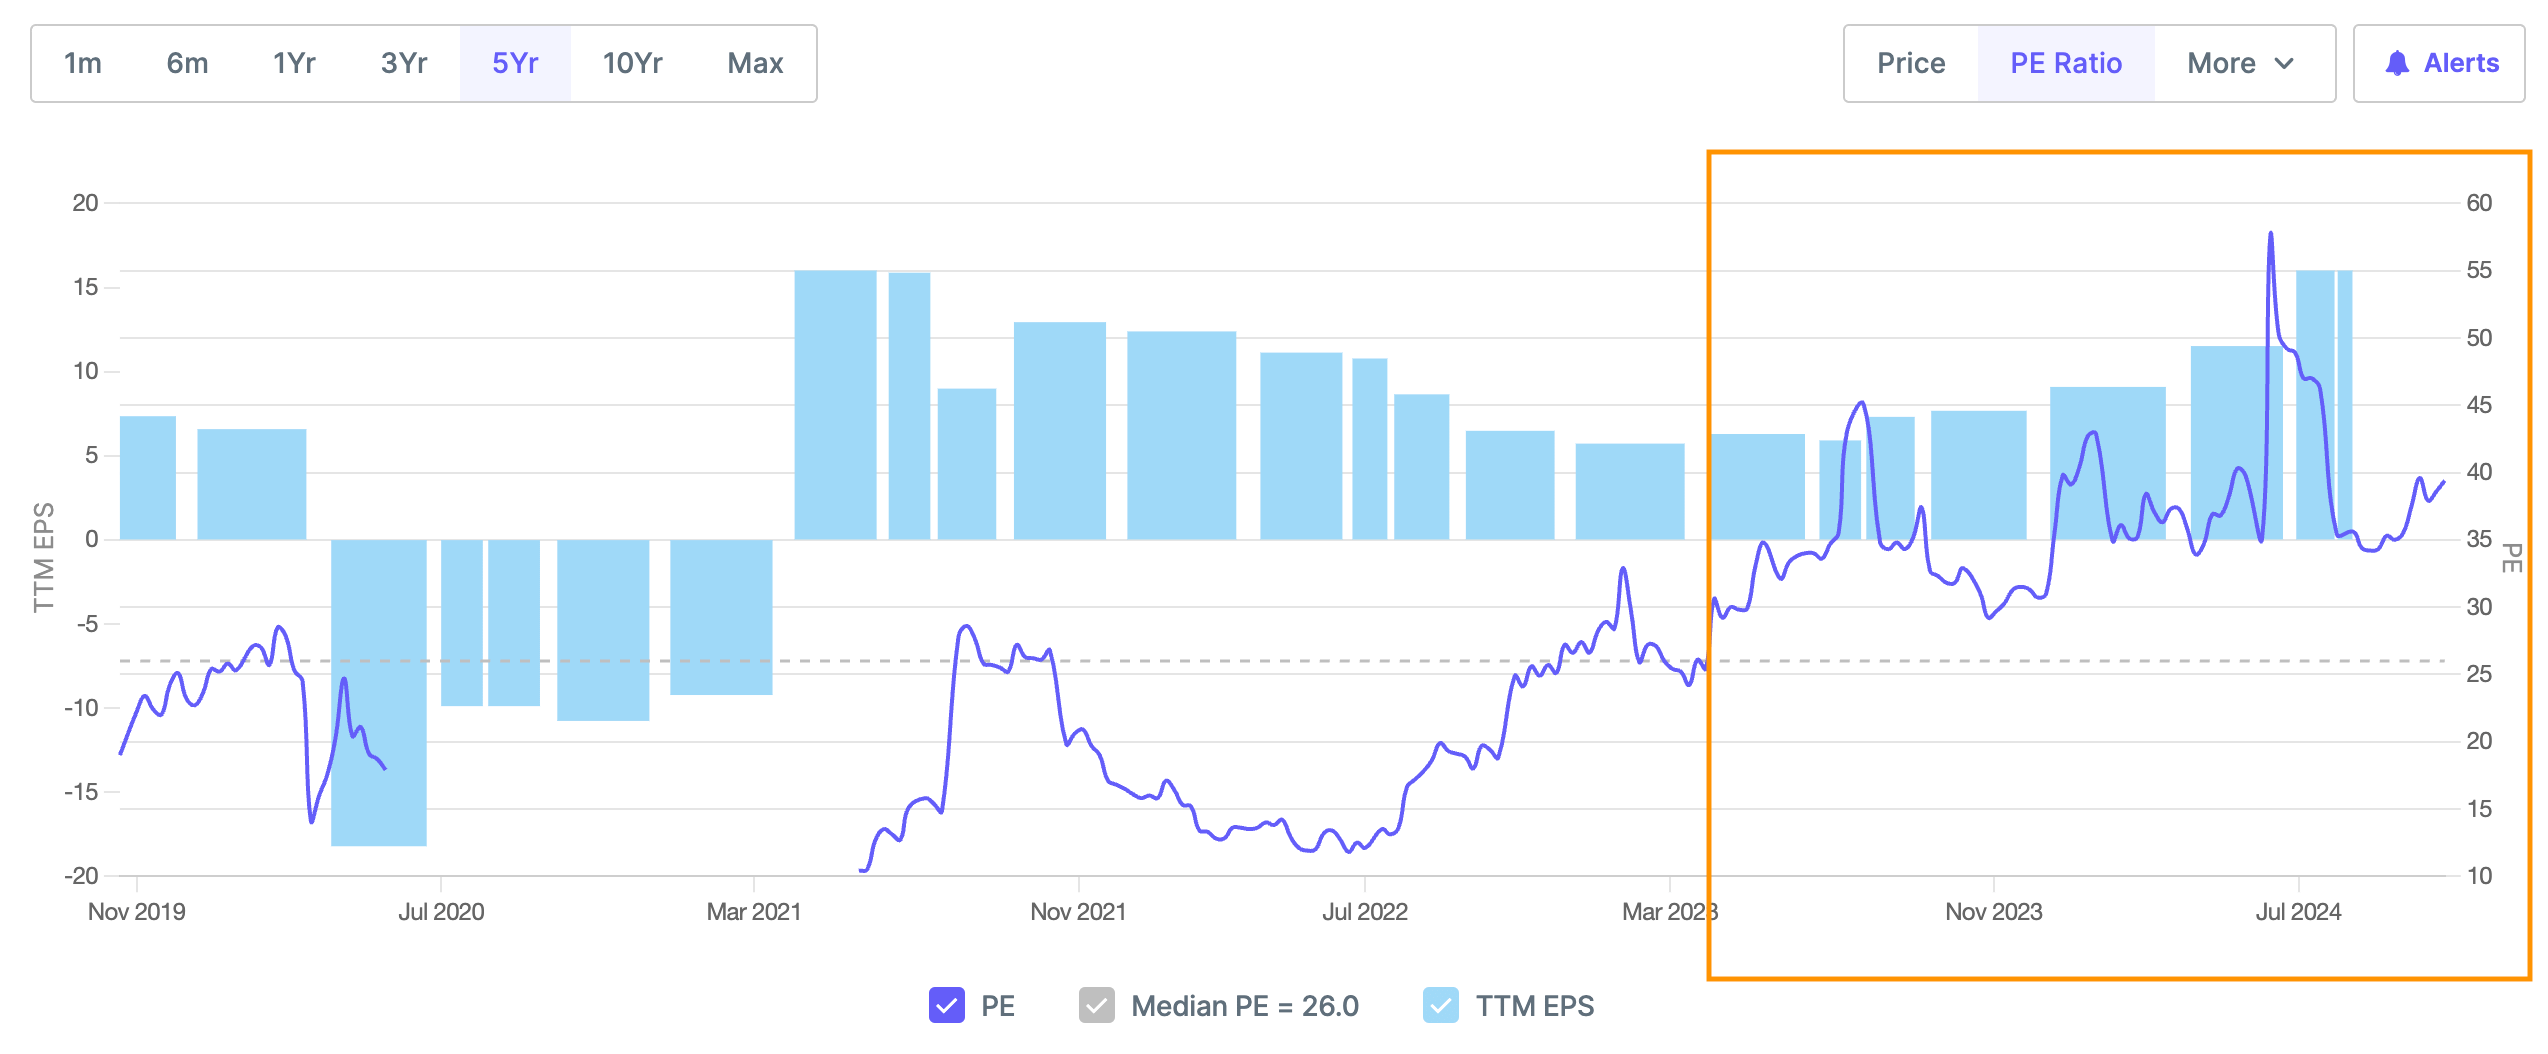
Valuations and EPS - Below chart shows price has grown at the same pace as TTM EPS from April 2023 to October 2024 leading to PE stabilising between 30 and 40 i.e. slightly overvalued from historical average of 30
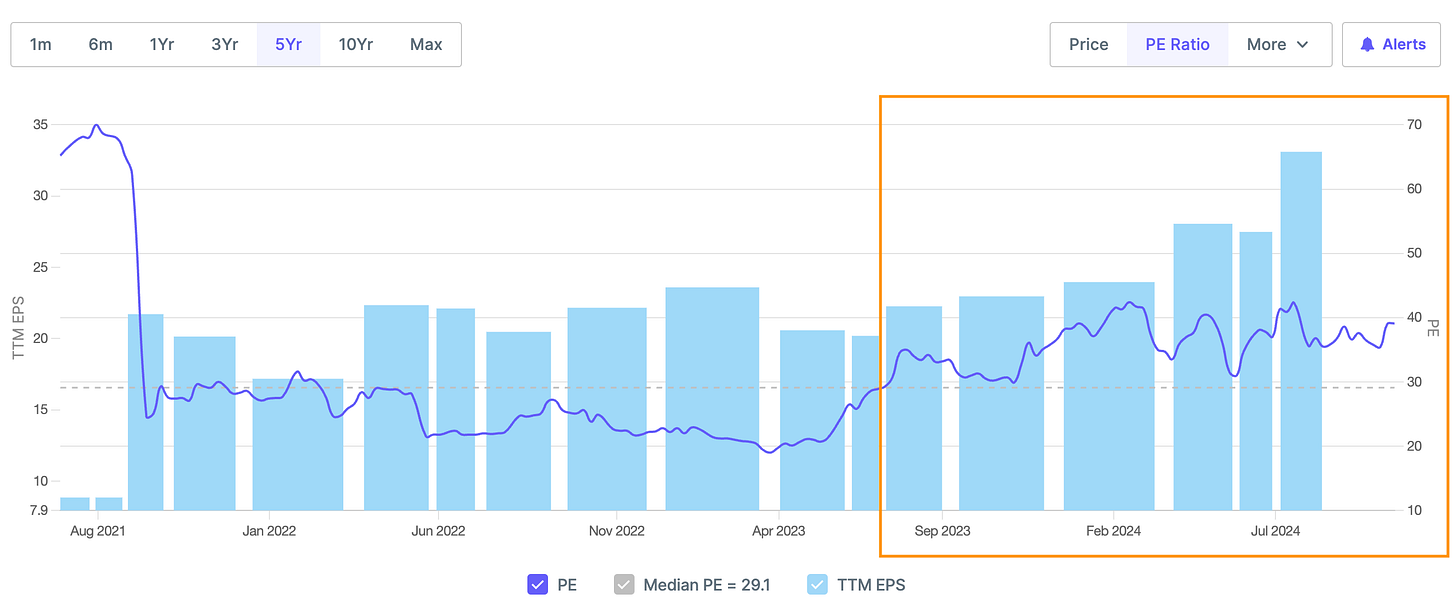
PE at 40 i.e. above historical average
TTM EPS (EPS of Last 4 quarters) - Growing consistently QoQ since July 2023
What led to outperformance
Revenue Growth
Revenue from operations grew by 10.8% year-on-year to INR 912 crores in Q1 FY25, driven by growth across all key segments including India, Africa and Orgafeed.
Margin Expansion
i. Gross margin improved by 543 basis points year-on-year to 29.1% in Q1 FY25, driven by lower procurement costs and favorable revenue mix.
EBITDA Growth
EBITDA increased by 75% year-on-year to INR 105 crores, with EBITDA margin expanding by 420 basis points to 11.5%.
Value-Added Products
Value-added products accounted for 35.4% of total revenues in Q1 FY25, up from 32.1% in Q1 FY24, indicating improving product mix.
Procurement Efficiency
Average daily milk procurement increased by 10.9% year-on-year to 17.6 lakh liters in Q1 FY25, improving operating leverage
Capacity Utilization
Newly added capacities in Kenya and Orgafeed are expected to reach 60-65% utilization by FY26, providing room for growth.
International Business
Africa business revenue expected to grow from INR 218 crores in FY24 to INR 360 crores in FY25, almost doubling.
Operational Efficiency
Company focusing on improving operational efficiency through automation and digital initiatives.
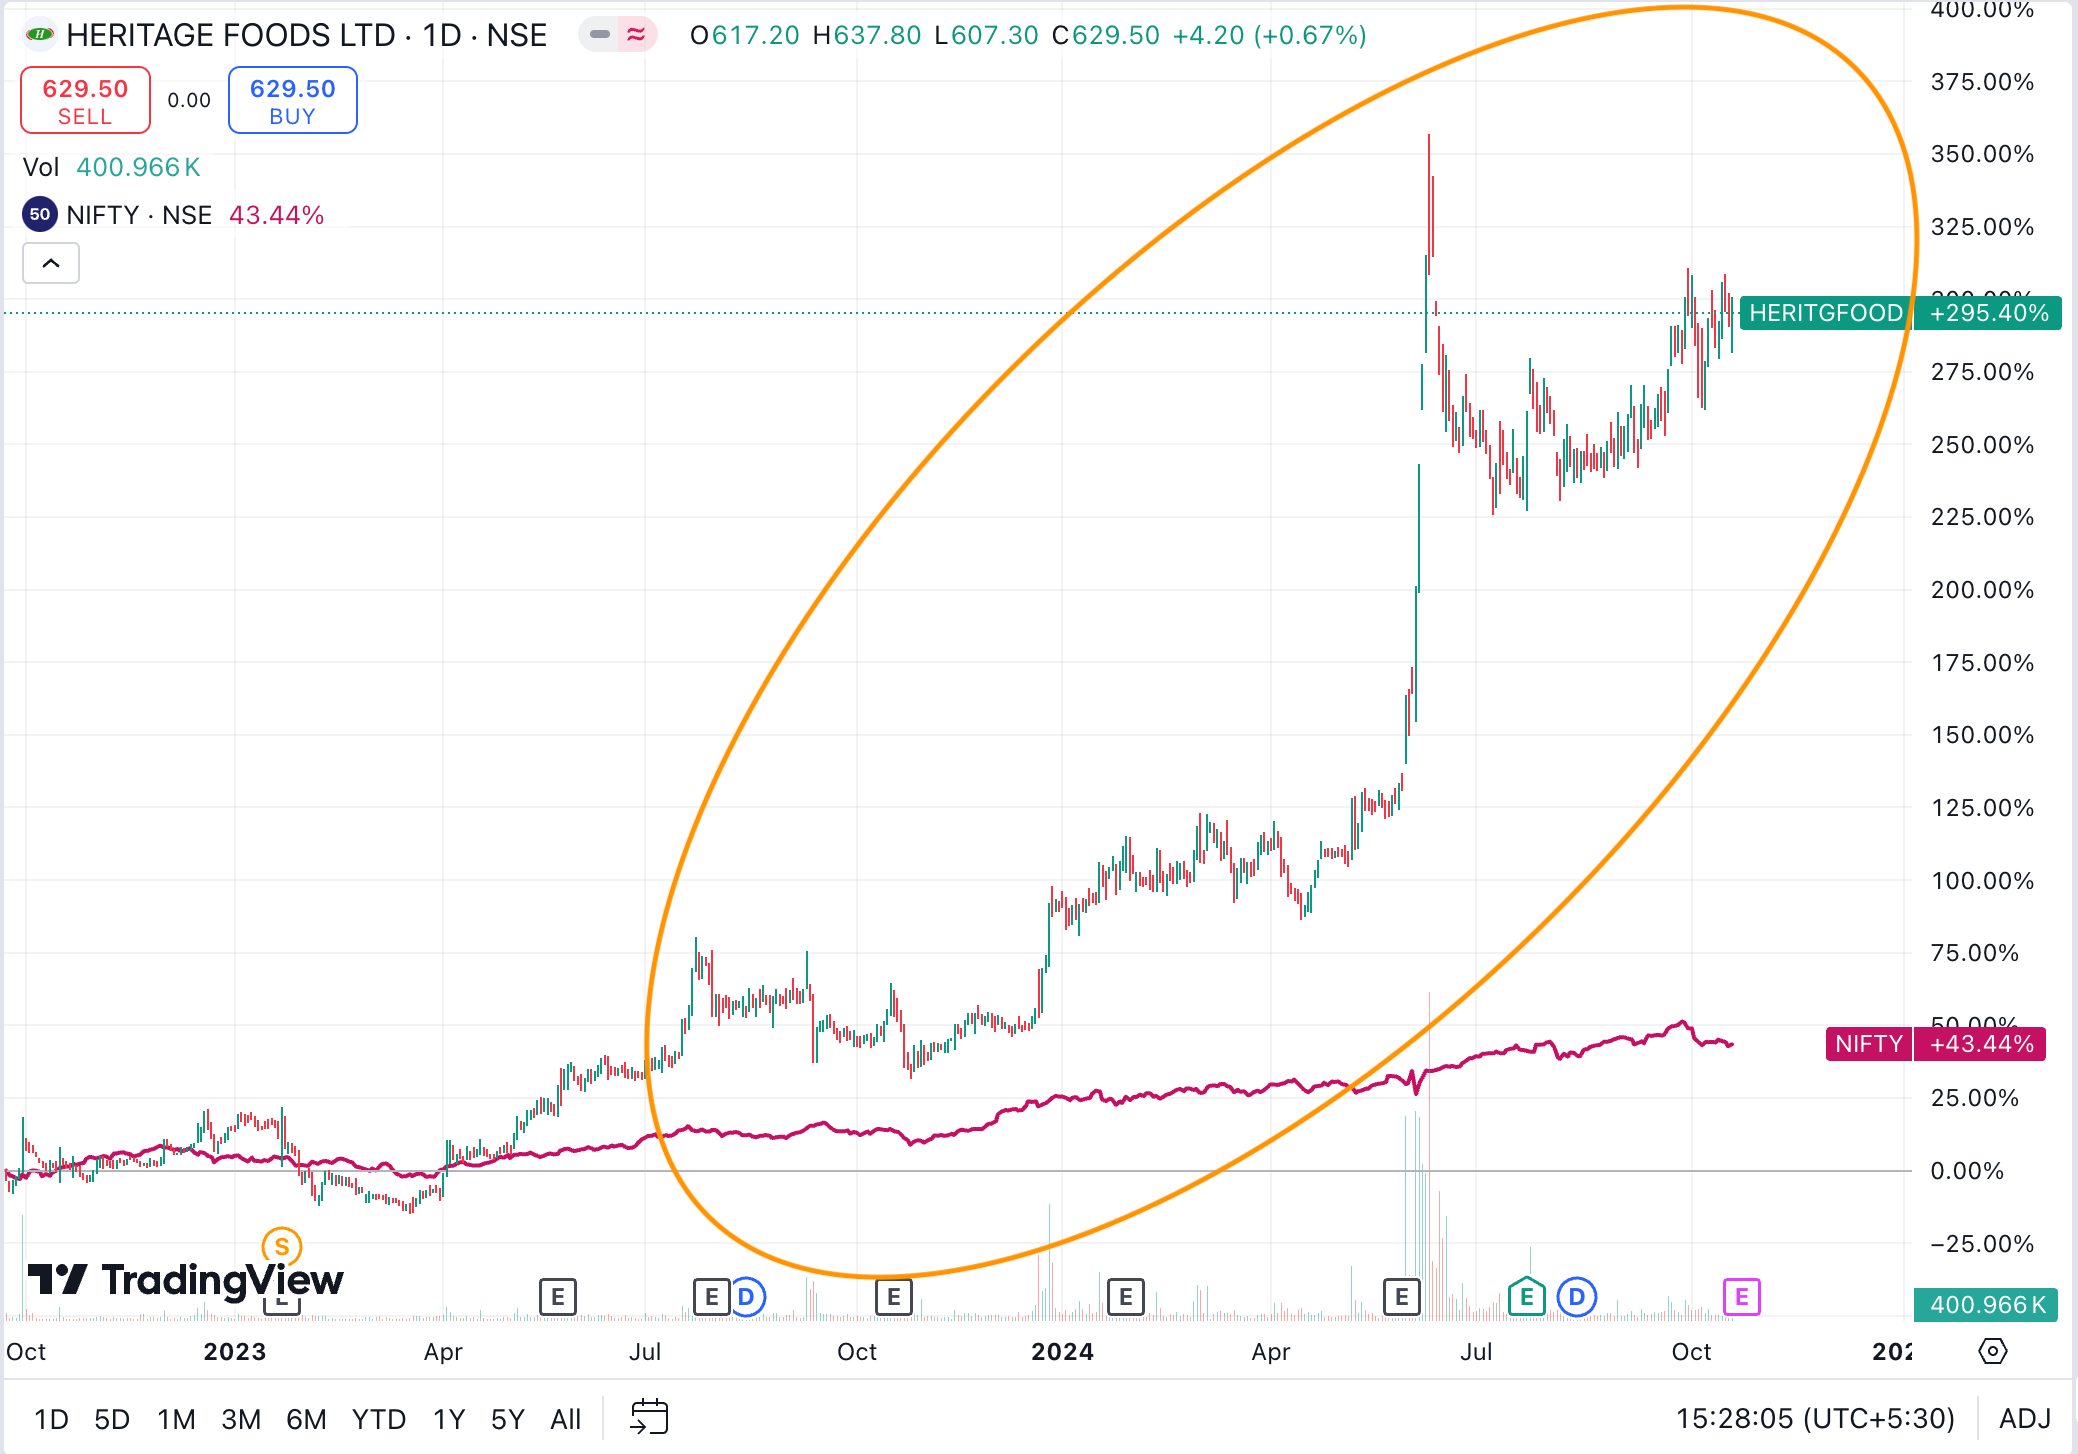
Heritage Foods Ltd - Market Cap 5,842+ Cr
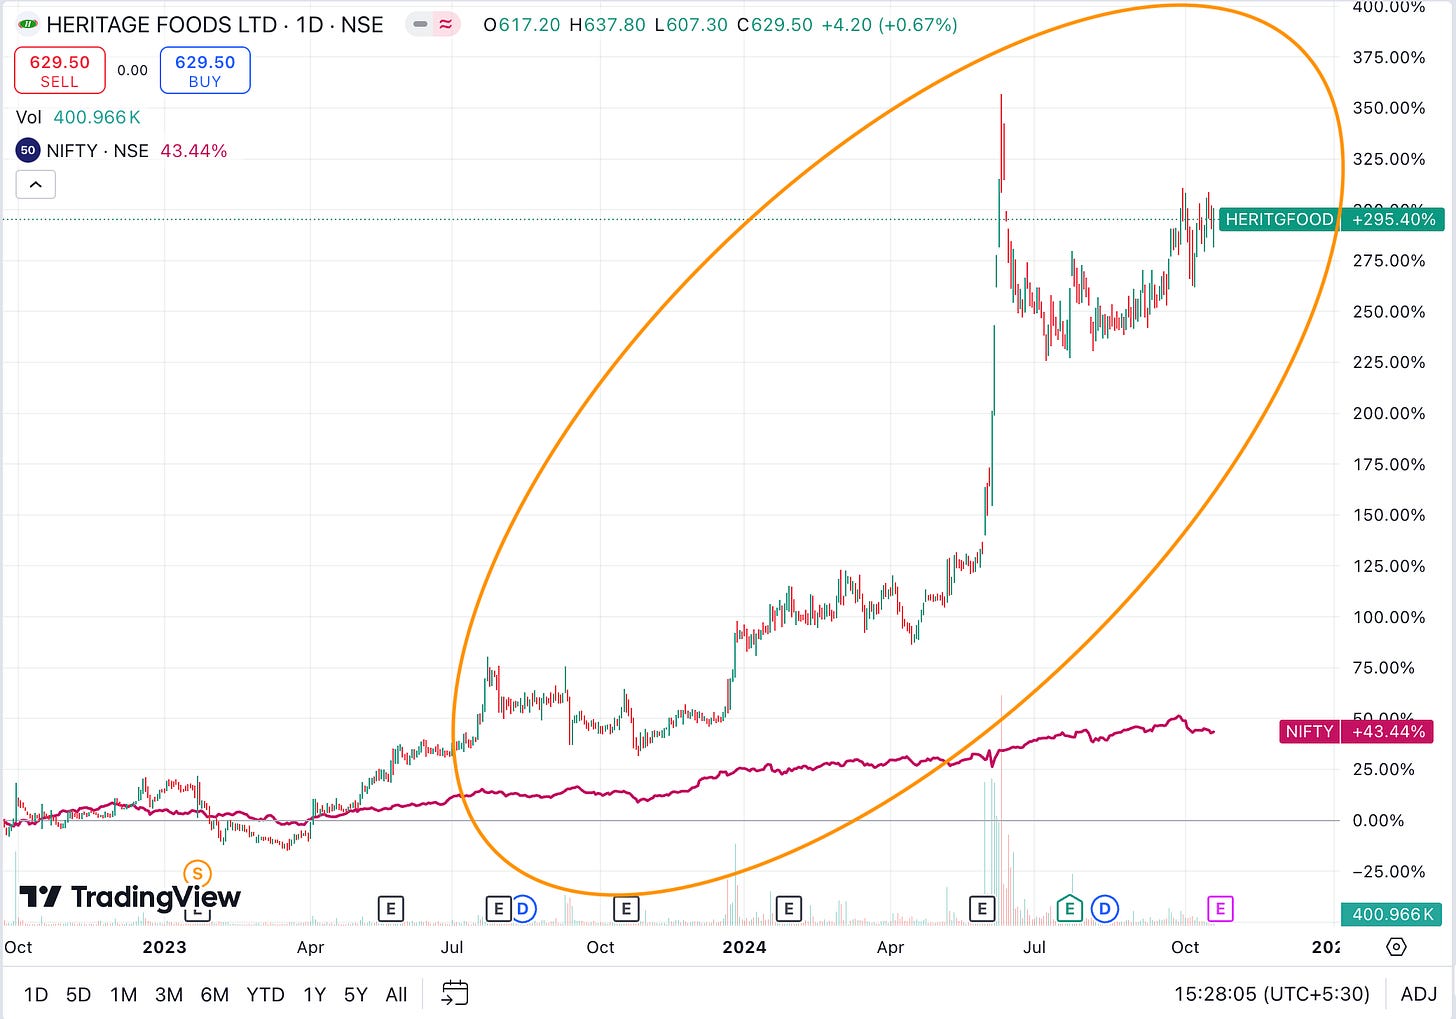
Price Action - Since Oct 22, Heritage Foods - 295%, NIFTY 43%
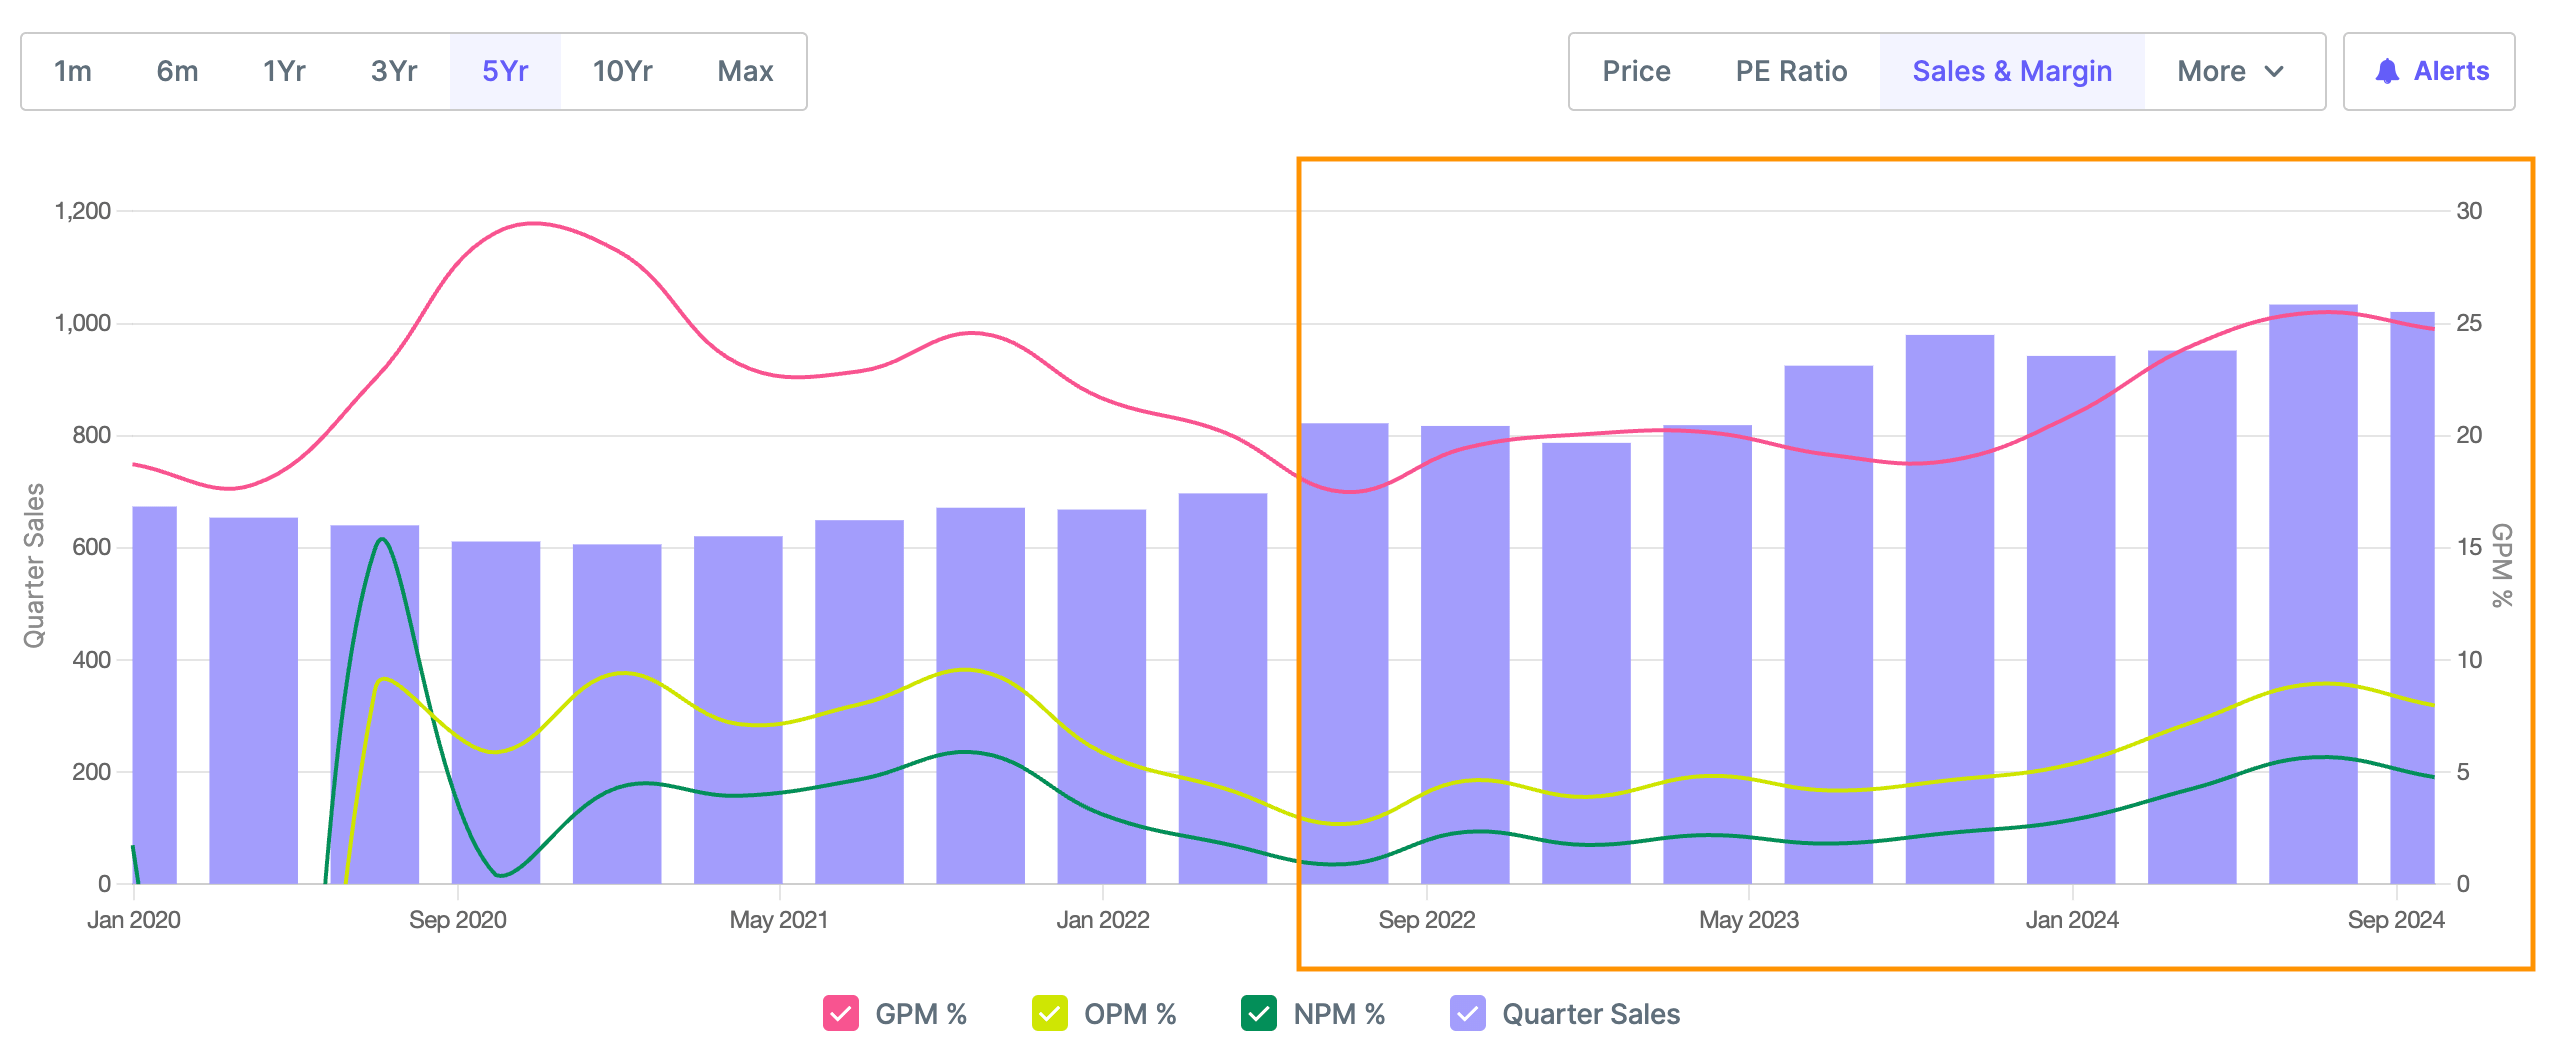
Operational metrics performance - Below chart shows Gross, Operating and Net Profit Margin improving quarterly since July 2022 and revenue also scaling up quarterly from July 2022.
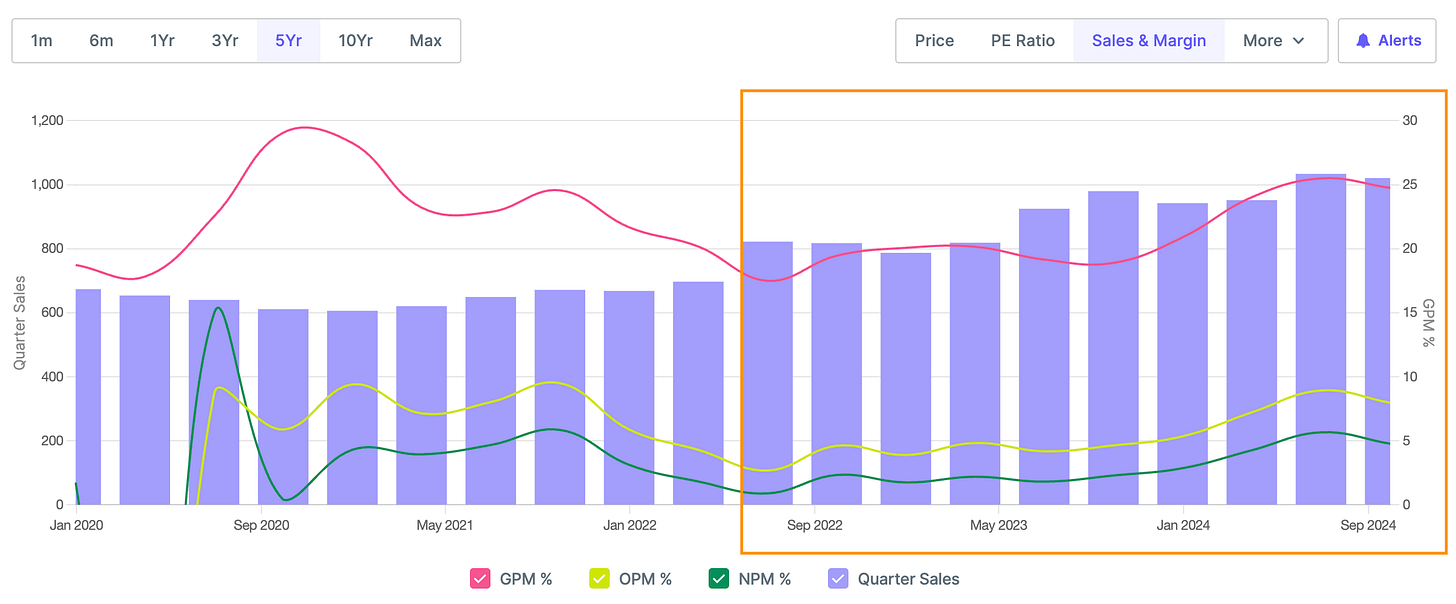
Q1 25 results (QoQ Increase) - Sales increased by 9% and Profits increased by 220%
Q1 25 results (YoY increase) - Sales increased by 12% and Profits increased by 214%
Valuations and EPS - Below chart shows Price has grown faster than TTM EPS (EPS of last 4 quarters) from March 2023 leading to PE at 40, i.e. being slightly overvalued from its historical average of 25.
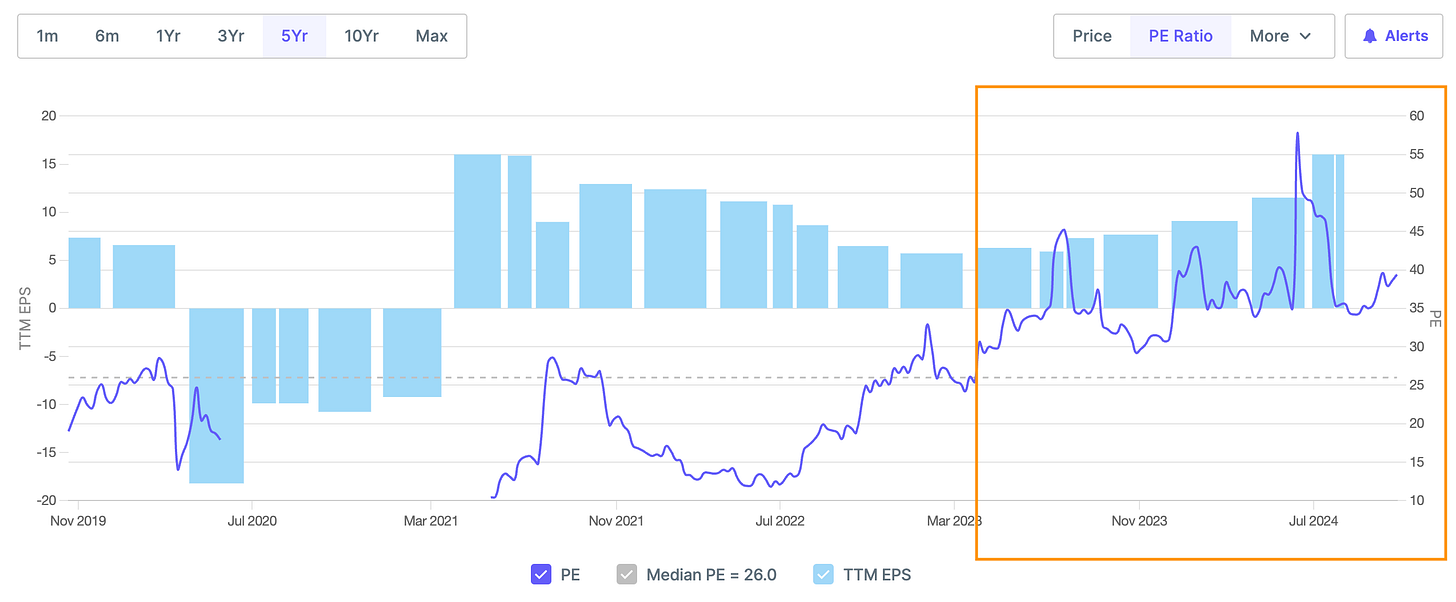
PE at 40 i.e. above historical average
TTM EPS (EPS of Last 4 quarters) - Growing consistently QoQ since March 2023
What led to outperformance
Revenue Growth
Consolidated revenue grew by 12% year-on-year to Rs. 1,033 crores in Q1 FY25, crossing the Rs. 1,000 crore quarterly revenue mark for the first time.
Margin Expansion
EBITDA margin expanded significantly to 9.08% in Q1 FY25, compared to 4.36% in Q1 FY24.
Value-Added Products
i. Value-added products revenue grew 20% year-on-year to Rs. 423 crores, contributing 41.5% of total revenue compared to 38.6% in Q1 FY24.
Procurement Efficiency
Average milk procurement increased 6.66% year-on-year to 1.62 million liters per day, while procurement costs decreased 7.75%.
Sales Volume Growth
Milk sales volumes grew 4.26% year-on-year to 1.13 million liters per day.
New Product Launches
Launched new variants of lassi, ice creams, long shelf-life milk, and healthy laddus to drive growth.
Subsidiary Performance
Heritage Nutrivet Limited saw 29% revenue growth and 363% profit growth year-on-year.
Cost Optimization
Company focusing on operational excellence initiatives like automation and logistics optimization to reduce costs further.
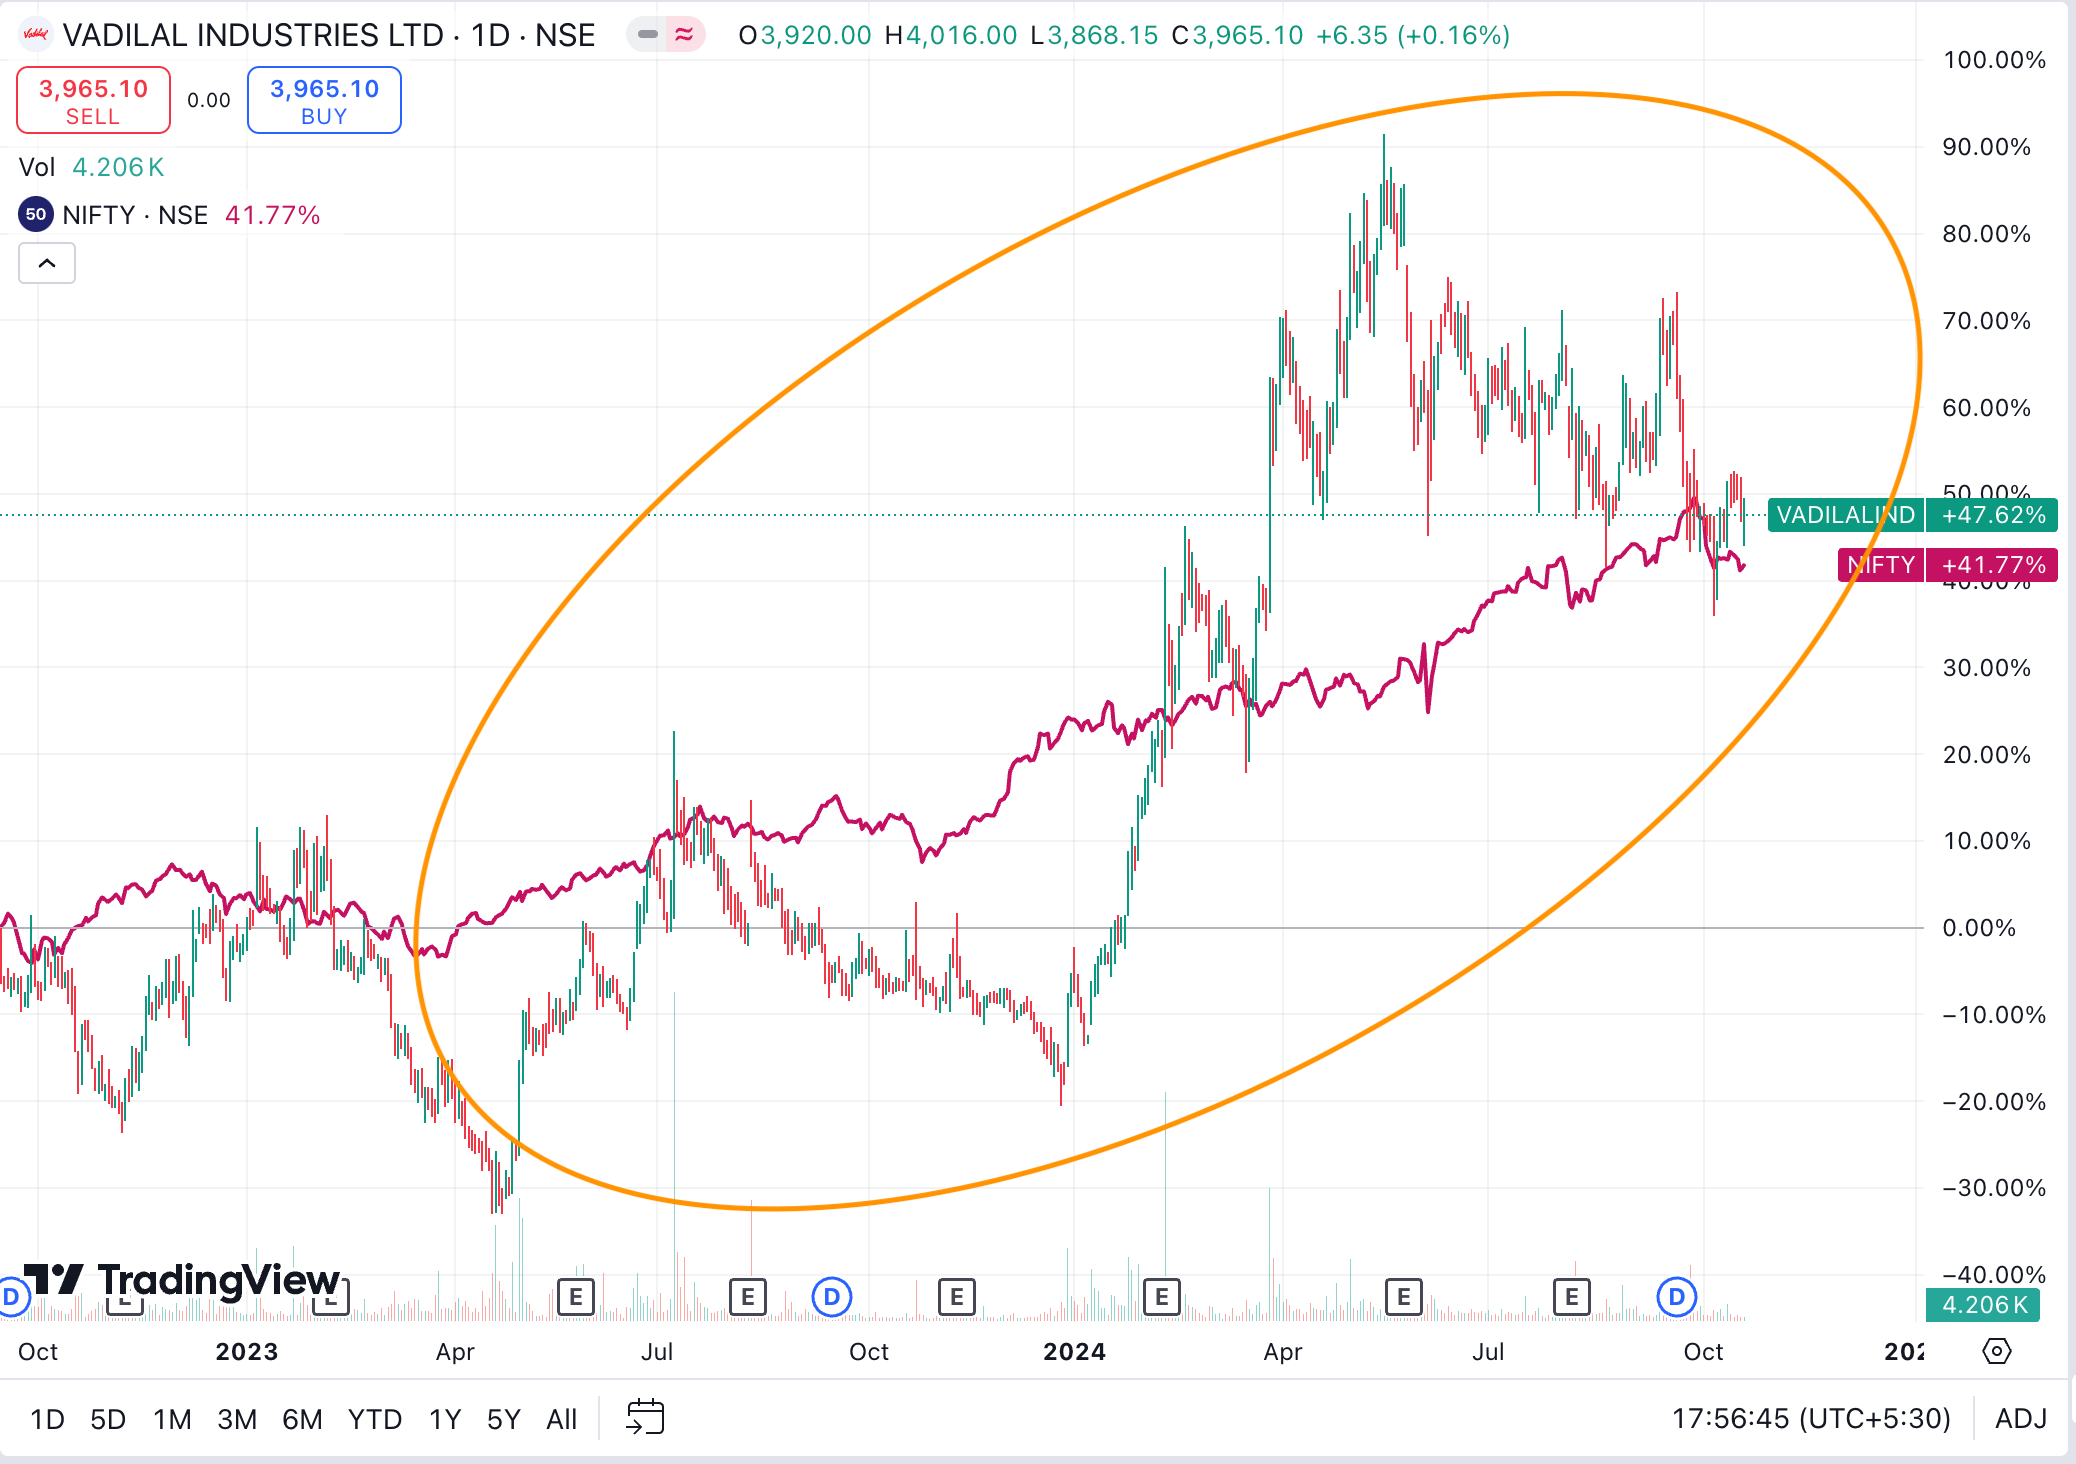
Vadilal Industries Ltd- Market Cap 2,851+ Cr
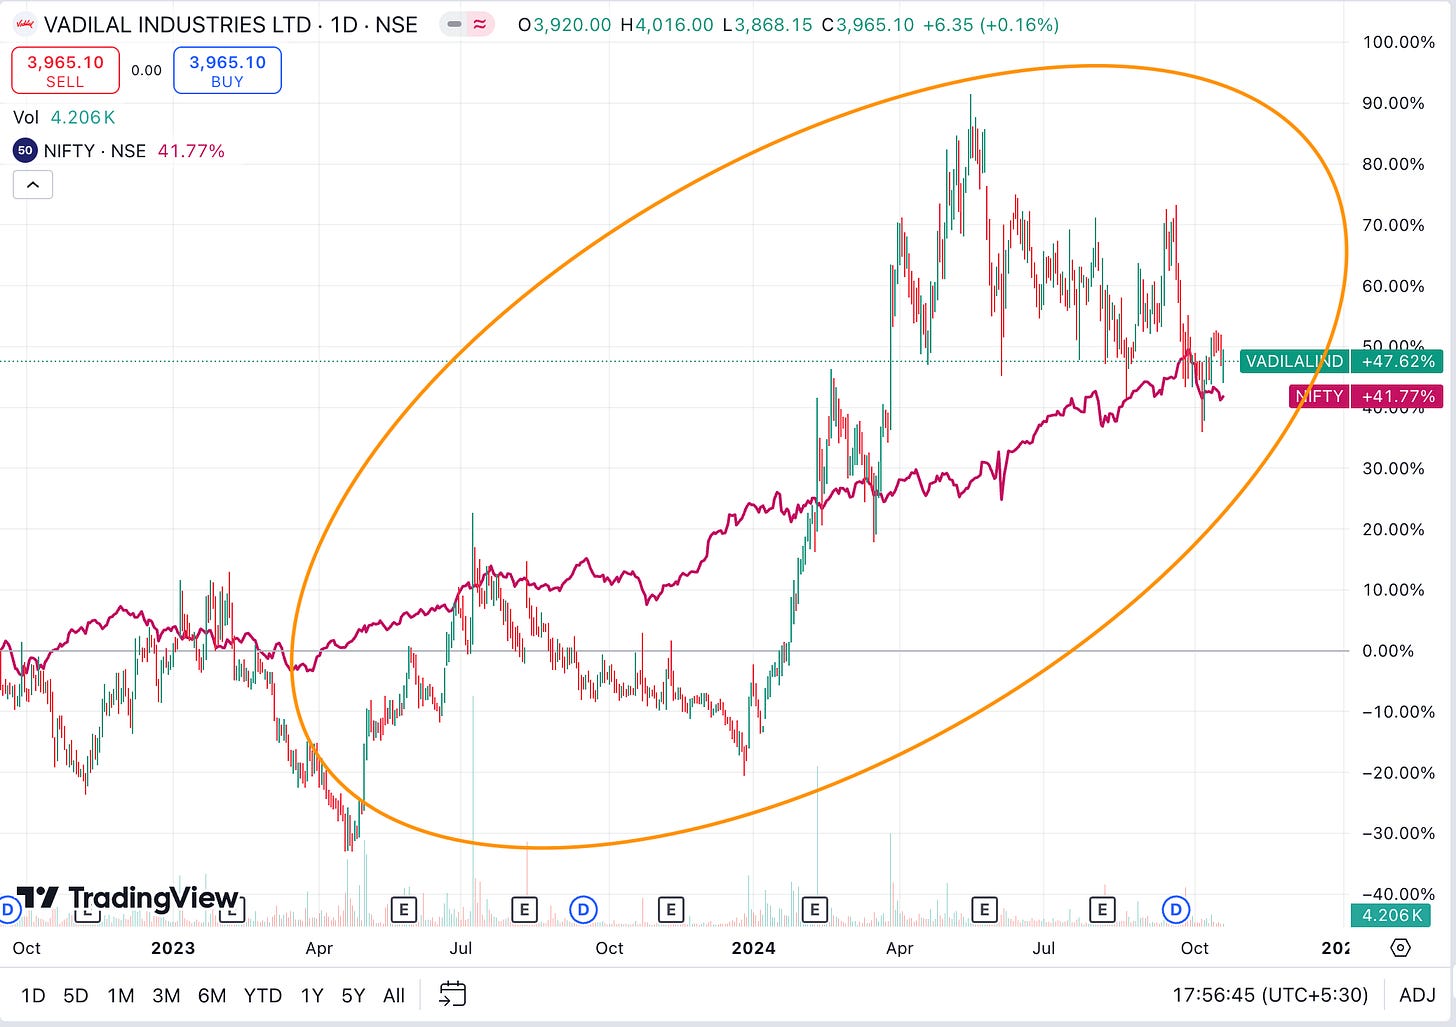
Price Action - Since Oct 22, Vadilal Industries - 48%, NIFTY 42%
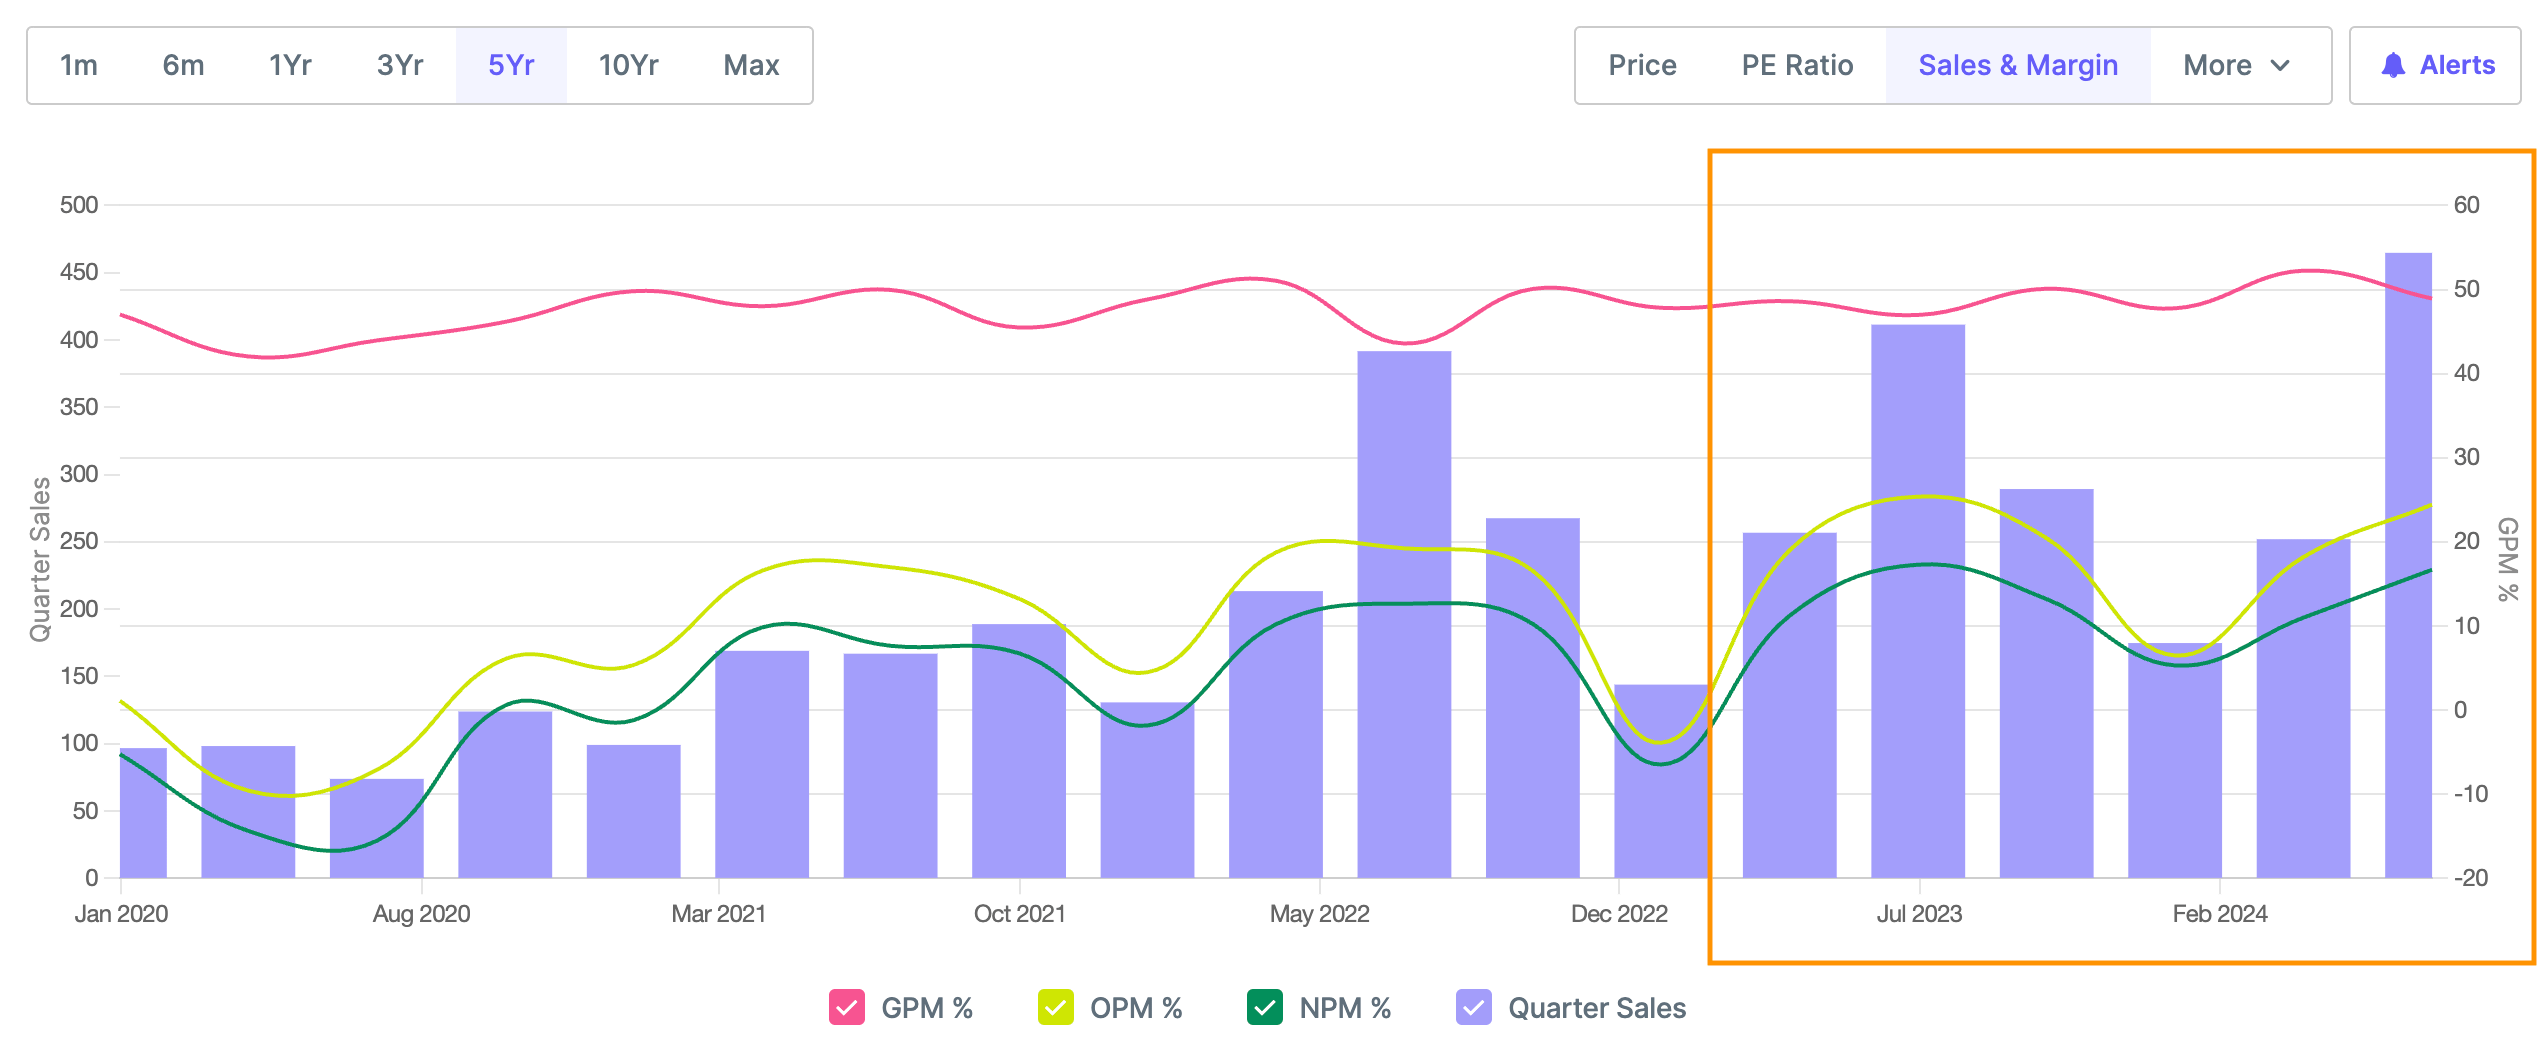
Operational metrics performance - Below chart shows Gross, Operating and Net Profit Margin improving quarterly since Aug 2020 and revenue also scaling up from Aug 2020. Big jump in Revenue and Profit margins seen from Dec 2022.
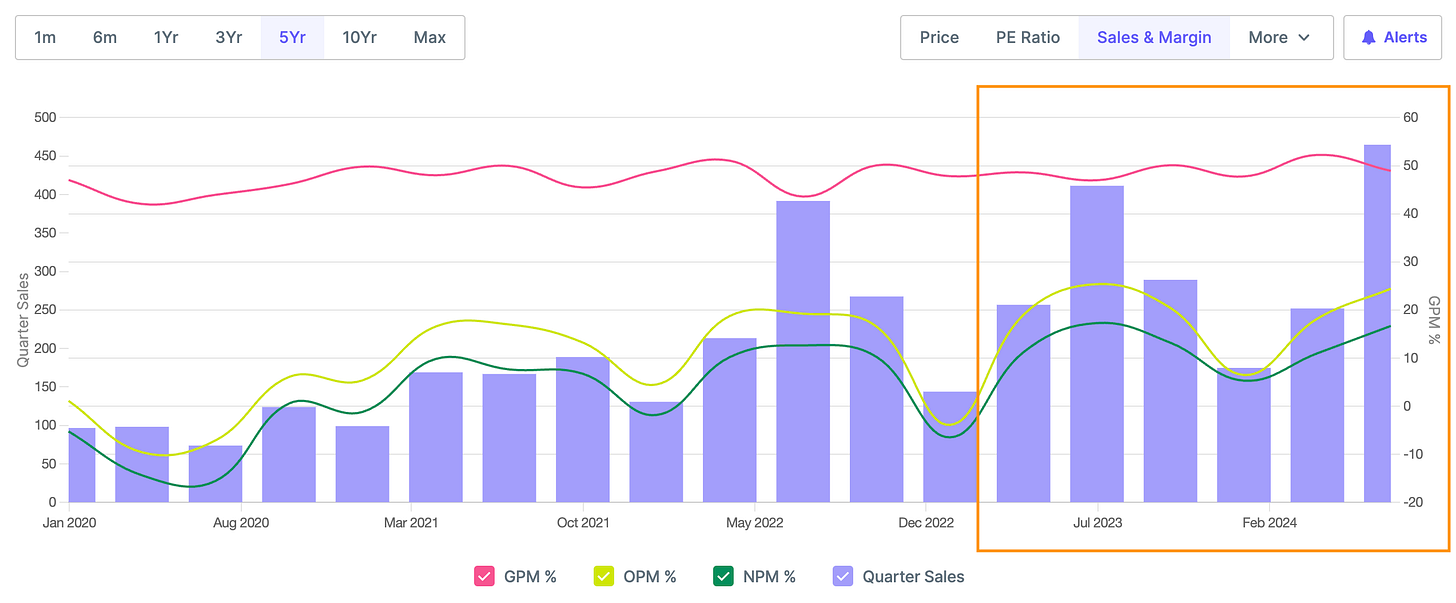
Q1 25 results (QoQ Increase) - Sales increased by 85% and Profits increased by 55%
Q1 25 results (YoY increase) - Sales increased by 13% and Profits decreased by 4%
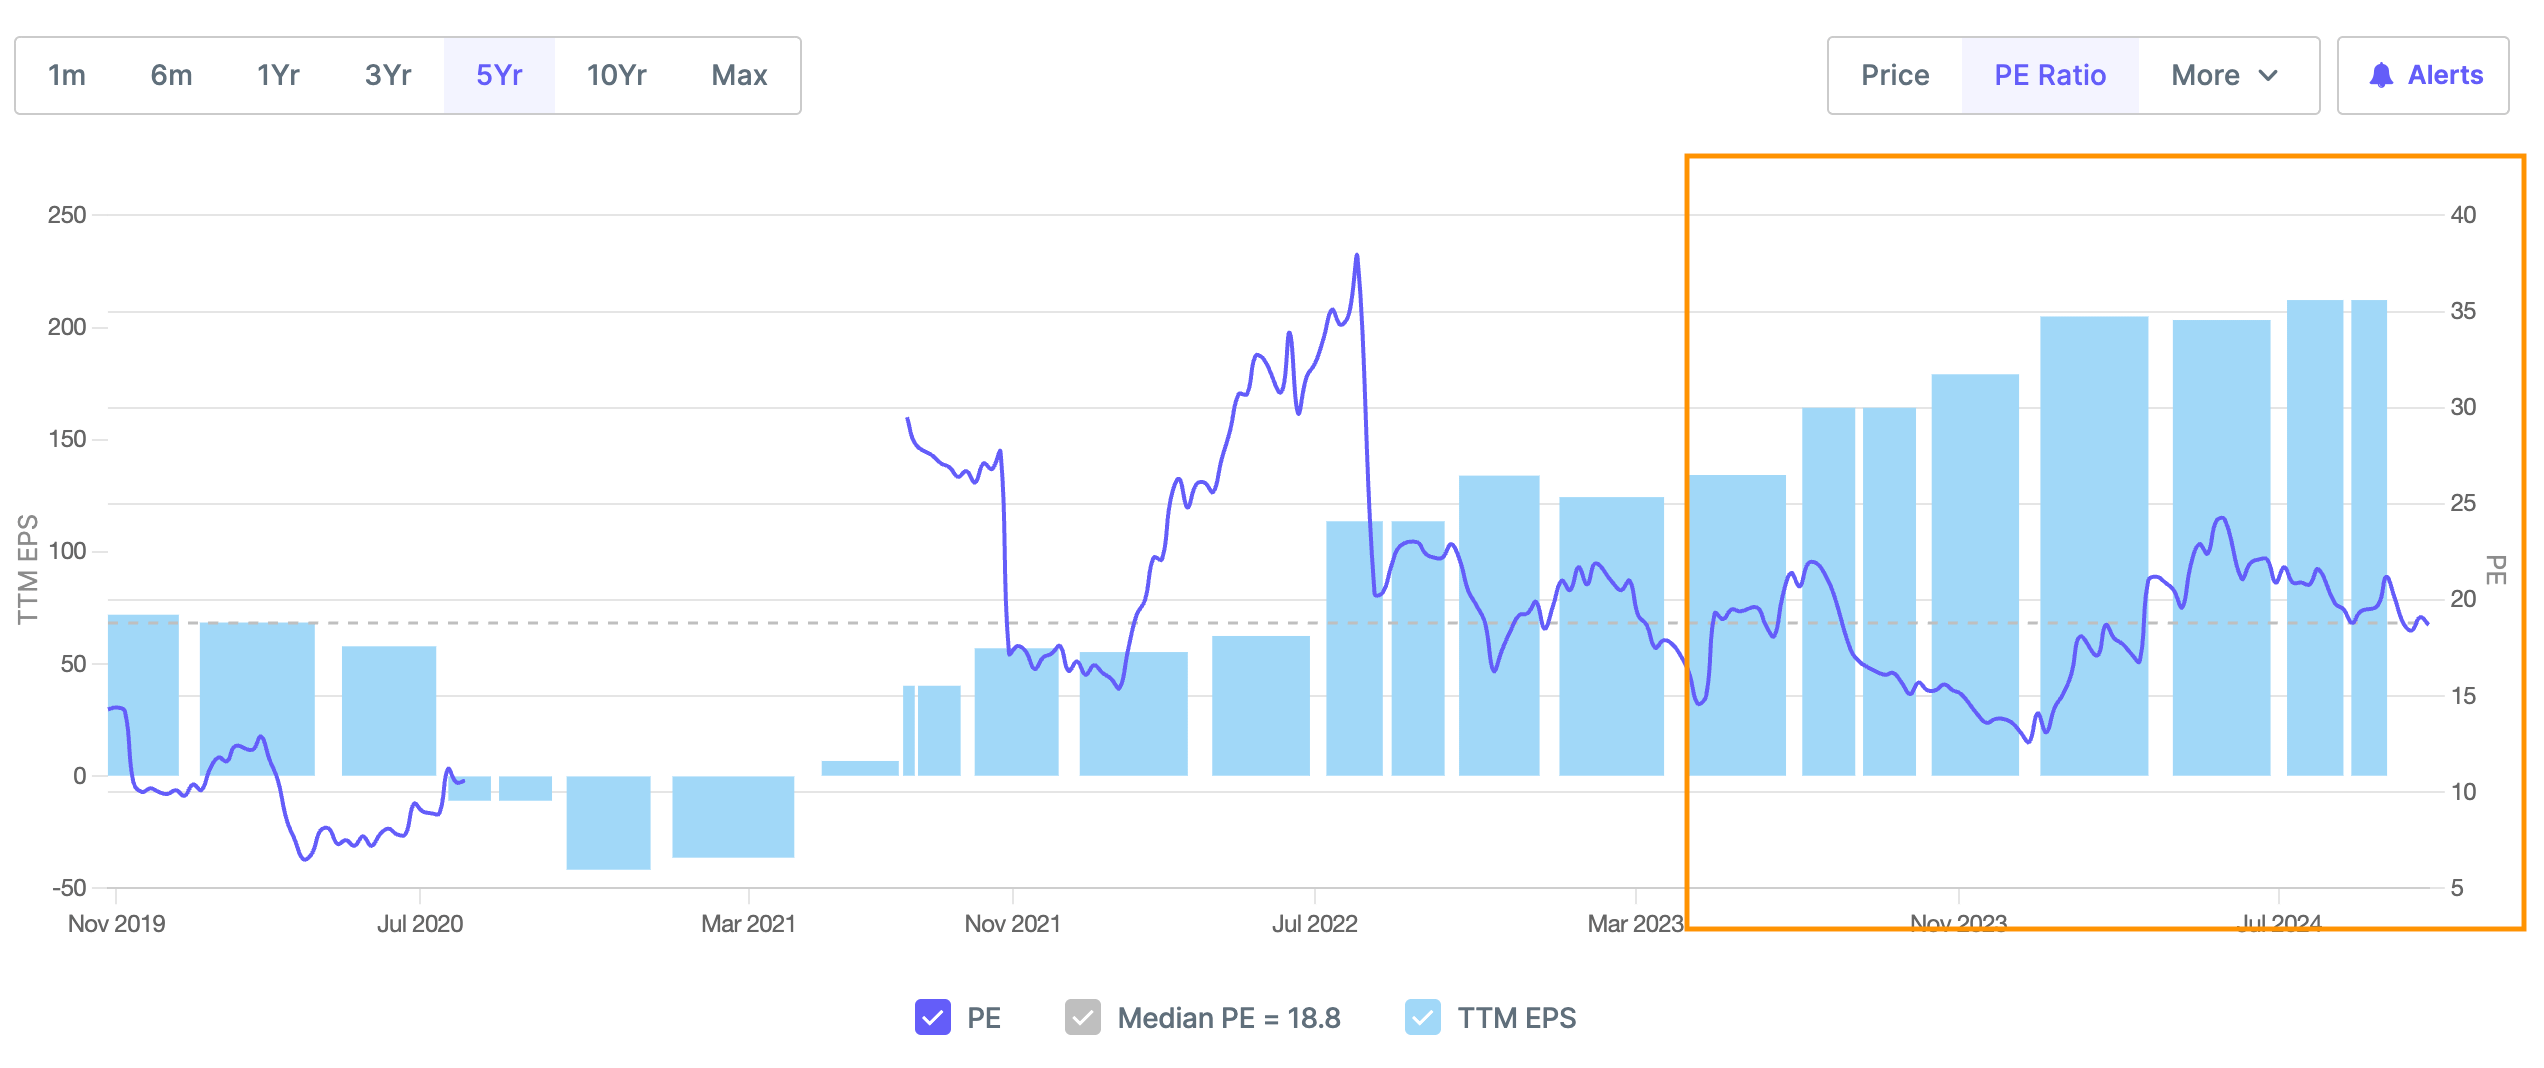
Valuations and EPS - Below chart shows Price has grown almost at the same rate as TTM EPS (EPS of last 4 quarters) from May 2023 leading to PE stablising at historical average of. 30
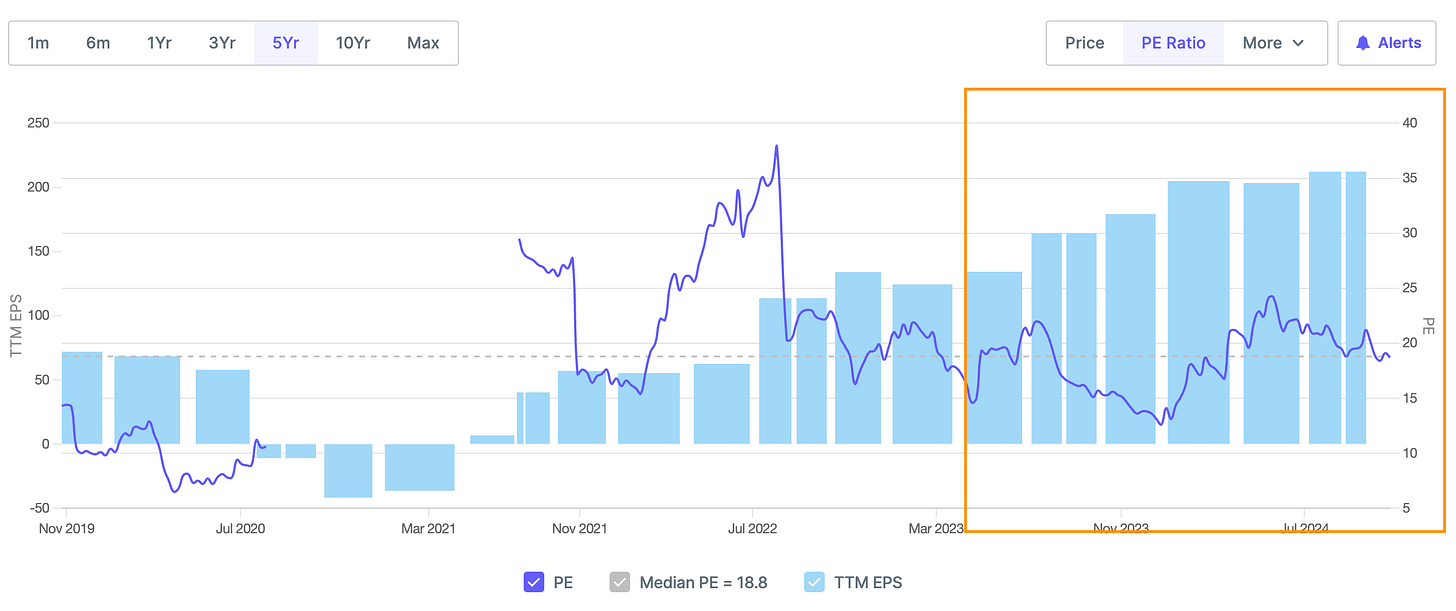
PE consistent at 30 i.e. at historical average
TTM EPS (EPS of Last 4 quarters) - Growing consistently QoQ since May 2023
What led to outperformance
No concalls published
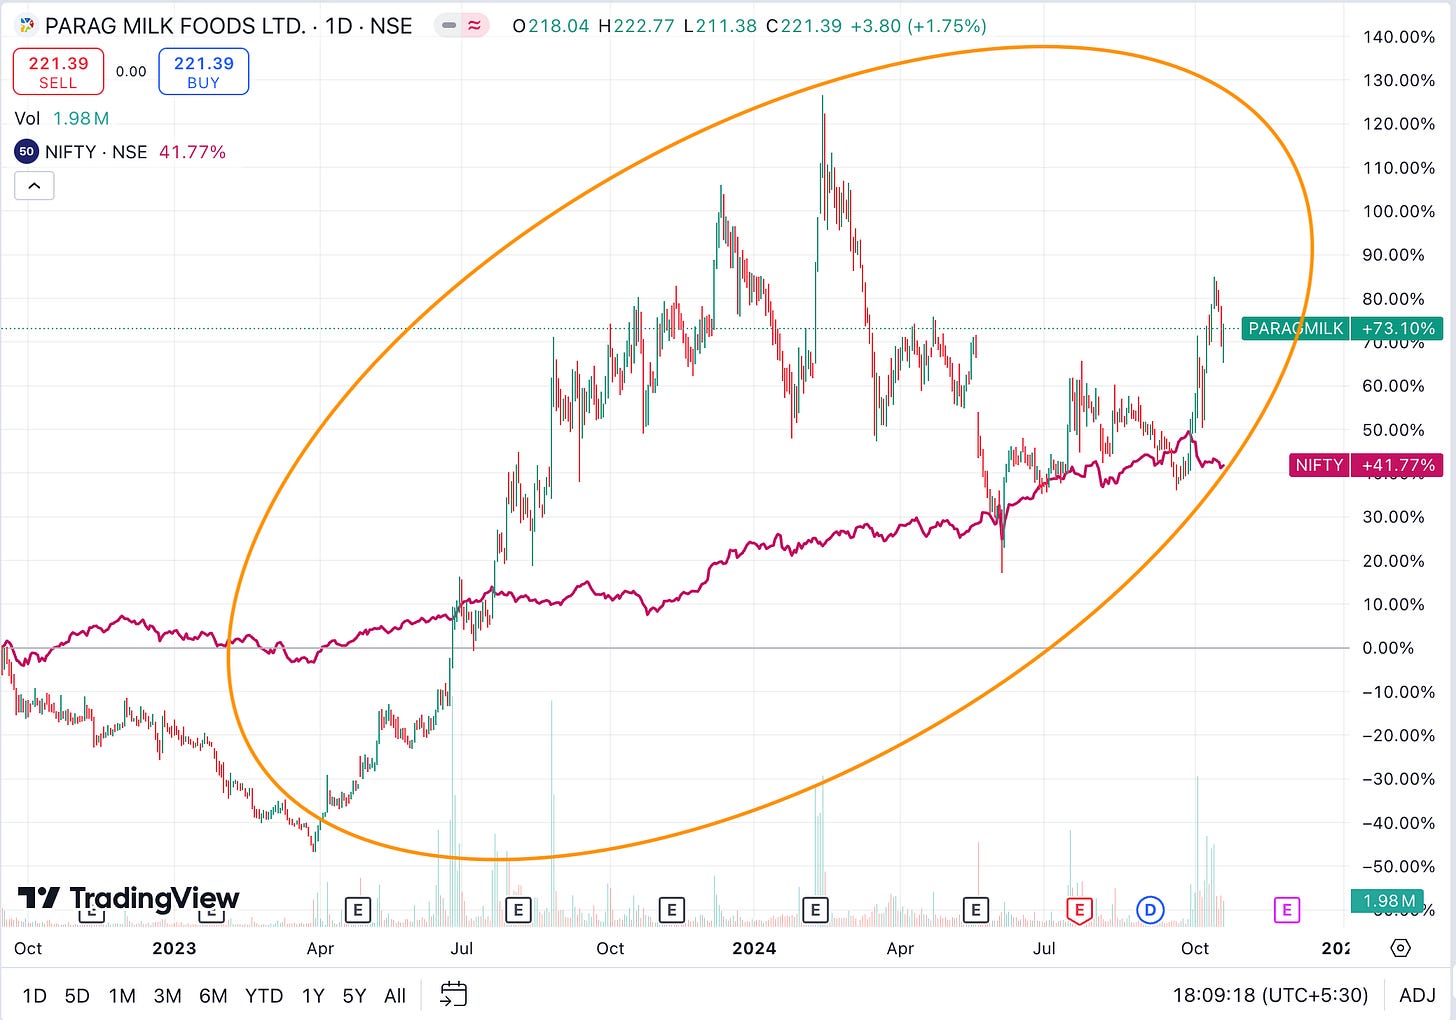
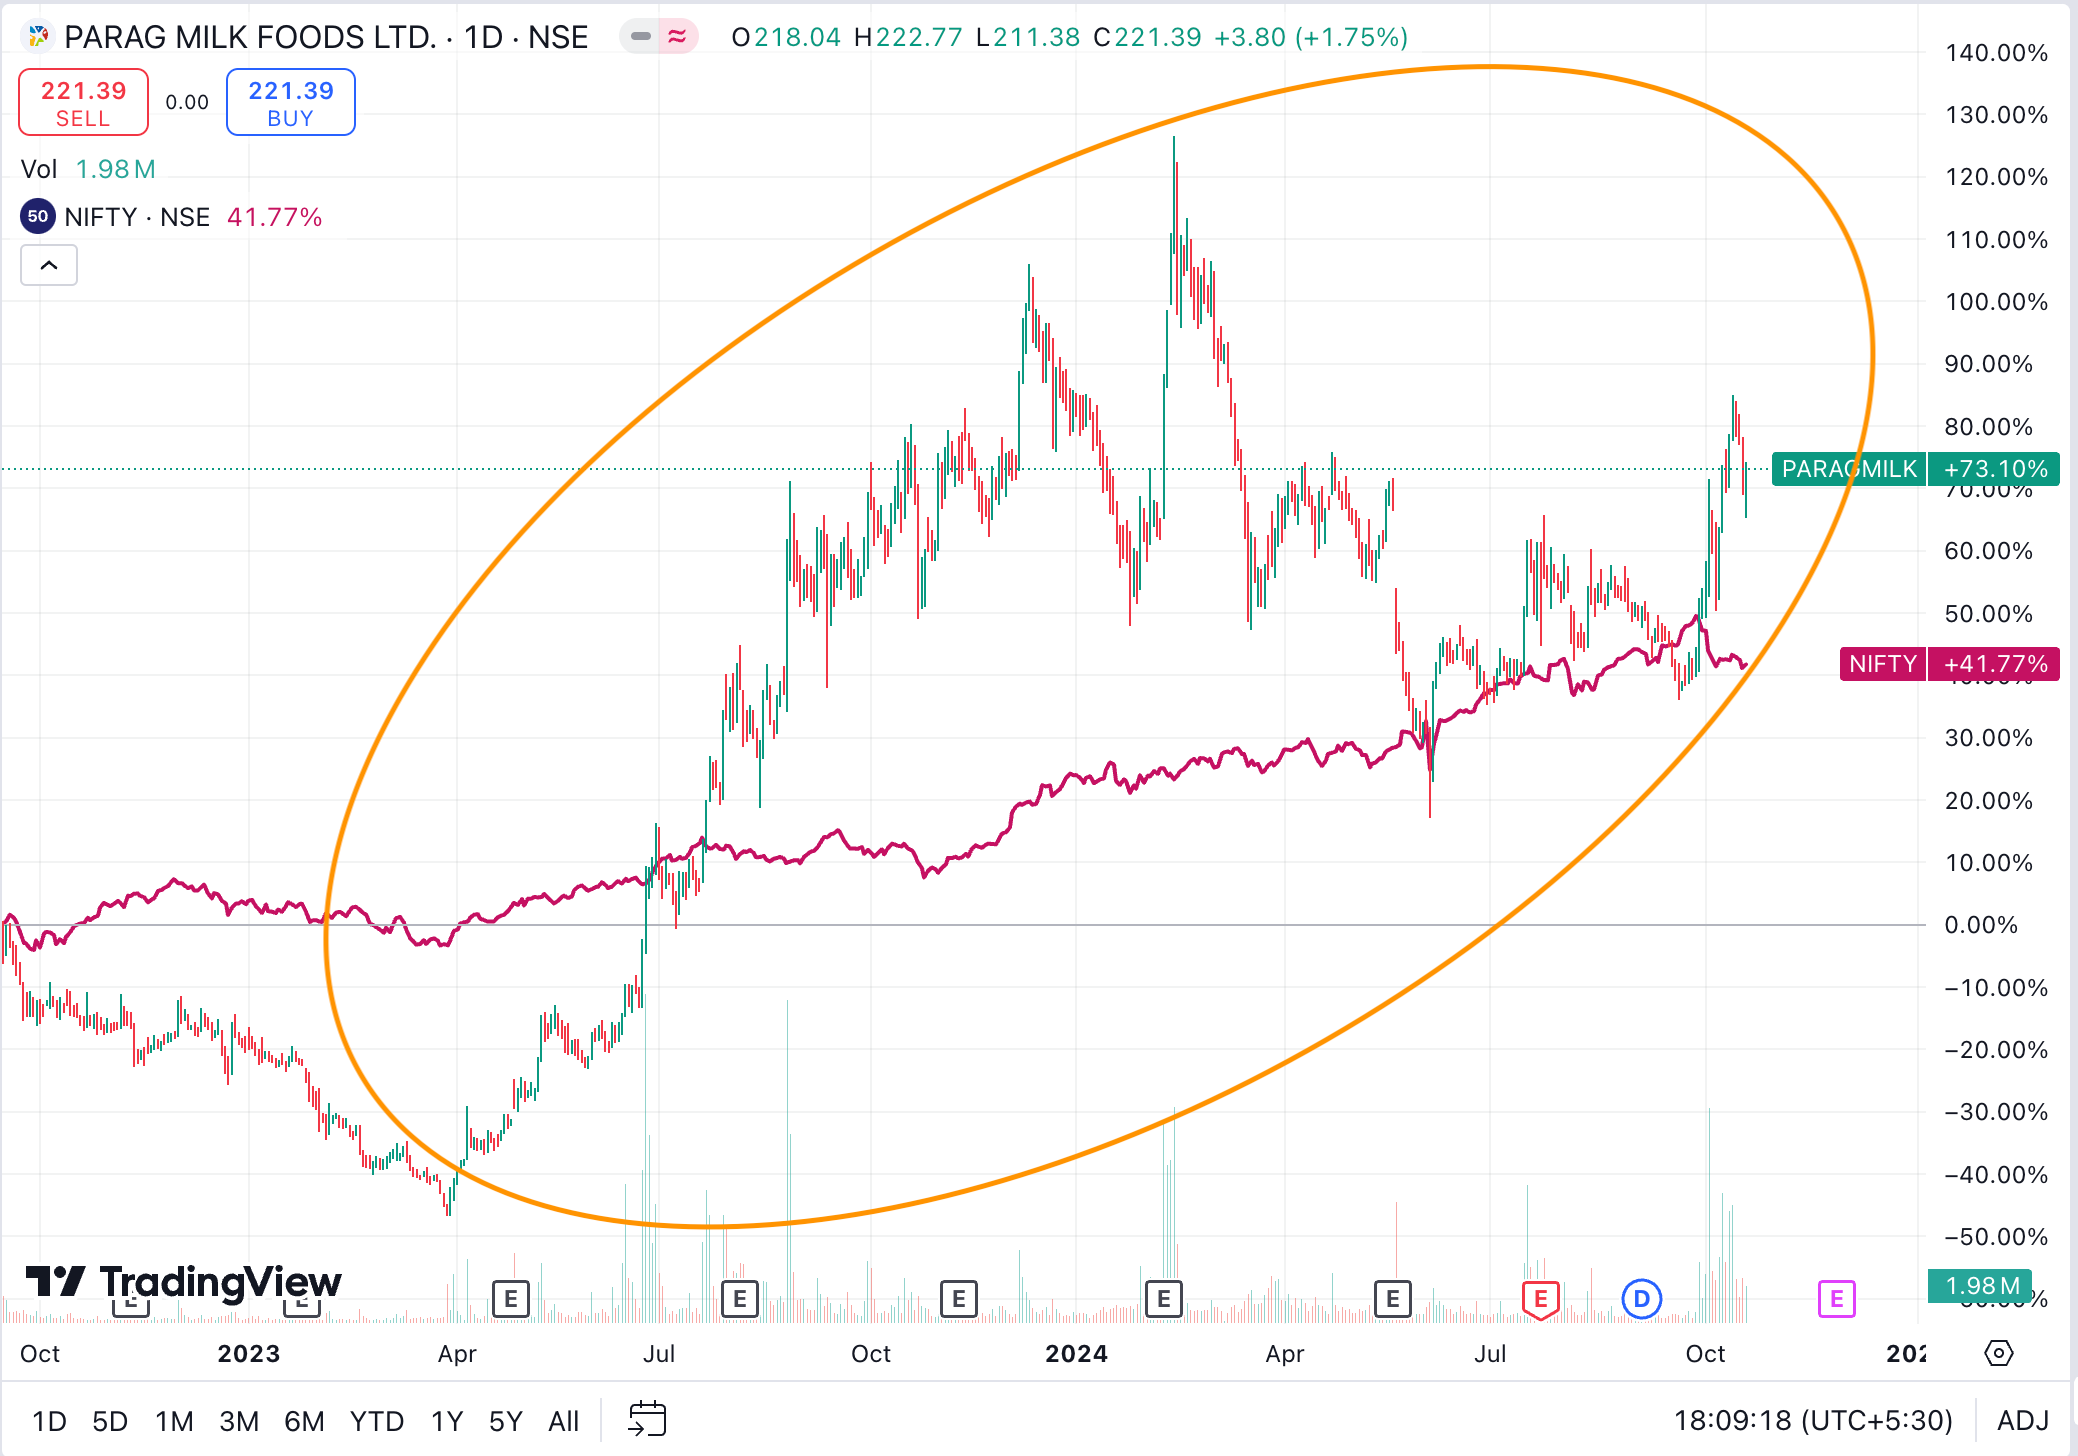
Parag Milk Foods Ltd - Market Cap 2,643+ Cr
Price Action - Since Oct 22, Parag Milk Foods - 73%, NIFTY 42%
Operational metrics performance - Below chart shows Gross, Operating and Net Profit Margin improving quarterly since May 2022 and revenue also increasing quarterly from July 2022
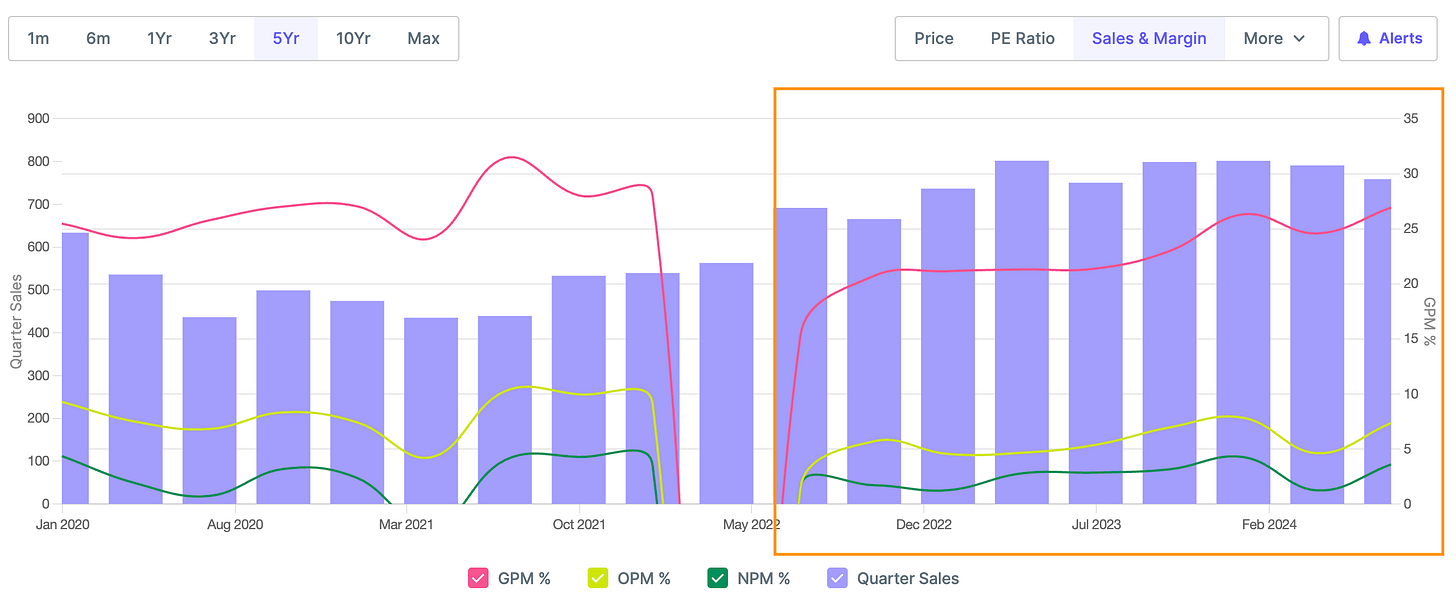
Q1 25 results (QoQ Increase) - Sales decreased by 4% and Profits increased by 77%
Q1 25 results (YoY increase) - Sales increased by 1% and Profits increased by 37%
Valuations and EPS - Below chart shows Price and TTM EPS growing at the same rate leading to PE stablising around the historical average of 30
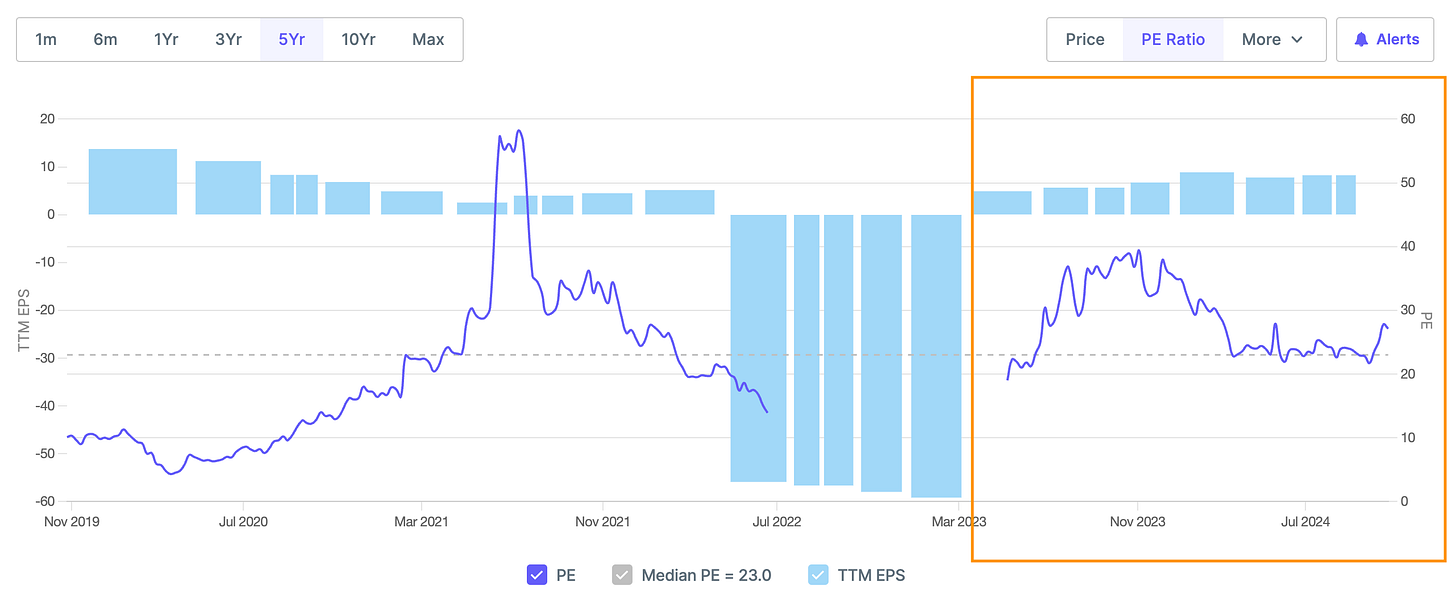
PE at 30, slightly above historical average
TTM EPS (EPS of Last 4 quarters) - Growing consistently QoQ since May 2023
What led to outperformance
Volume Growth
Overall volume growth of 10% year-on-year in Q1 FY25, with ghee volumes growing 15% and cheese volumes growing 12%.
Margin Expansion
EBITDA margin expanded to 8.1% in Q1 FY25 compared to 6.5% in Q1 FY24.
Profitability Growth
PBT grew by 77% year-on-year and PAT grew by 27% year-on-year in Q1 FY25.
Value-Added Products
New age business volumes grew 51% year-on-year, indicating shift towards higher-margin products.
Cost Optimization
Milk procurement prices decreased 16% year-on-year and 4% sequentially, supporting margin expansion.
Operational Efficiency
Company focusing on digitization of plants & operations and data analytics to drive business transformation.
Distribution Expansion
Aims to reach 13-15 lakh retail touch points by 2027, up from current 4.6 lakh touch points.
New Product Launches
Launched new products across categories to drive growth.
Capacity Utilization
Has 3.4 million liters/day milk processing capacity, indicating room for volume growth with existing assets.
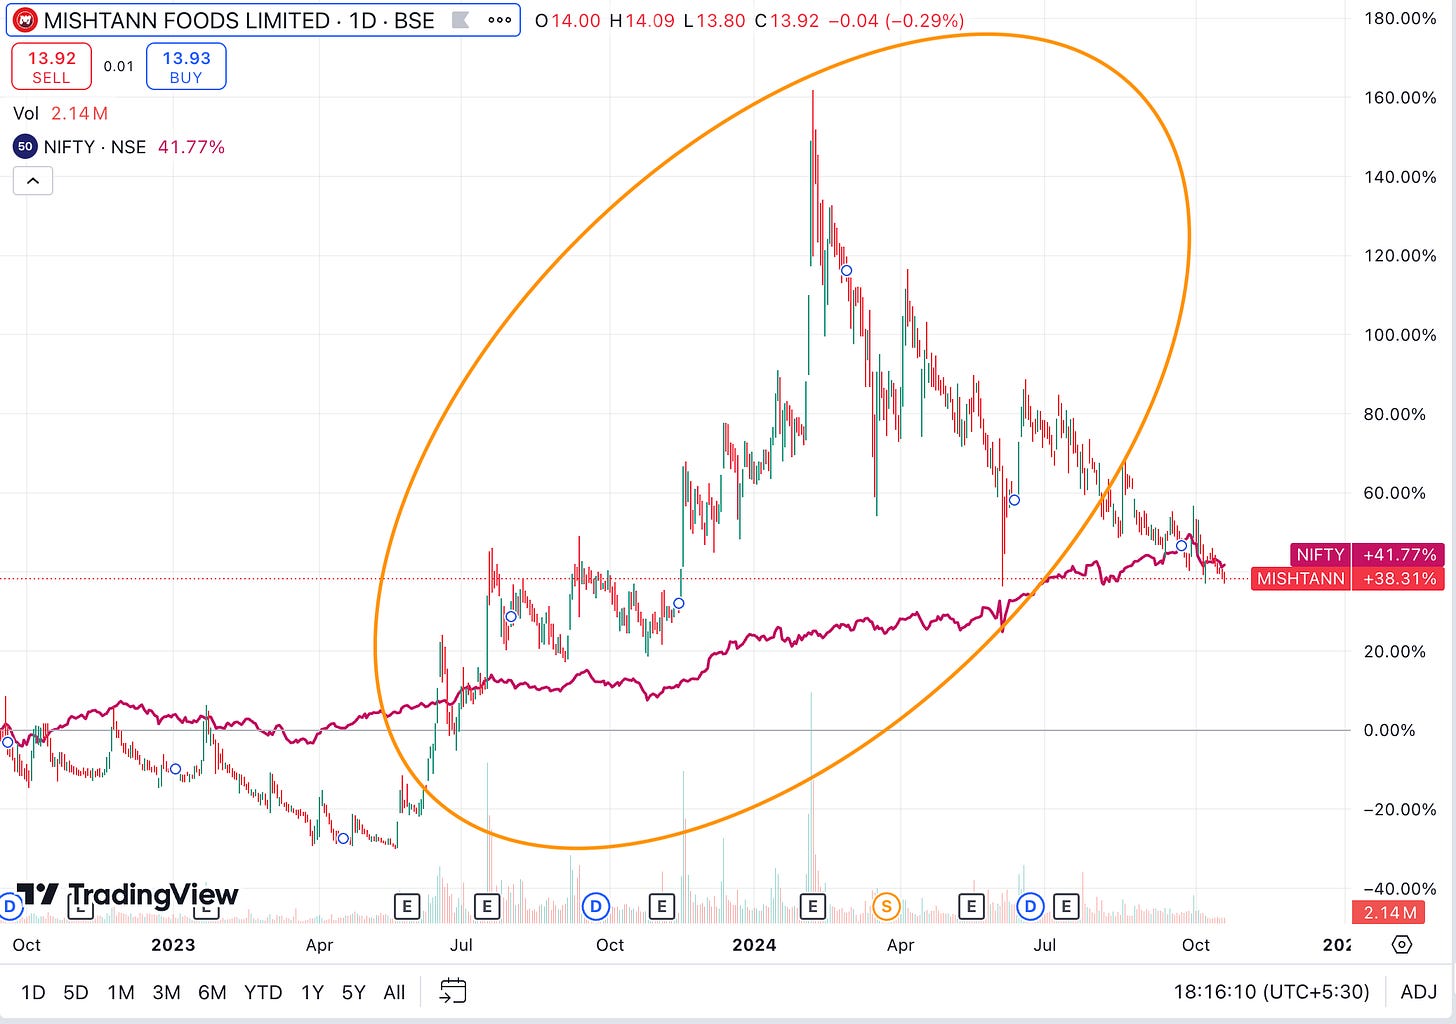
Mishtann Foods Ltd - Market Cap 1,500+ Cr
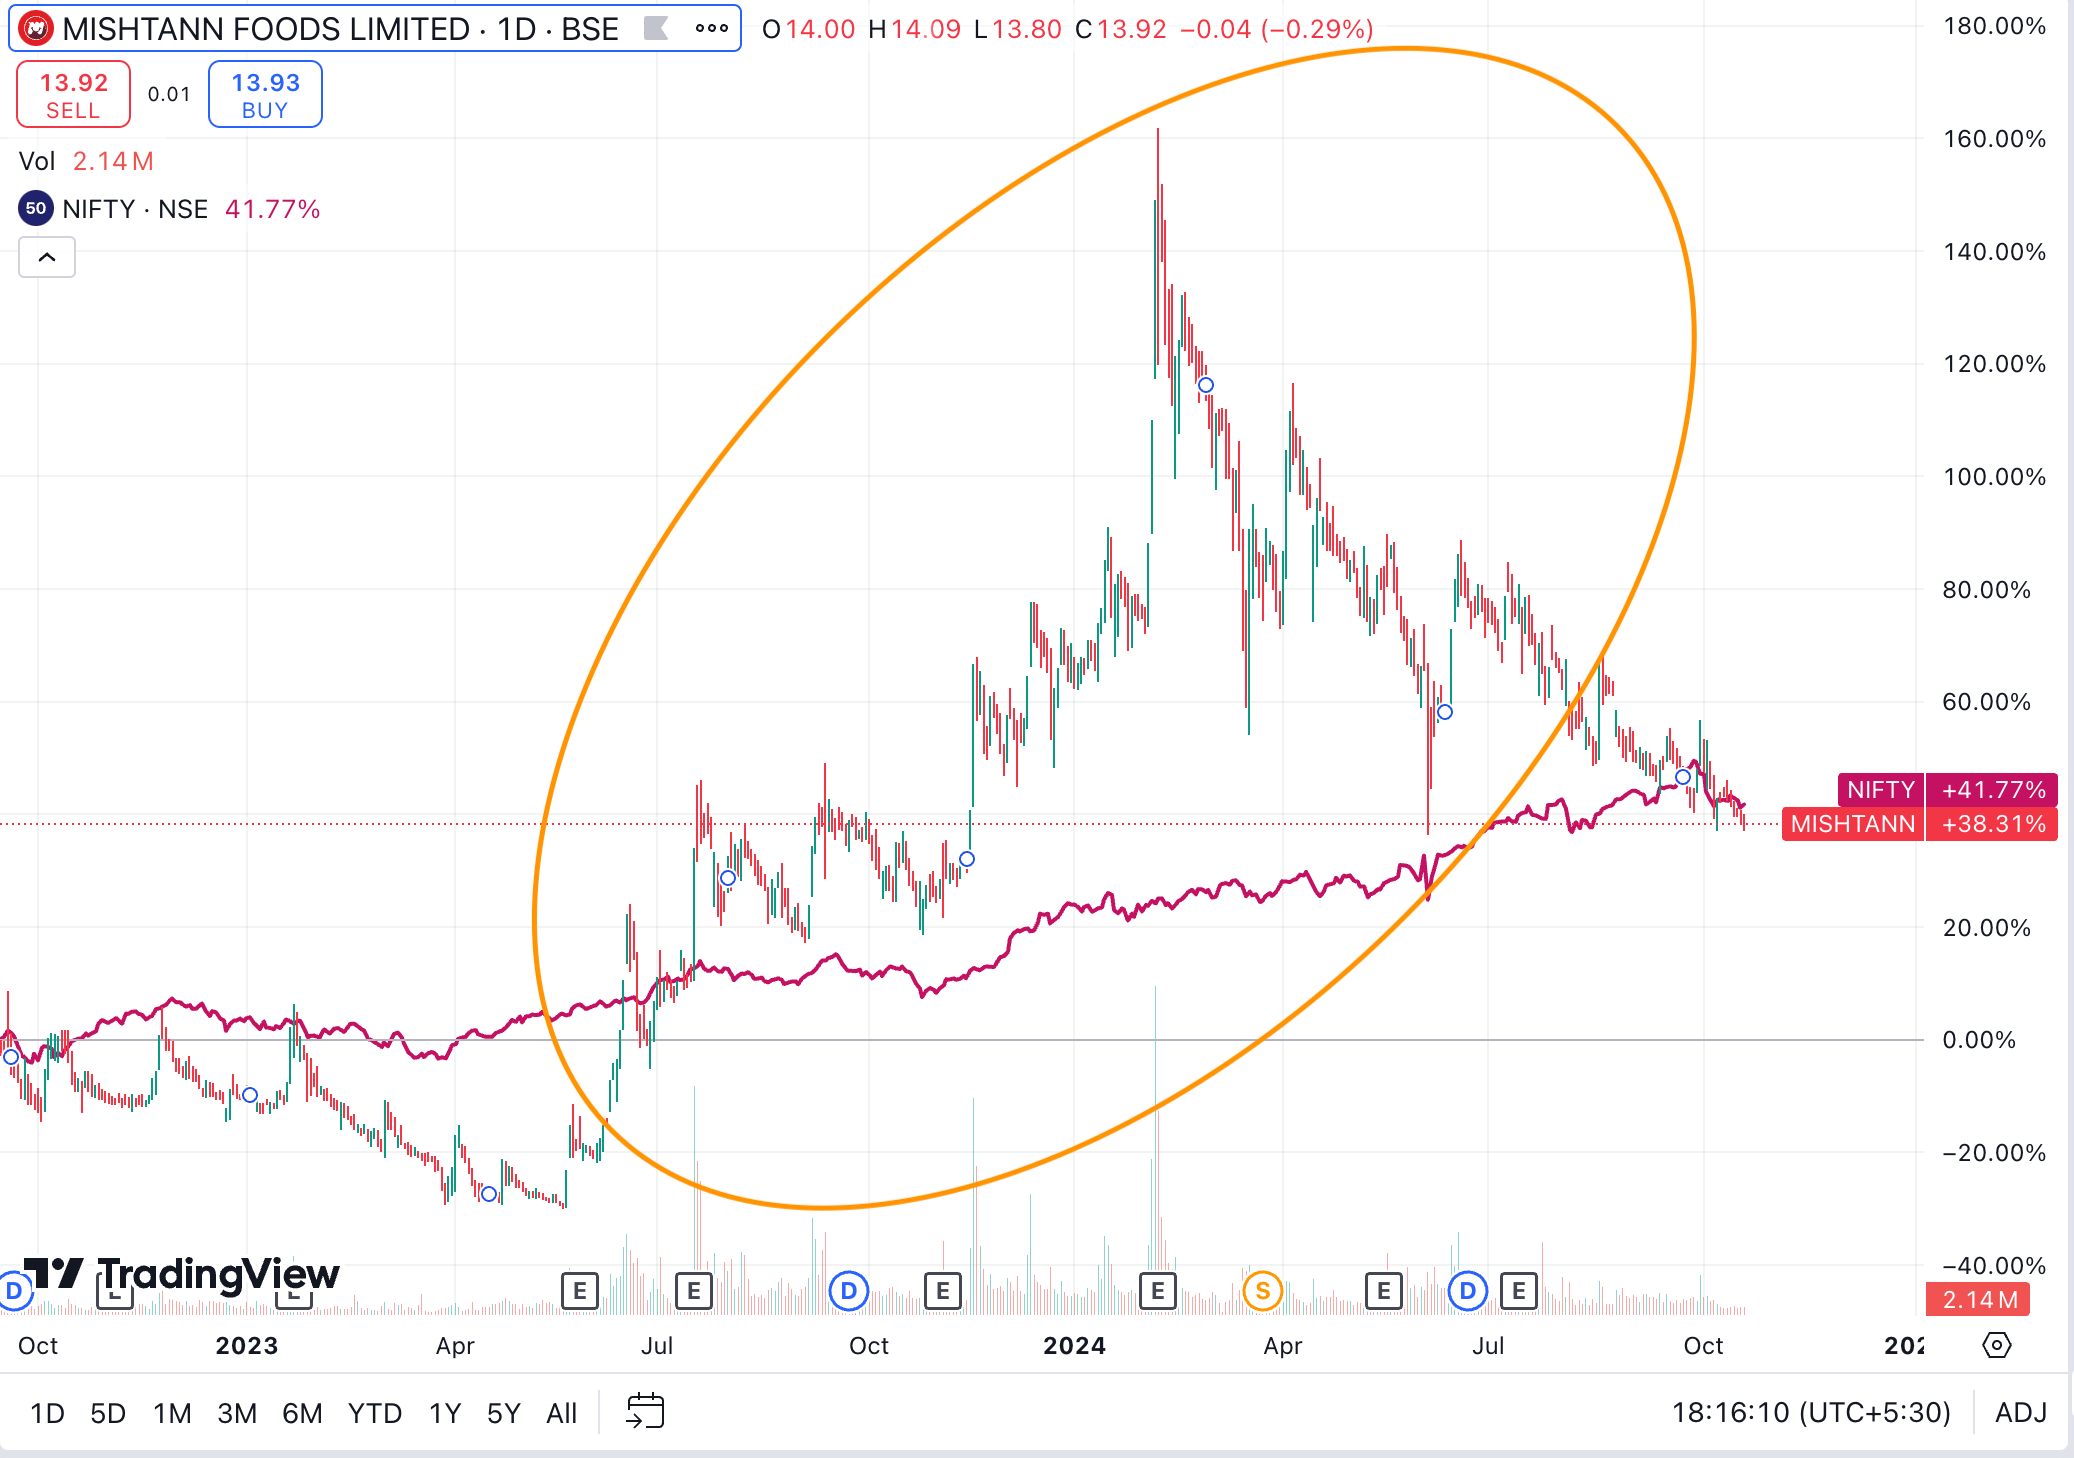
Price Action - Since Oct 22, Mishtann Foods - 38%, NIFTY 42%
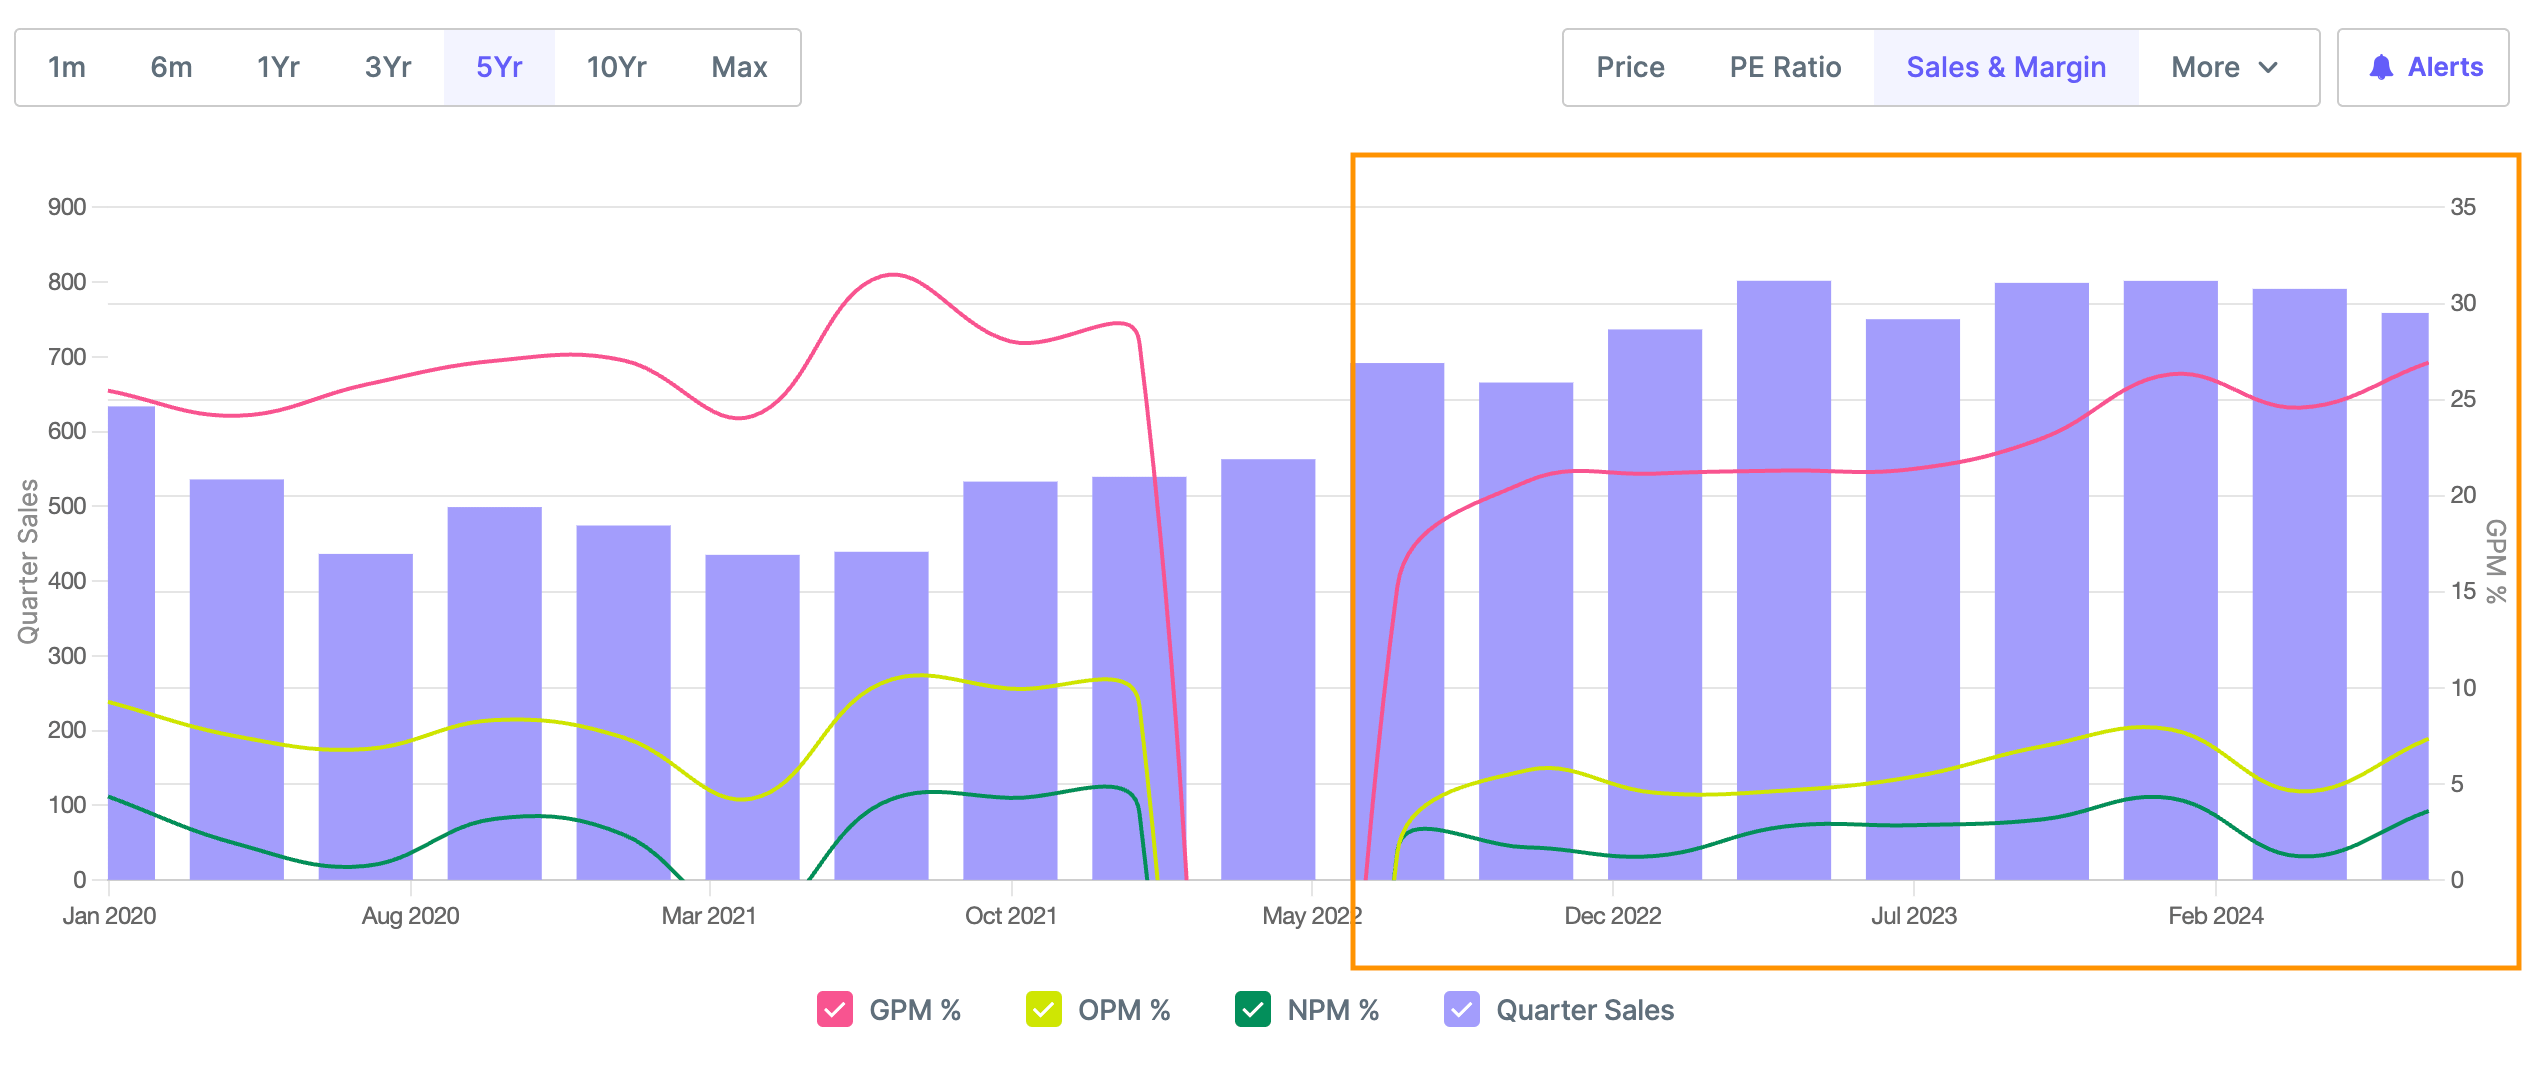
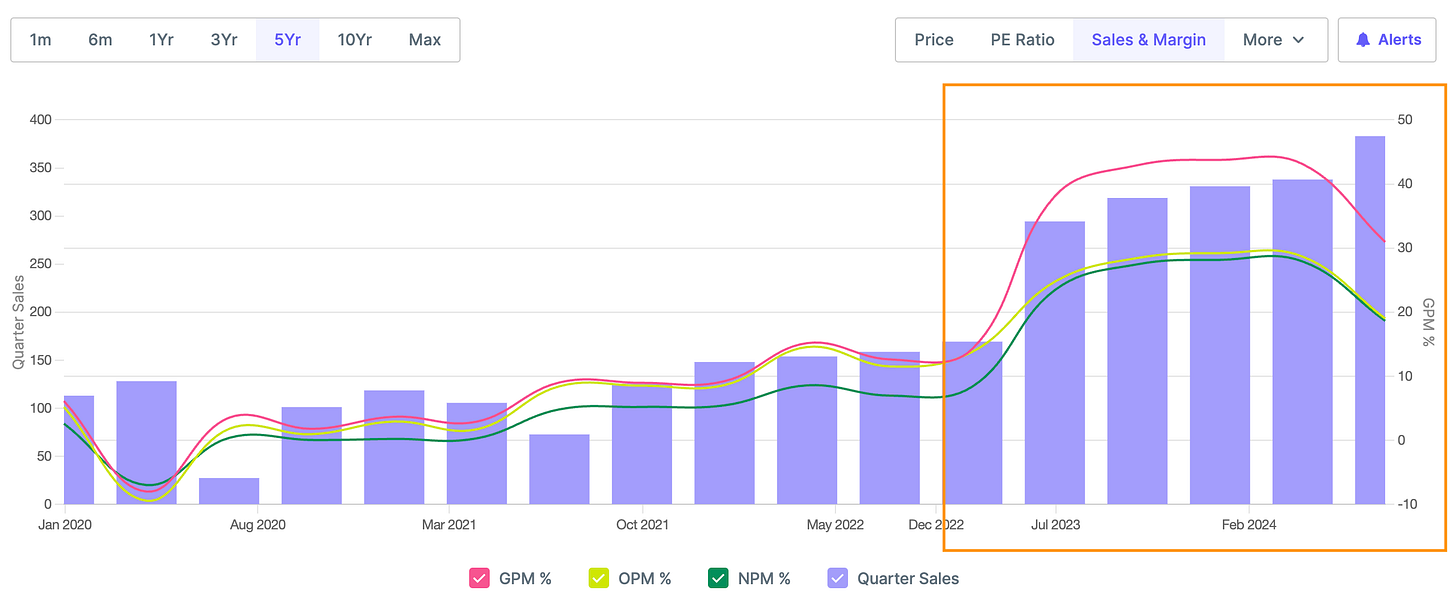
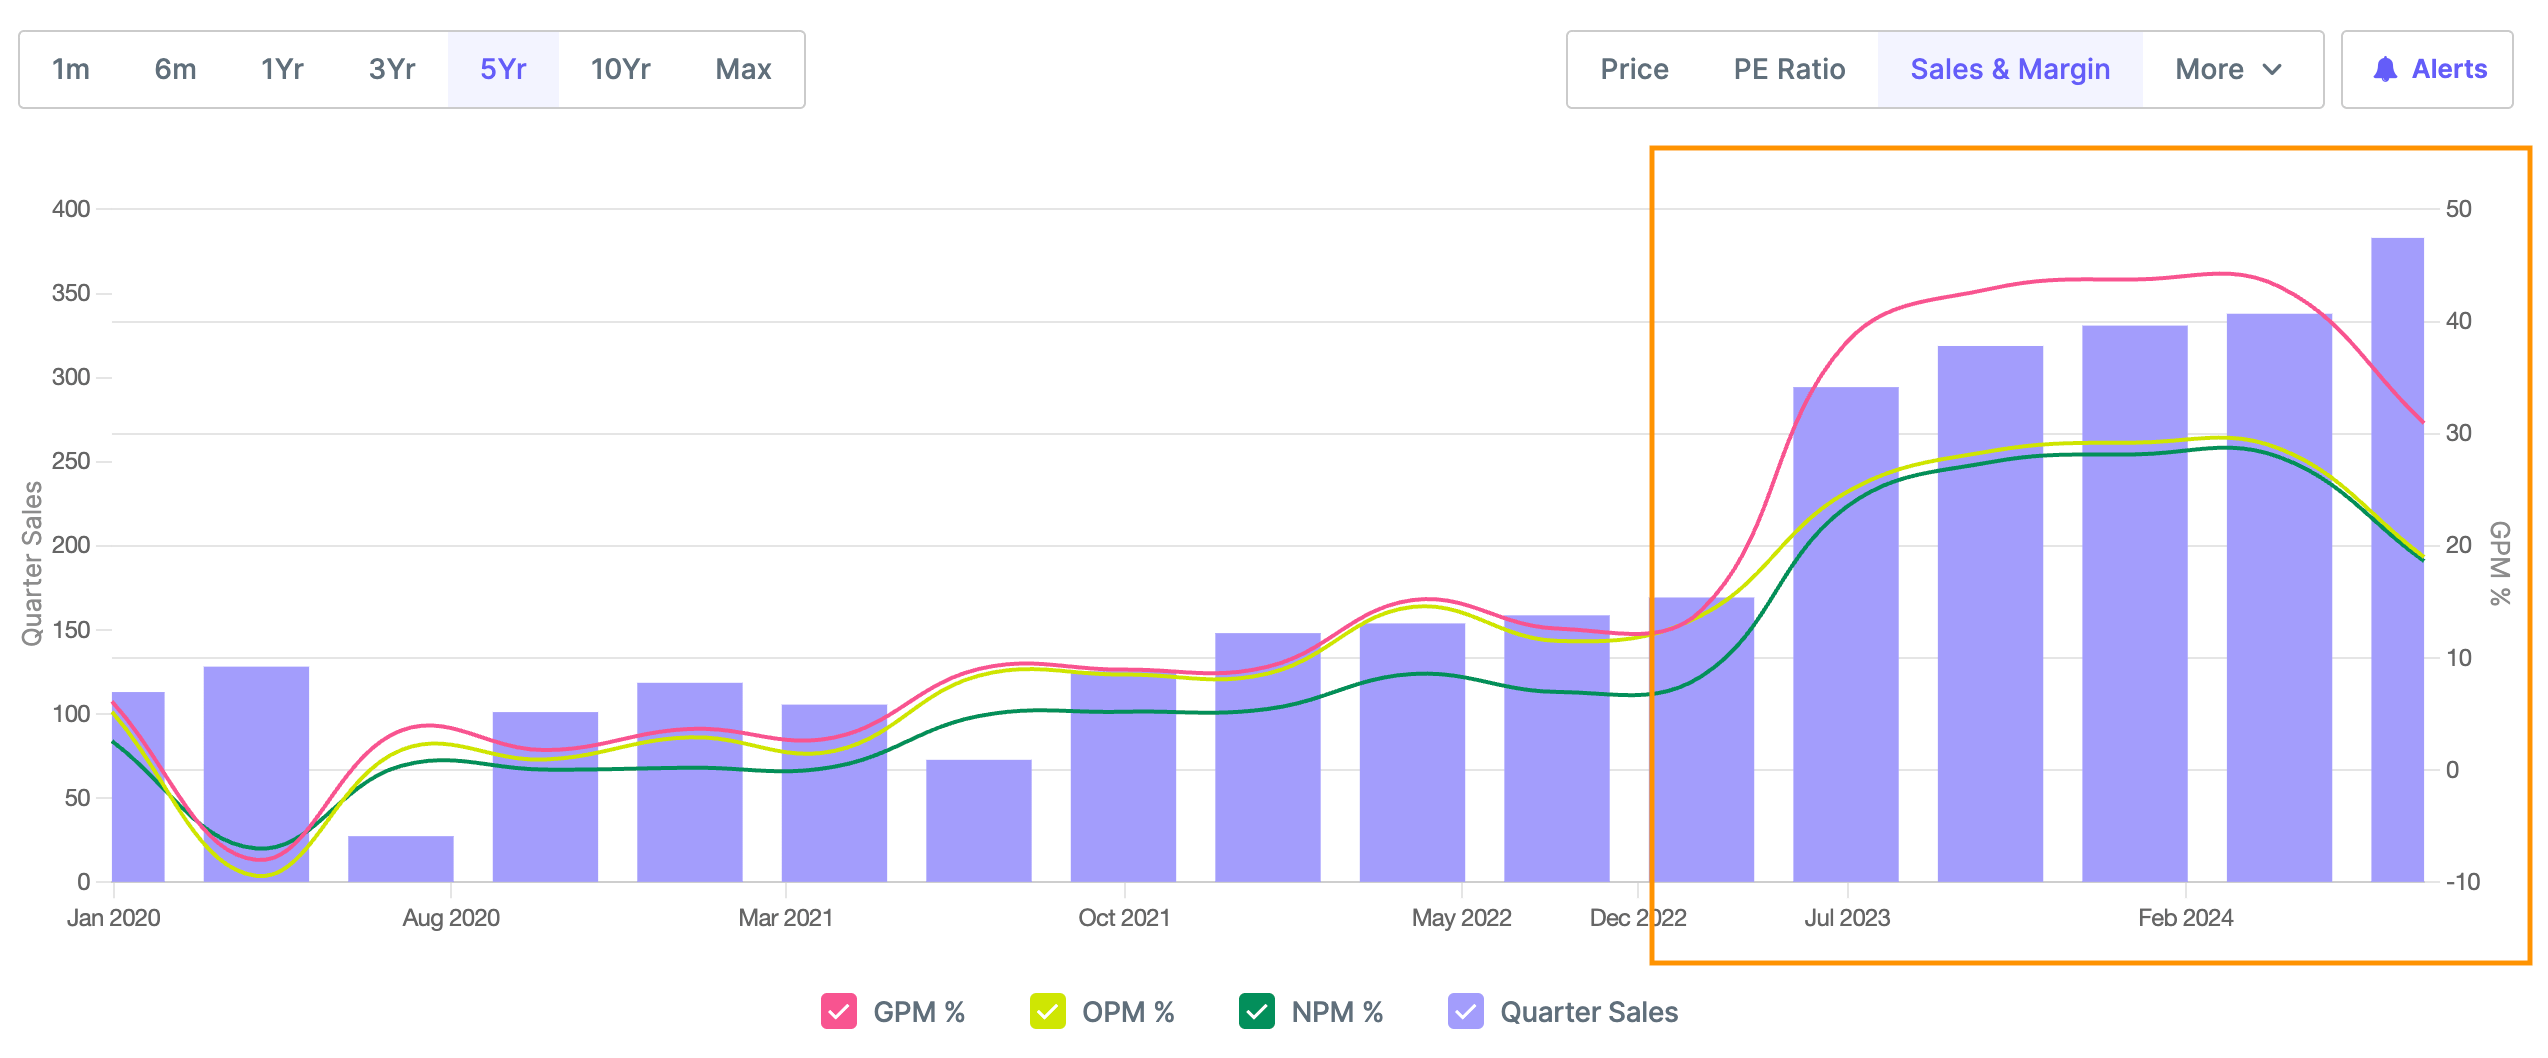
Operational metrics performance - Below chart shows Gross, Operating and Net Profit Margin improving quarterly since Dec 2022 and revenue scaling up massively from July 2023
Q1 25 results (QoQ Increase) - Sales increased by 13% and Profits increased by 50%
Q1 25 results (YoY increase) - Sales increased by 30% and Profits decreased by 23%
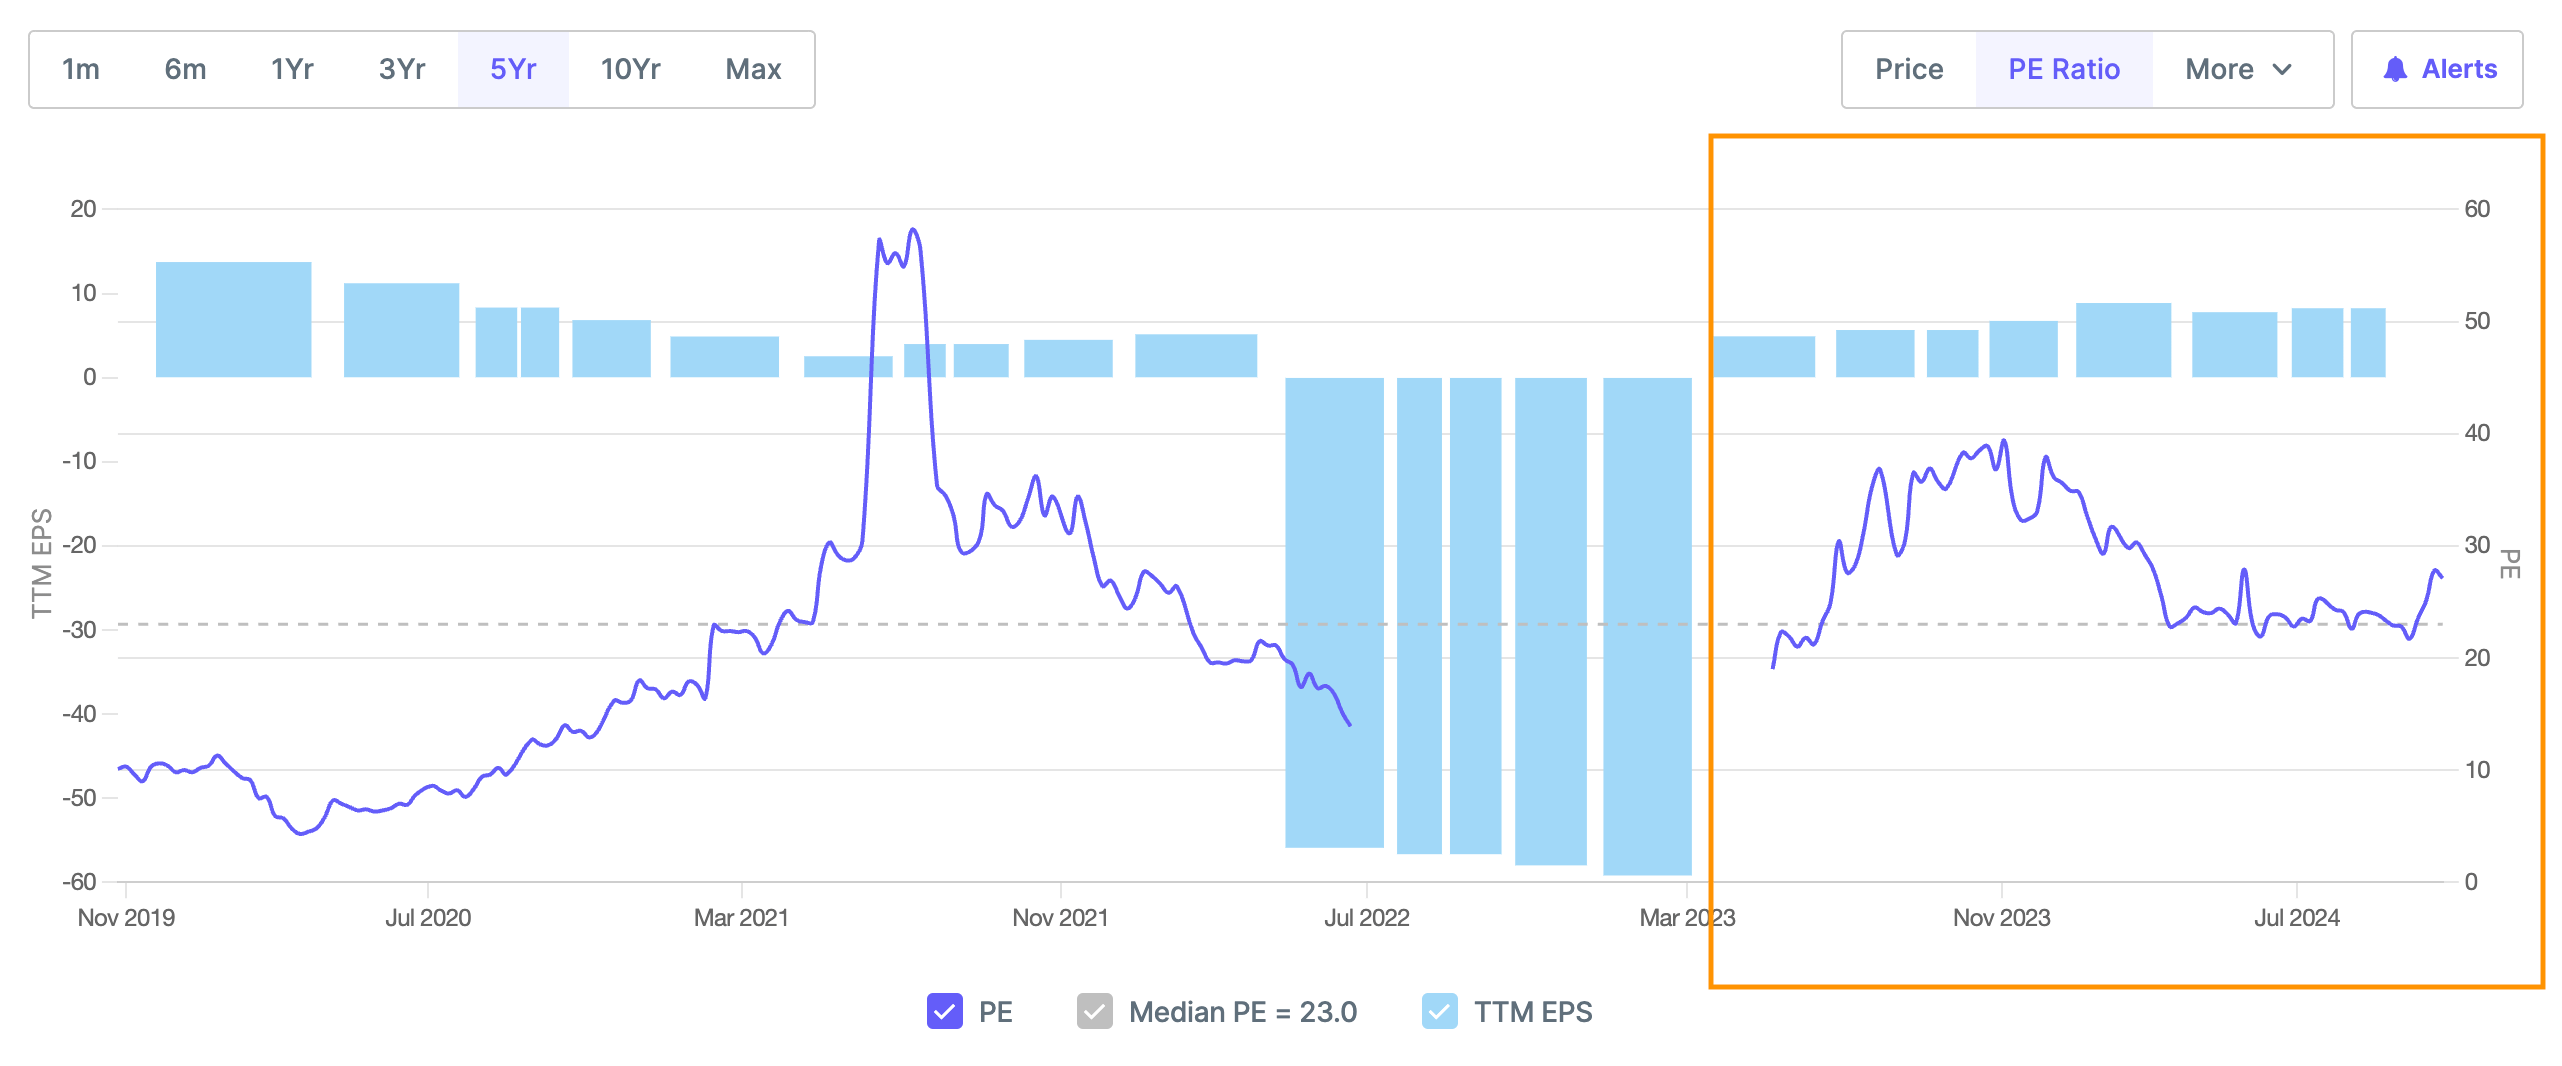
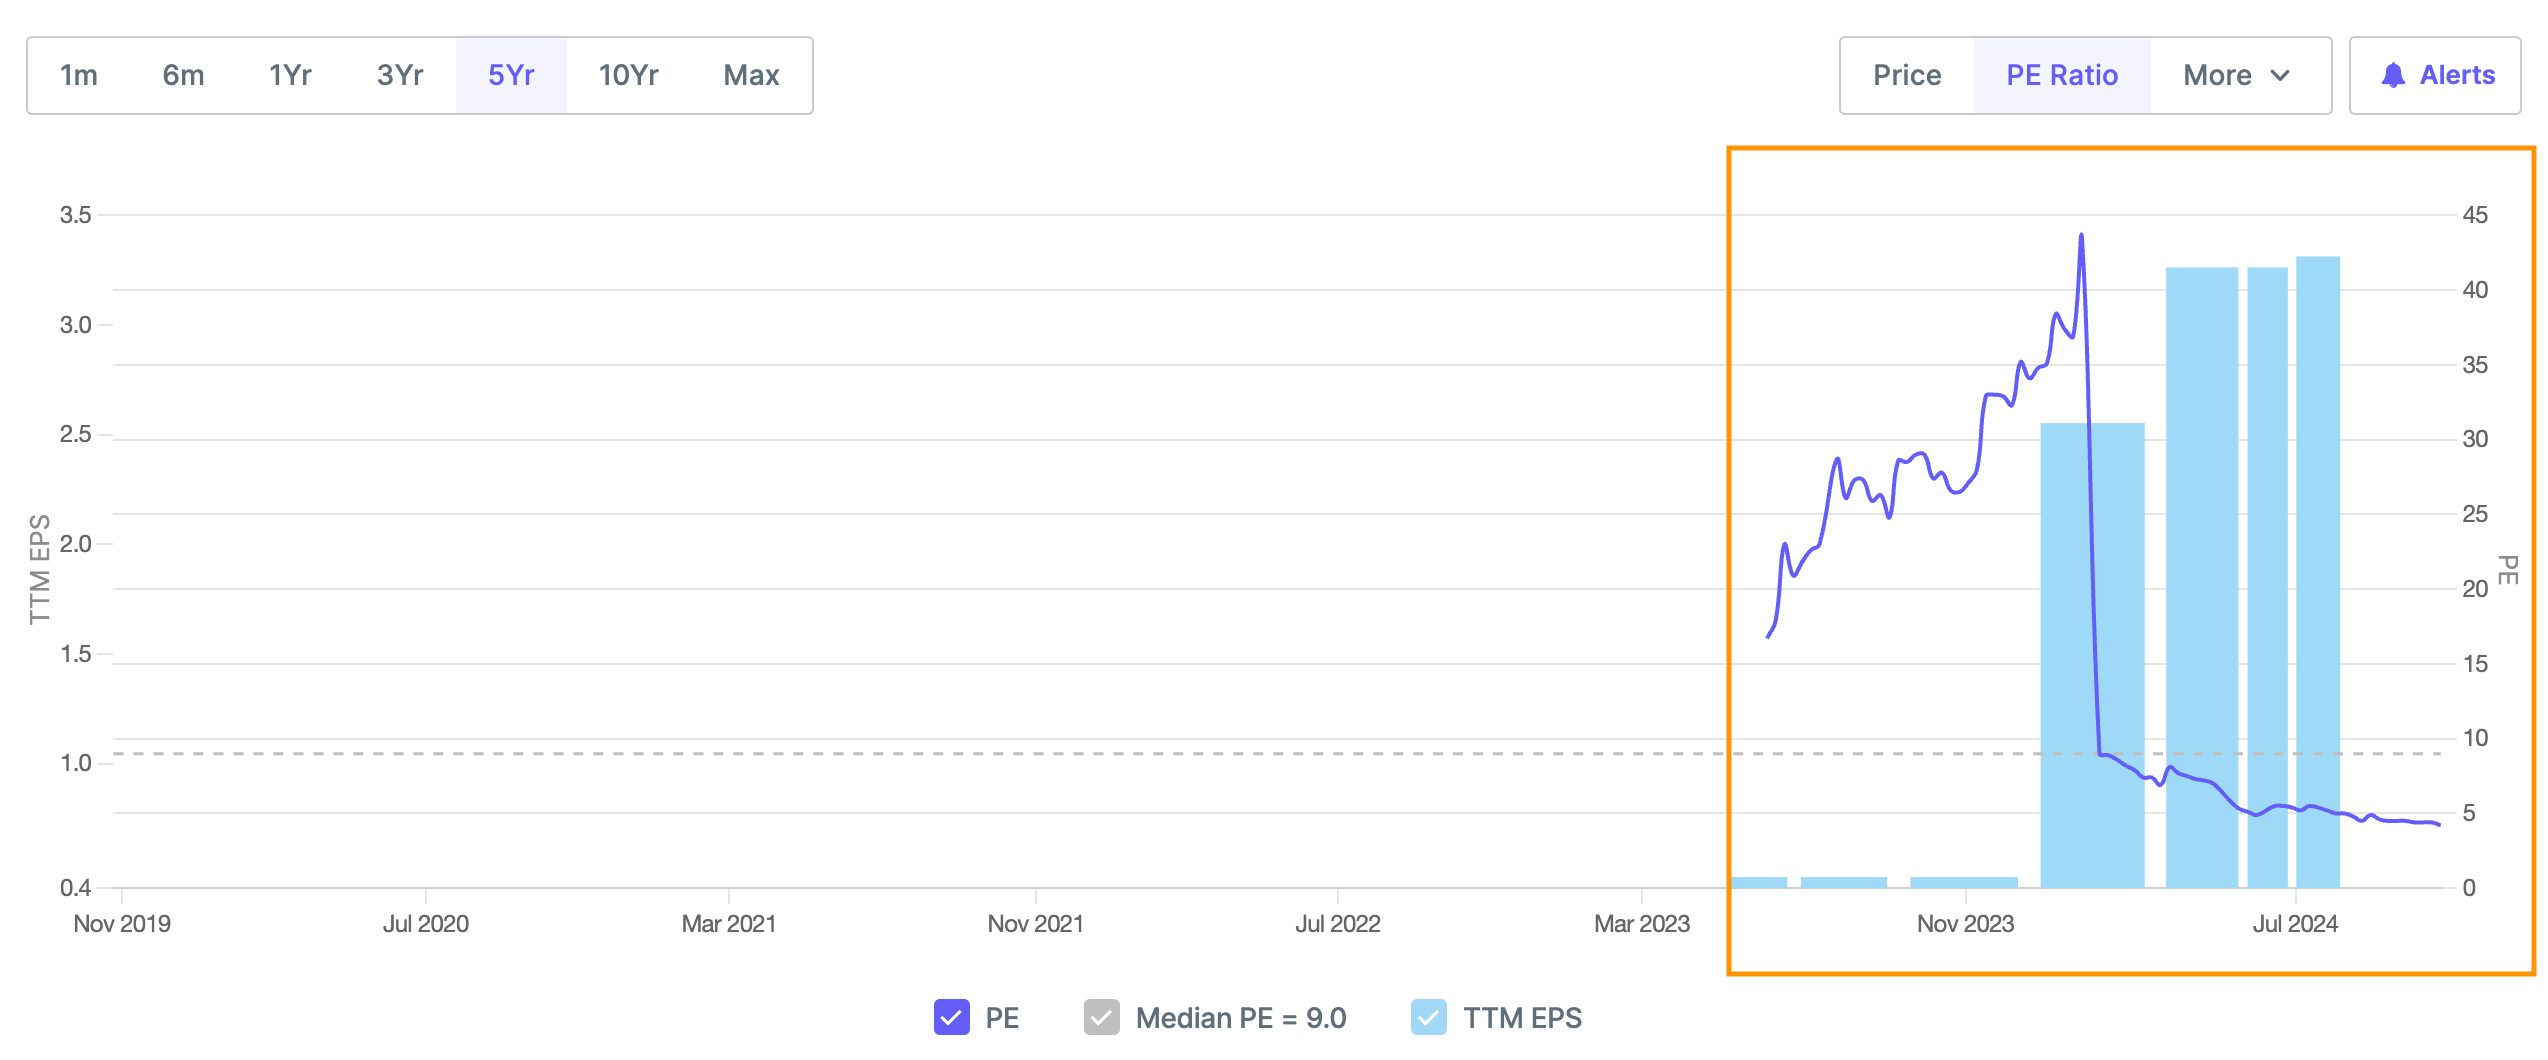
Valuations and EPS - Below chart shows TTM EPS has grown much faster than Price from Dec 2023 leading to a PE derating from 40 to 5
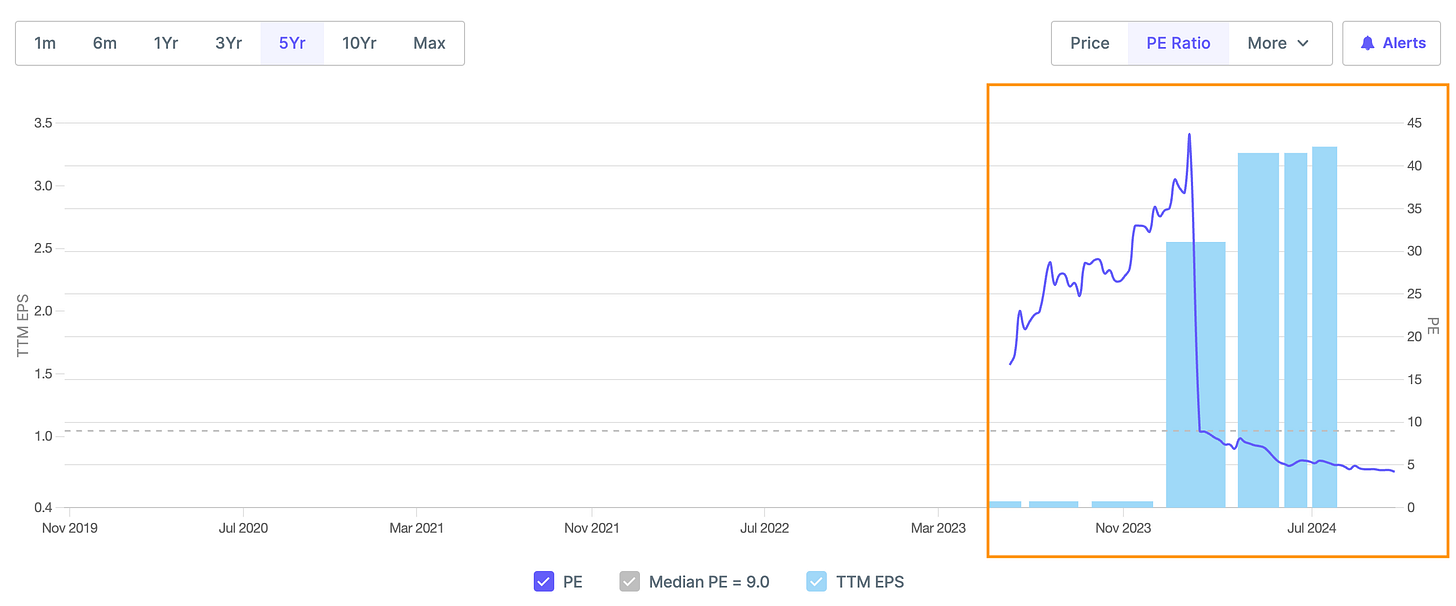
PE below historical average of 4
TTM EPS (EPS of Last 4 quarters) - Growing massively QoQ since Dec 2023
What led to outperformance
No concalls published
The next 2 sectors that we will be covering will be
Chemicals
Pesticides / Agrochemicals - Indian