


Disclaimer - We are not SEBI registered !! Nothing that you will read below is investment advice. We are sharing “High Performing stocks that are Undervalued” based on Q1’25 performance in Pharma (Bulk drugs and Formulations) Sector with you, for you to do deeper research.
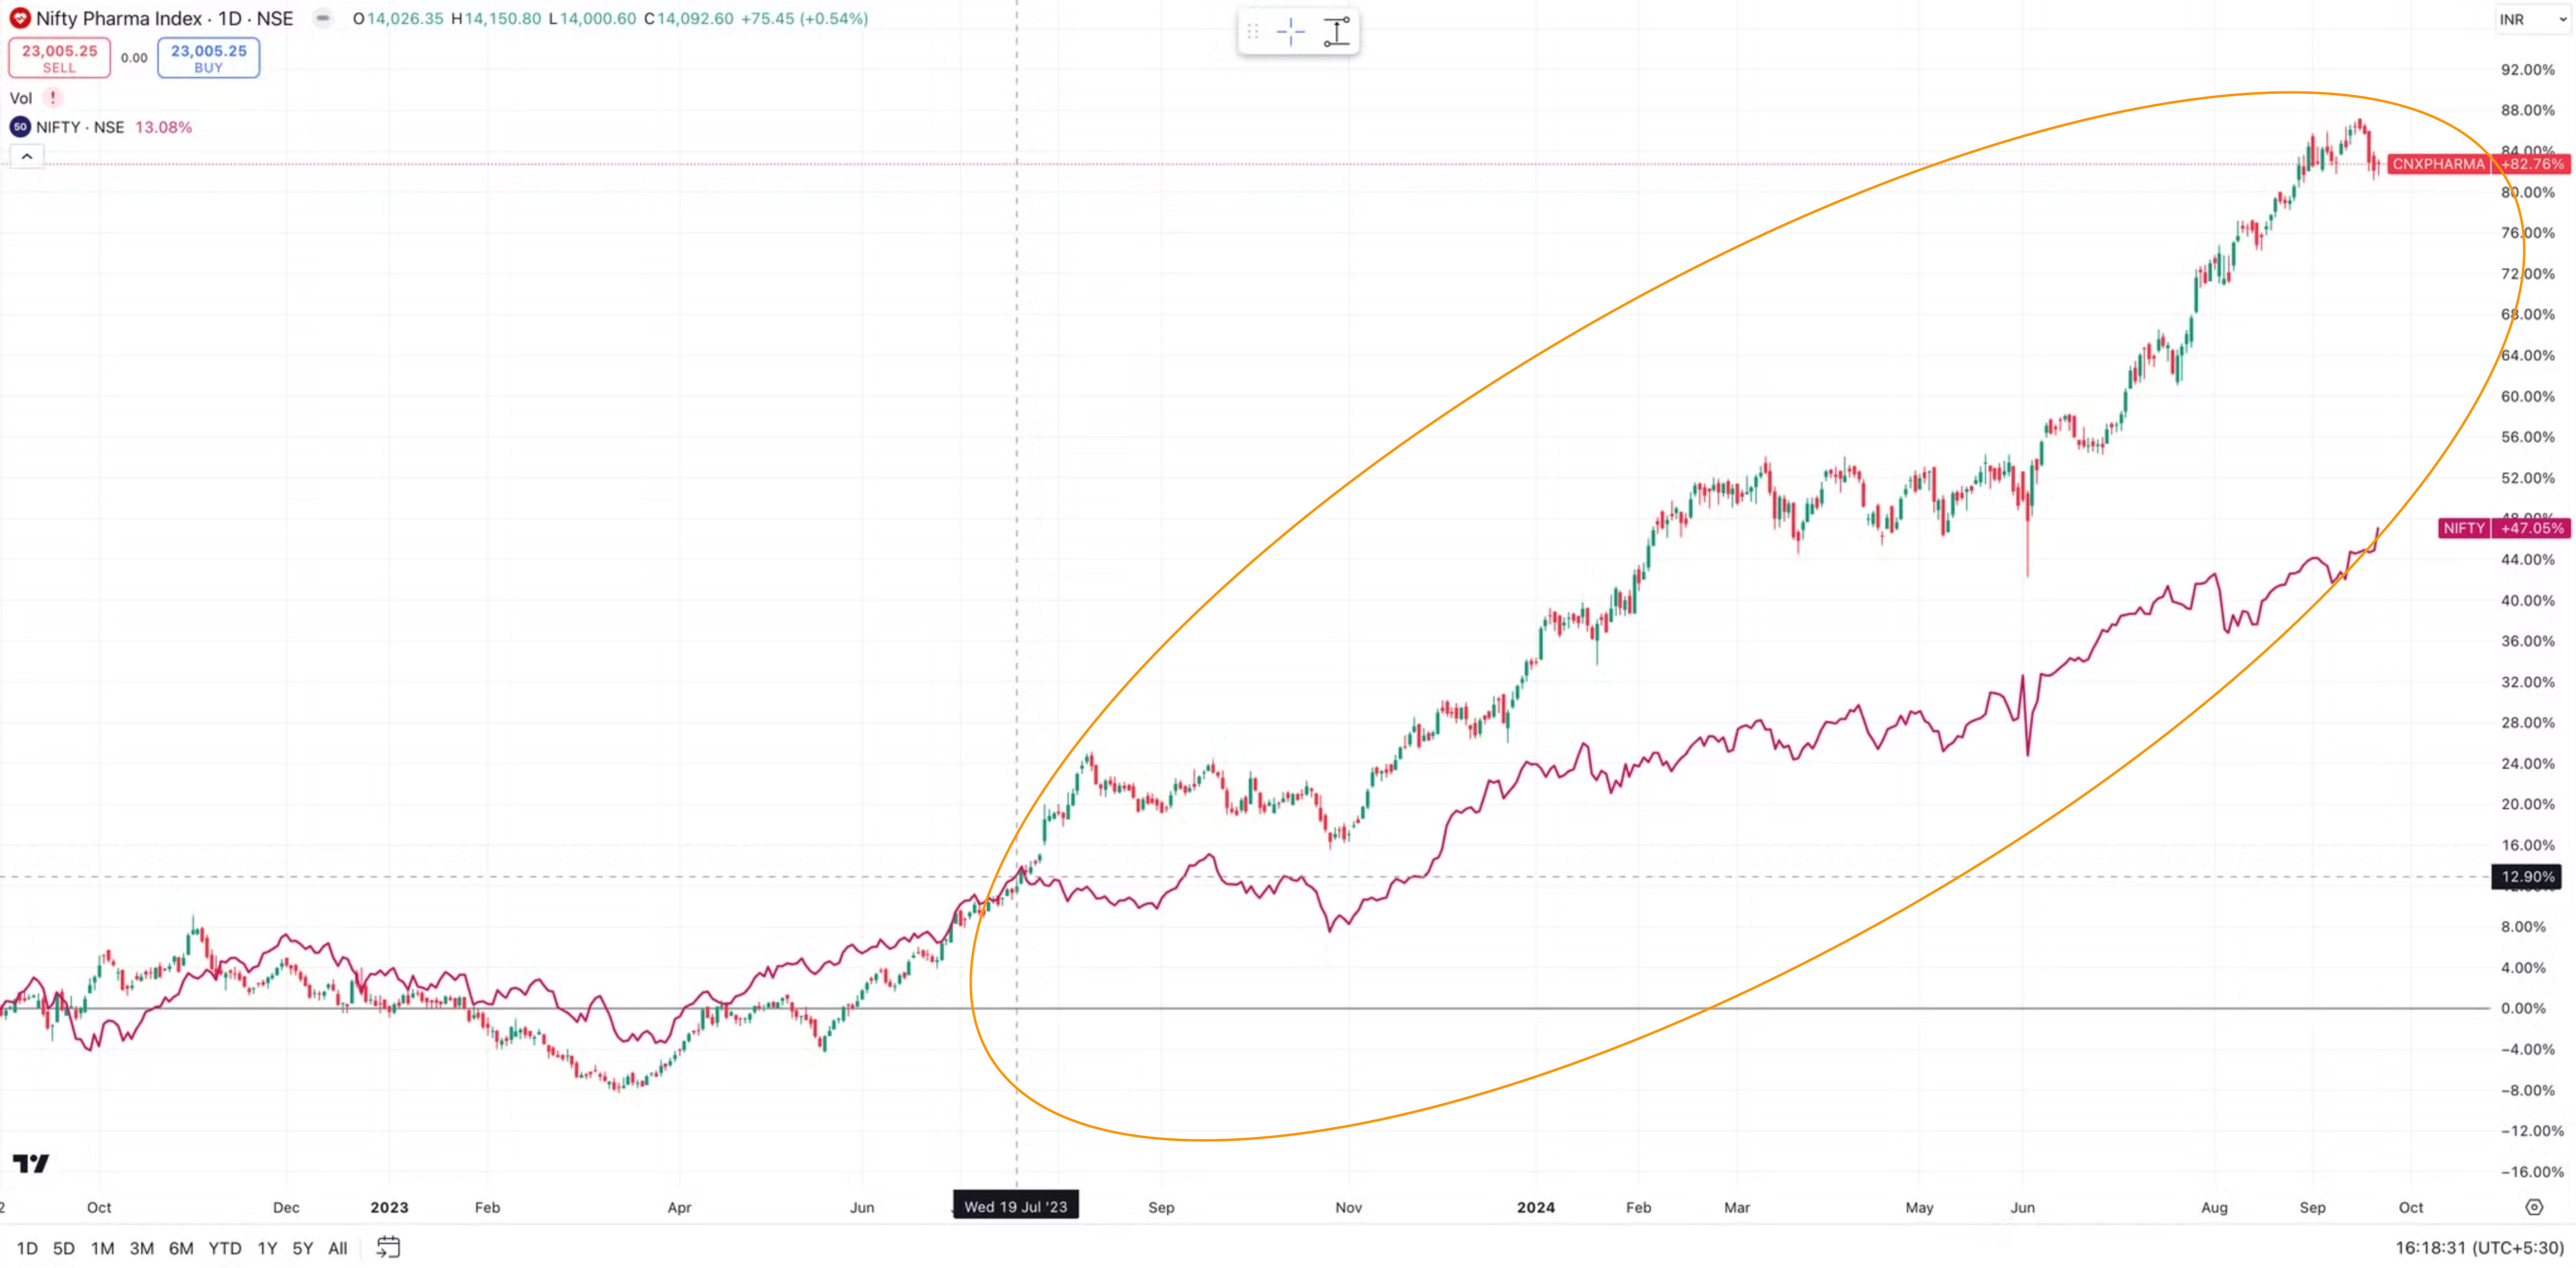
NIFTY Pharma Returns as compared to NIFTY
If we see returns for the last 2 years, NIFTY Pharma started outperforming NIFTY since July 23 and since Sept 22 has given returns of 82% vs NIFTY 47%
What is happening fundamentally in Pharma (Bulk Drugs and Formulations) in Q1 25 i.e. from April 24 to June 24
When multiple companies in a sector show Increase in Sales and OPM in a quarter… it usually indicates that there are strong tailwinds in the sector. This generally results in multiple companies in that sector out performing Fundamentally and Price wise.
For Pharma (Bulk Drugs and Formulations) - Out of 46 Companies over the market cap of 1000 Cr
20 Companies grew their Sales and Profits by 5% Quarter on Quarter in Q1 25 i.e. compared with Q4 2024
6 Companies grew their Sales and Profits by 15% Year on Year i.e. compared with Q1 2024
Also you will notice that for most of the companies mentioned below (The 10 Best performing Pharma stocks that are undervalued) -
All 4 metrics
Revenue per quarter
Gross Profit Margin per quarter
Operating Profit Margin per quarter
Net Profit Margin per quarter
Started improving around Q4 2023 i.e. from Jan 23 to March 23
That is the same time we saw the Price of these companies also starting to move upwards with Company fundamentals
The reasons for the above fundamental outperformance (sector Tailwinds) are -
Strong US market growth driven by complex generics and specialty products
Expanding biosimilars pipeline and increasing launches in regulated markets
Growing opportunities in emerging markets, diversifying revenue streams
Improving profitability through better product mix and operational efficiencies
Increasing CDMO/CMO business opportunities, particularly in the global context
Check out the last section of the newsletter to see which sectors will we cover next…
10 Undervalued Pharma Stocks that were the Best Performers listed by Decreasing Market Cap
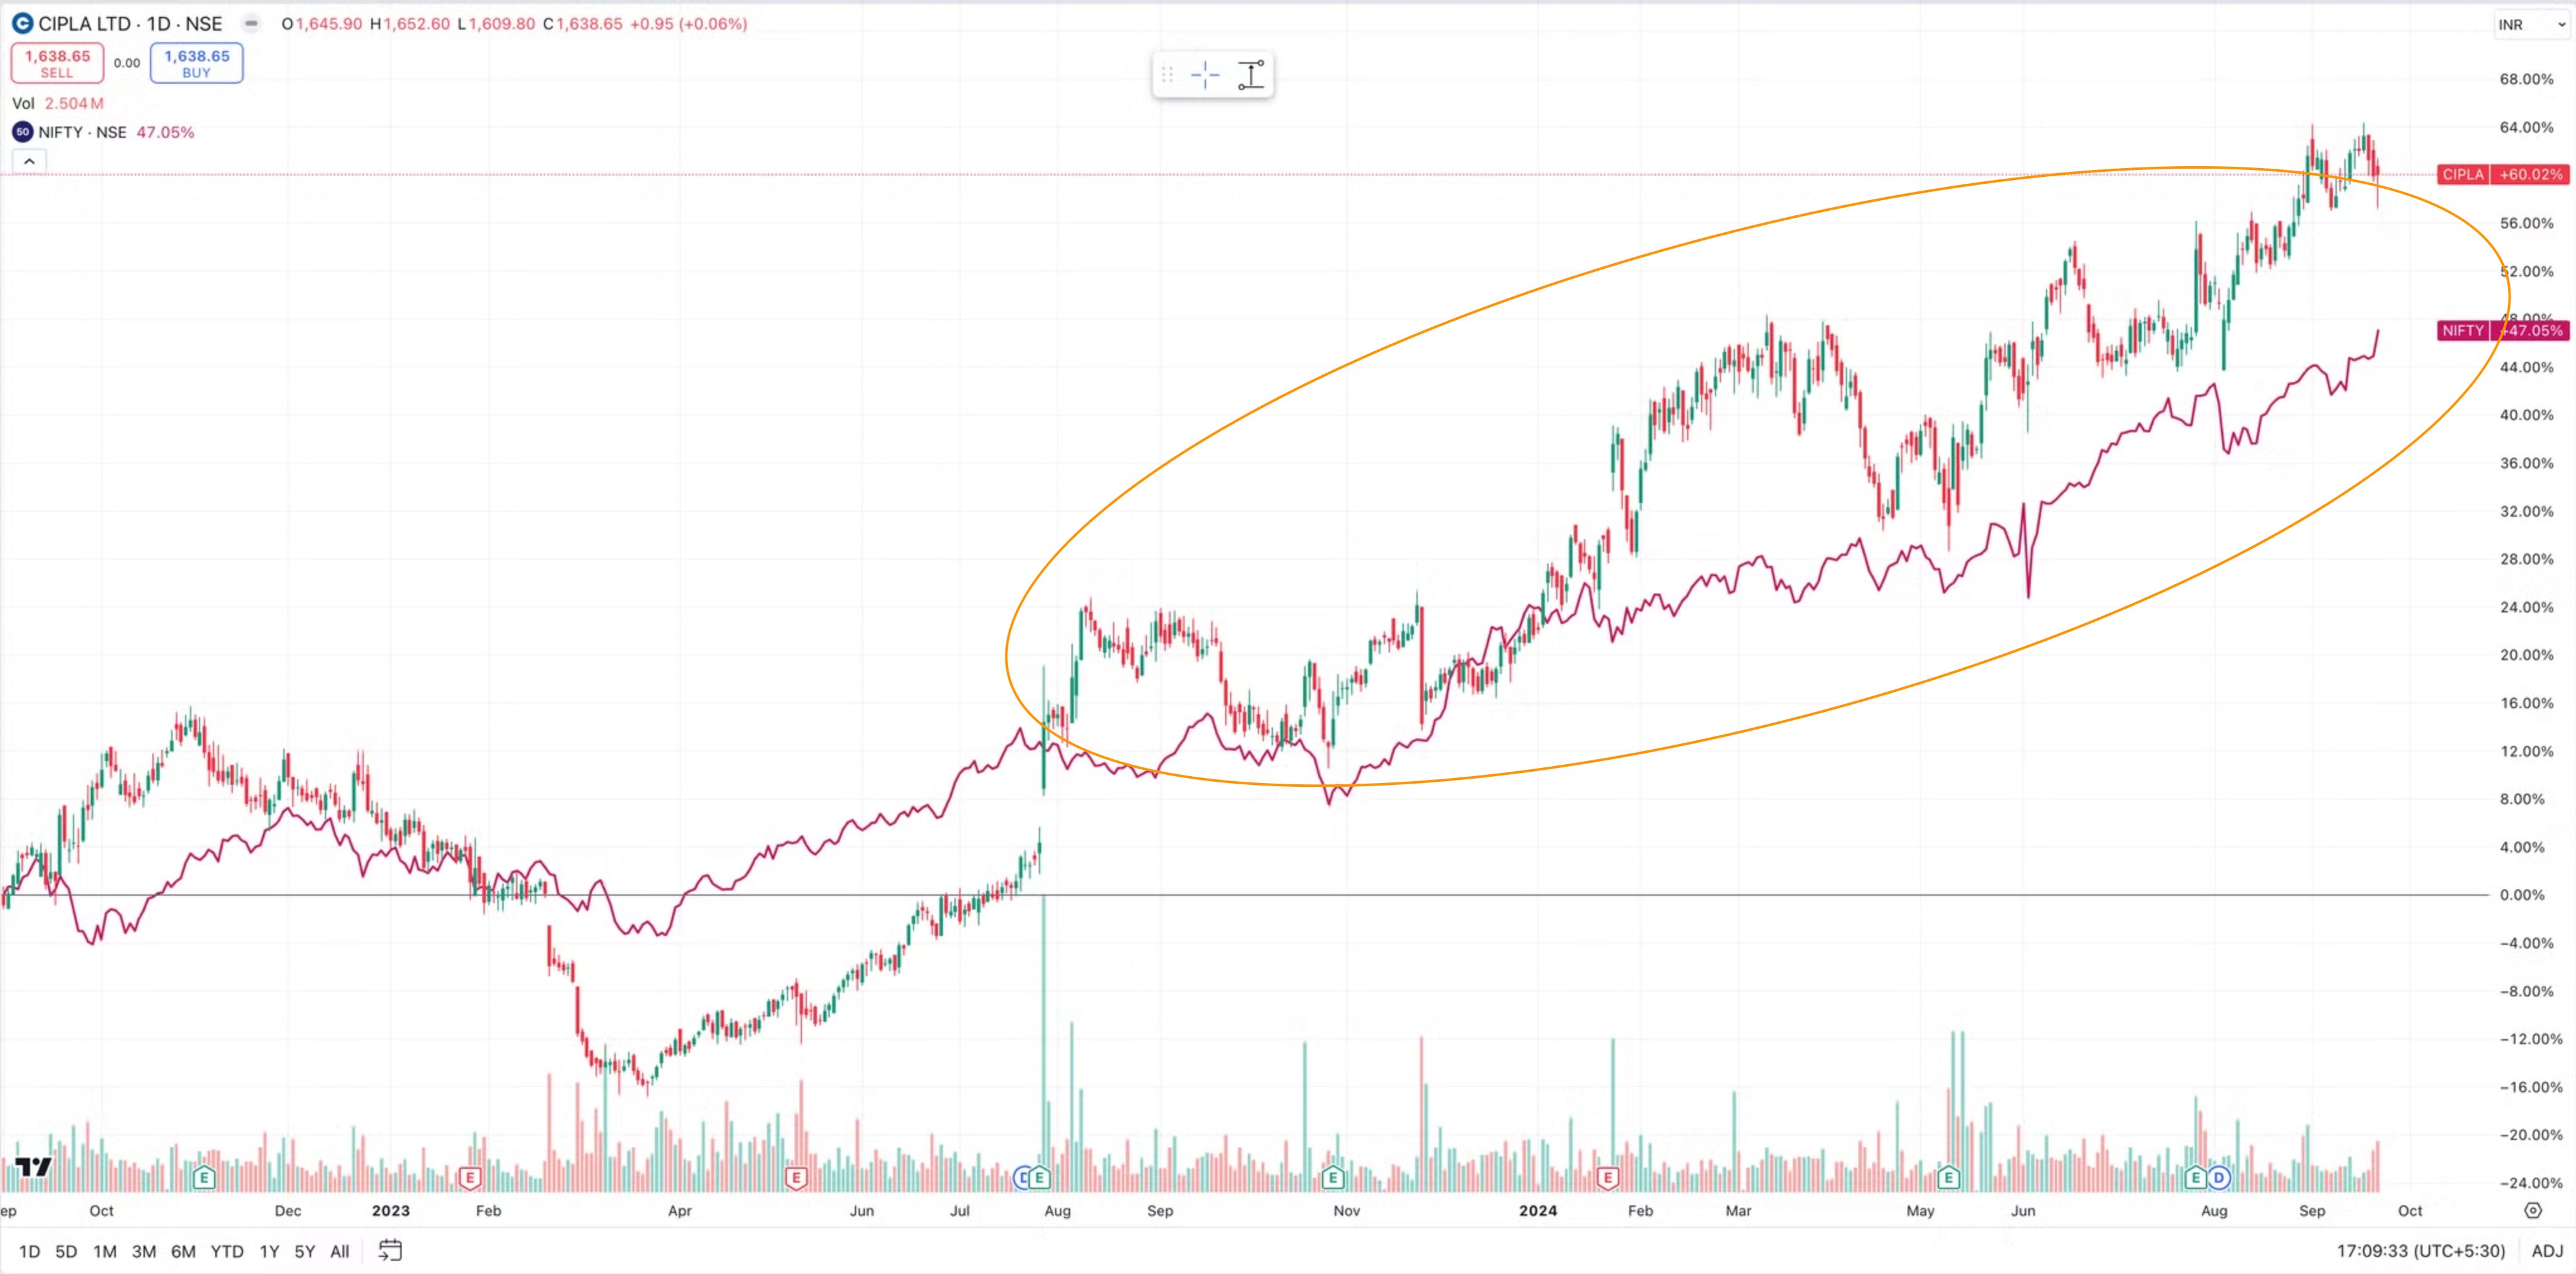
Cipla - Market Cap 1,30,000+ Cr
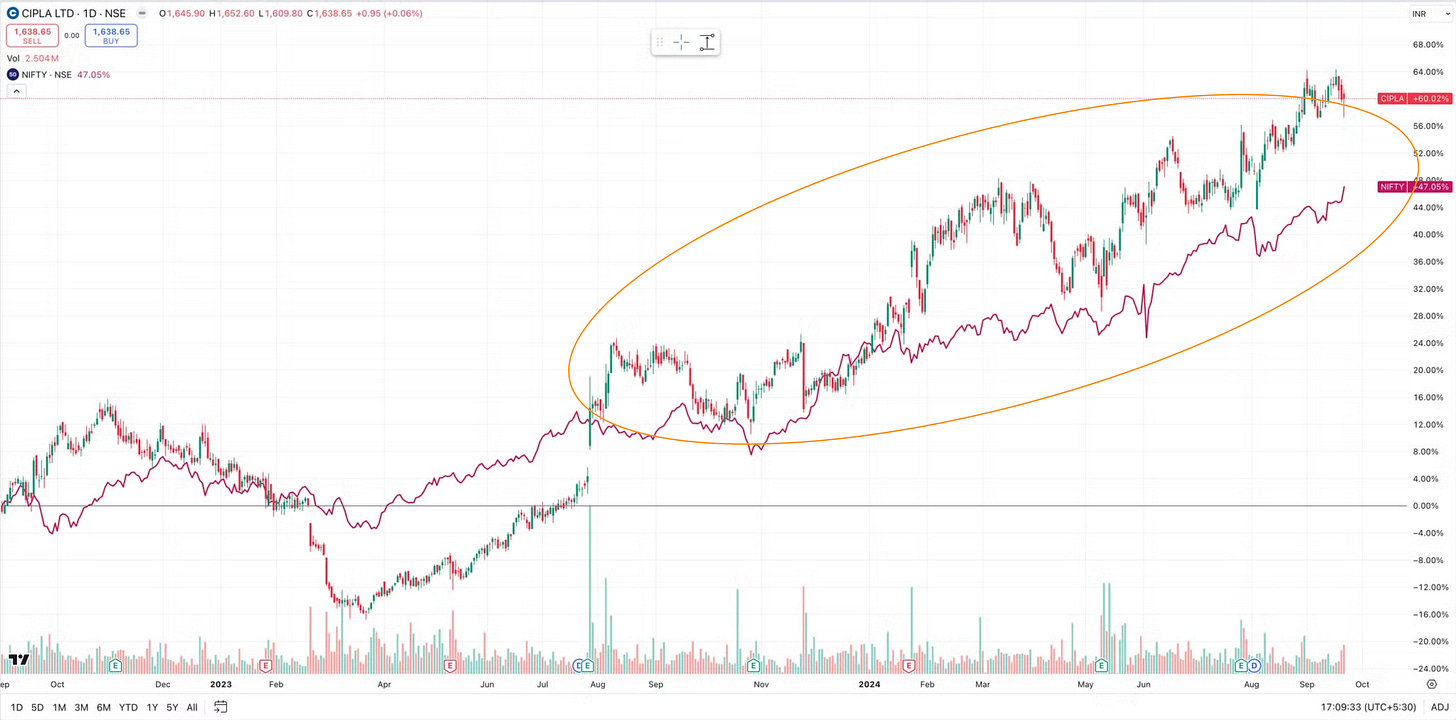
Price Action - Since Sept 22, CIPLA - 60%, NIFTY 46%
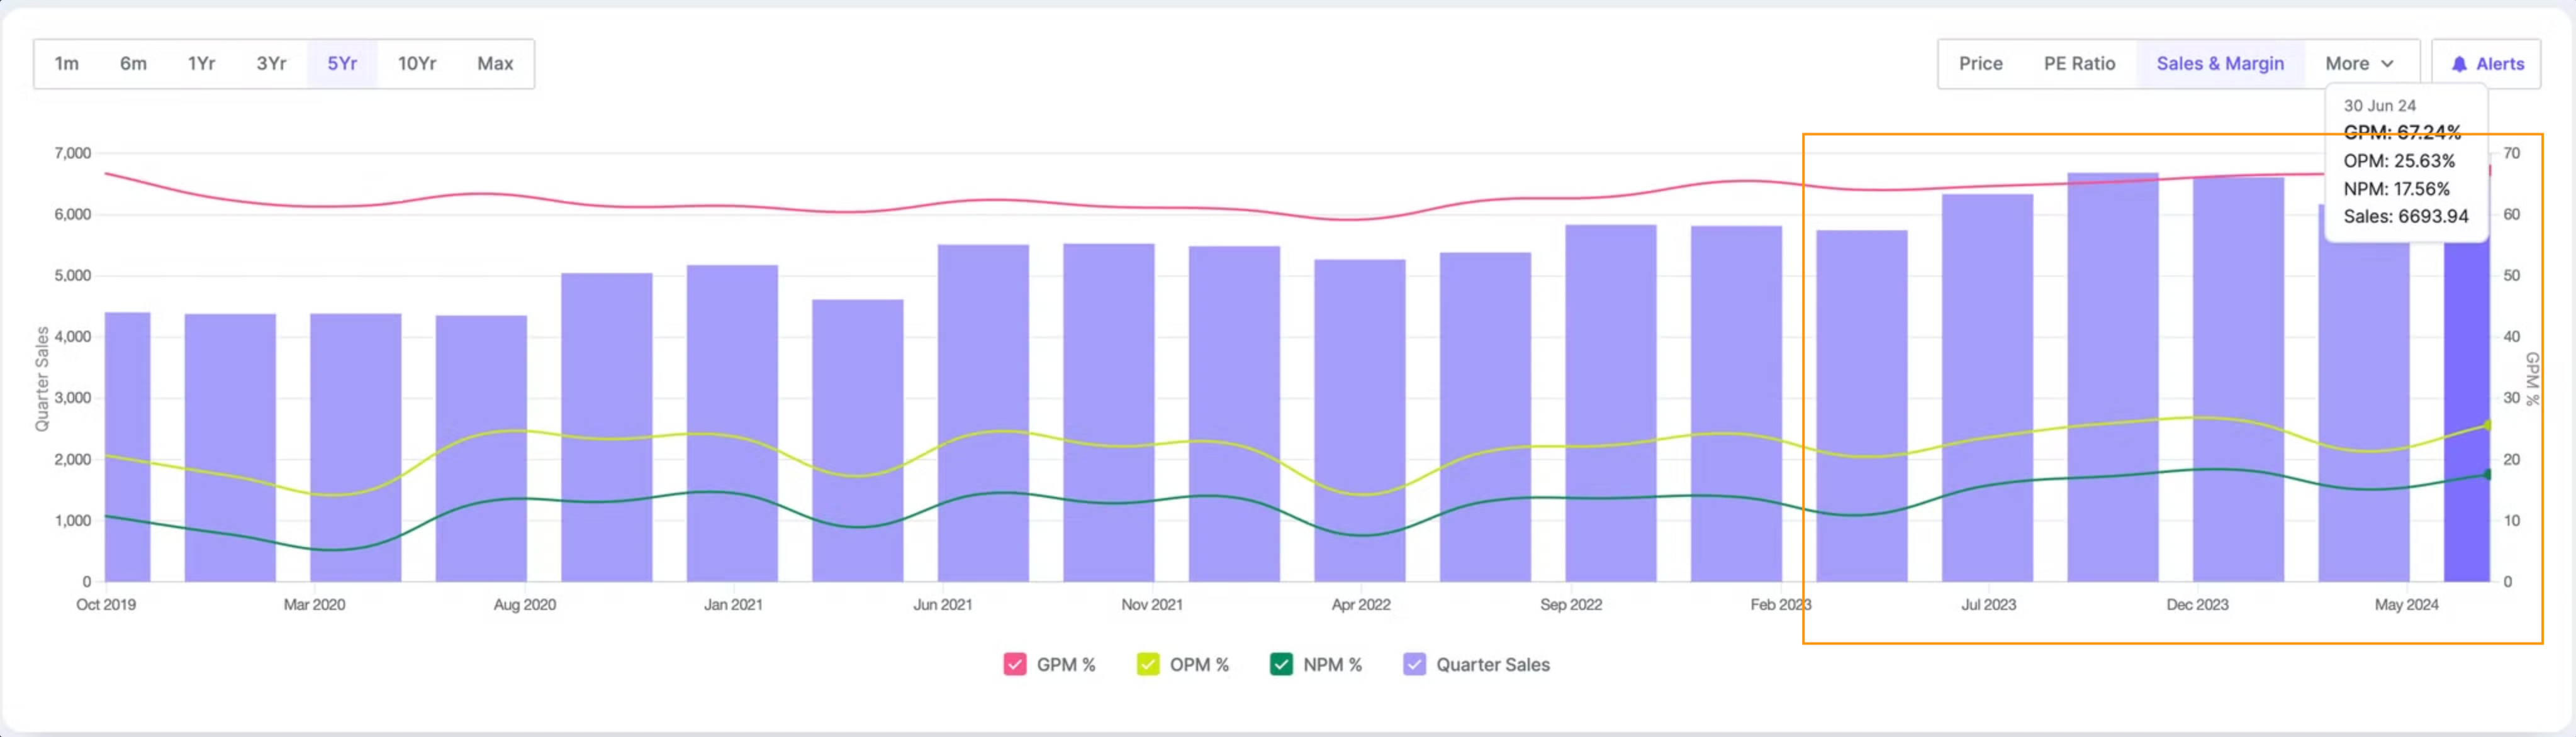
Operational metrics performance - Below chart shows Revenue, Gross, Operating and Net Profit Margin improving quarterly since Feb 2023
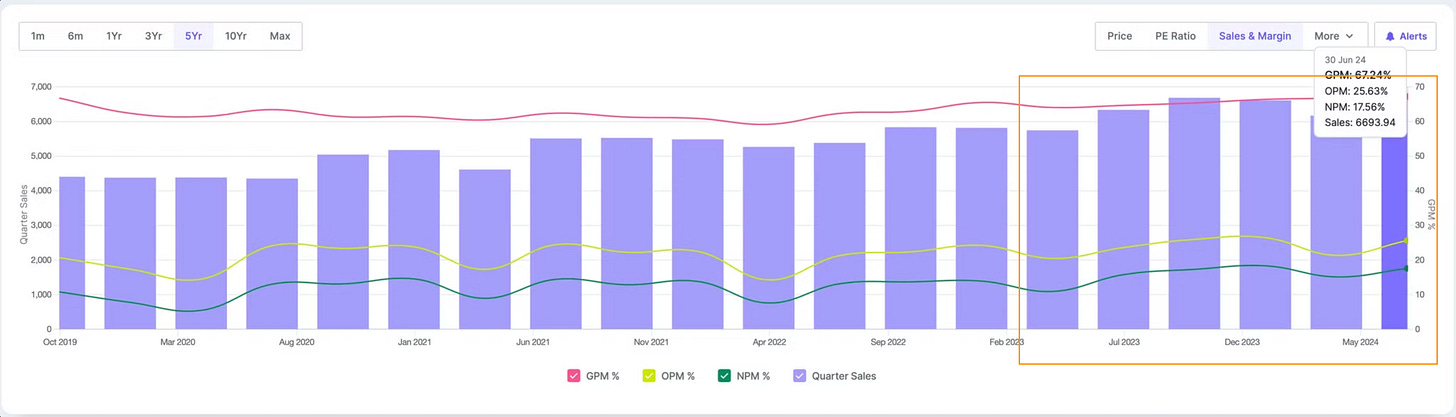
Q1 25 results (QoQ Increase) - Sales increased by 9% and Profits increased by 16%
Q1 25 results (YoY increase) - Sales increased by 6% and Profits increased by 9%
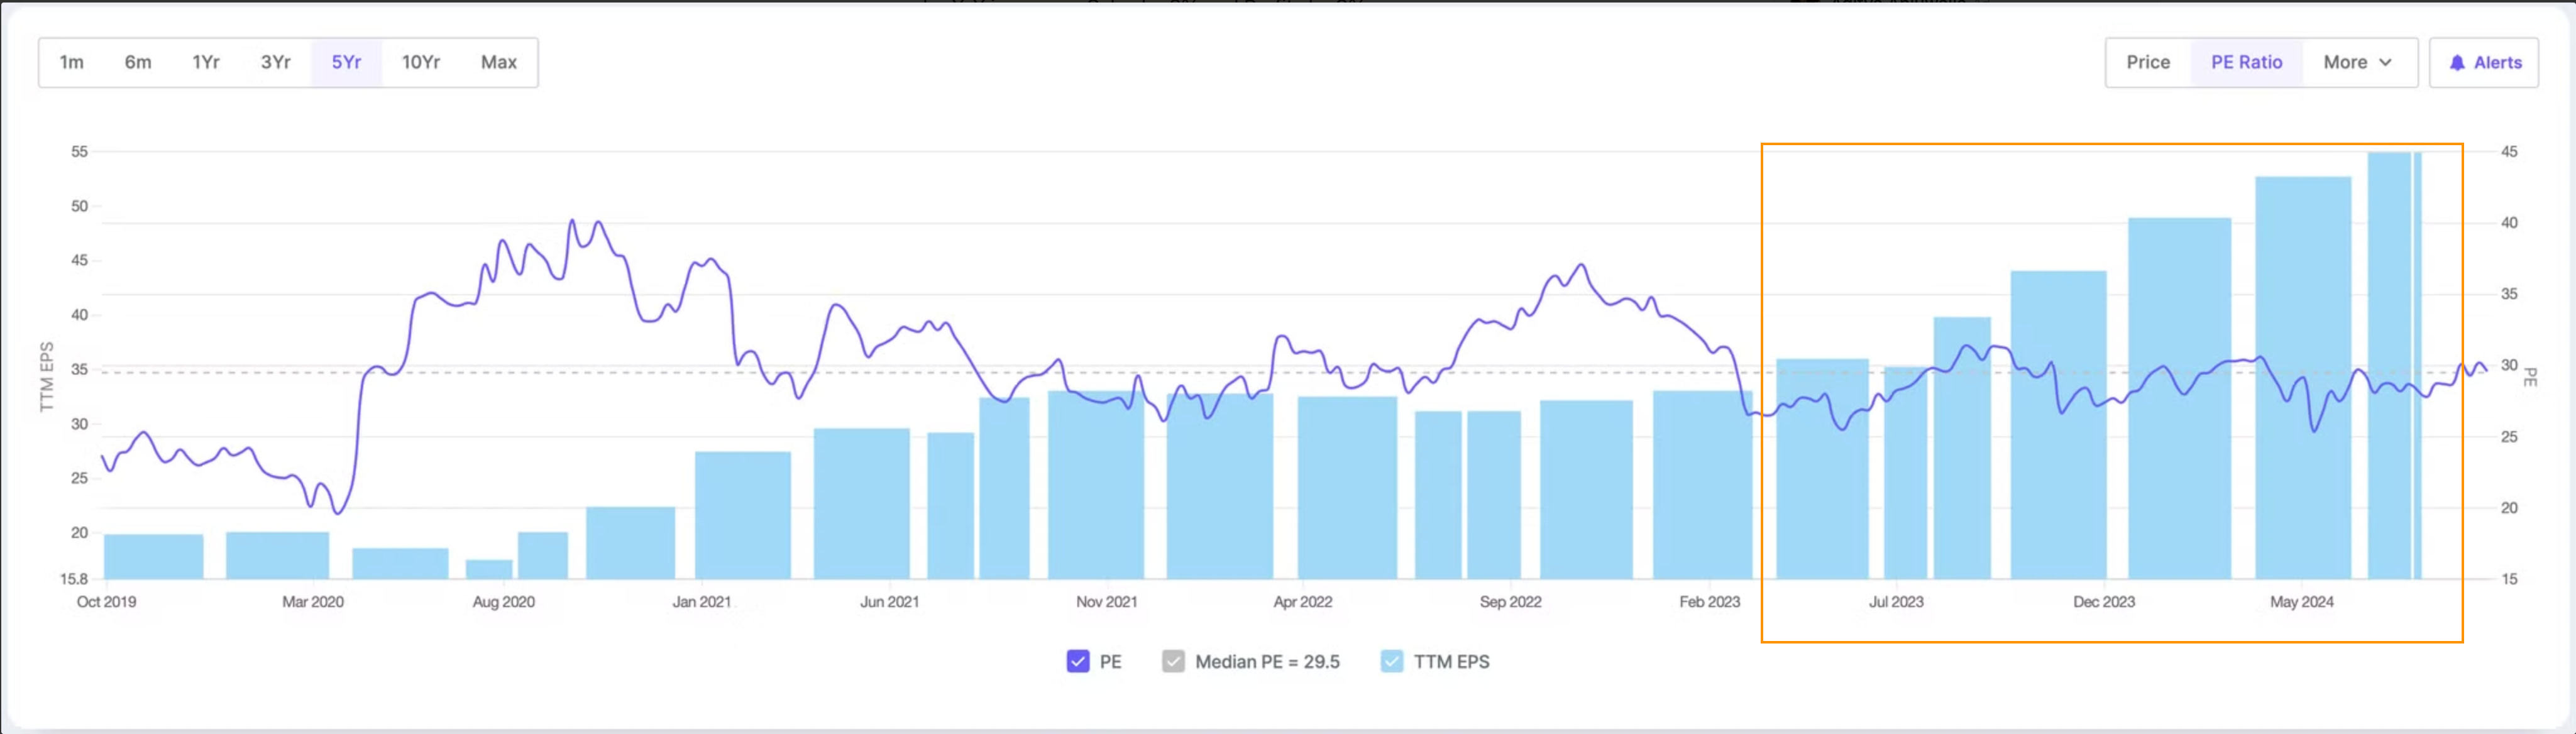
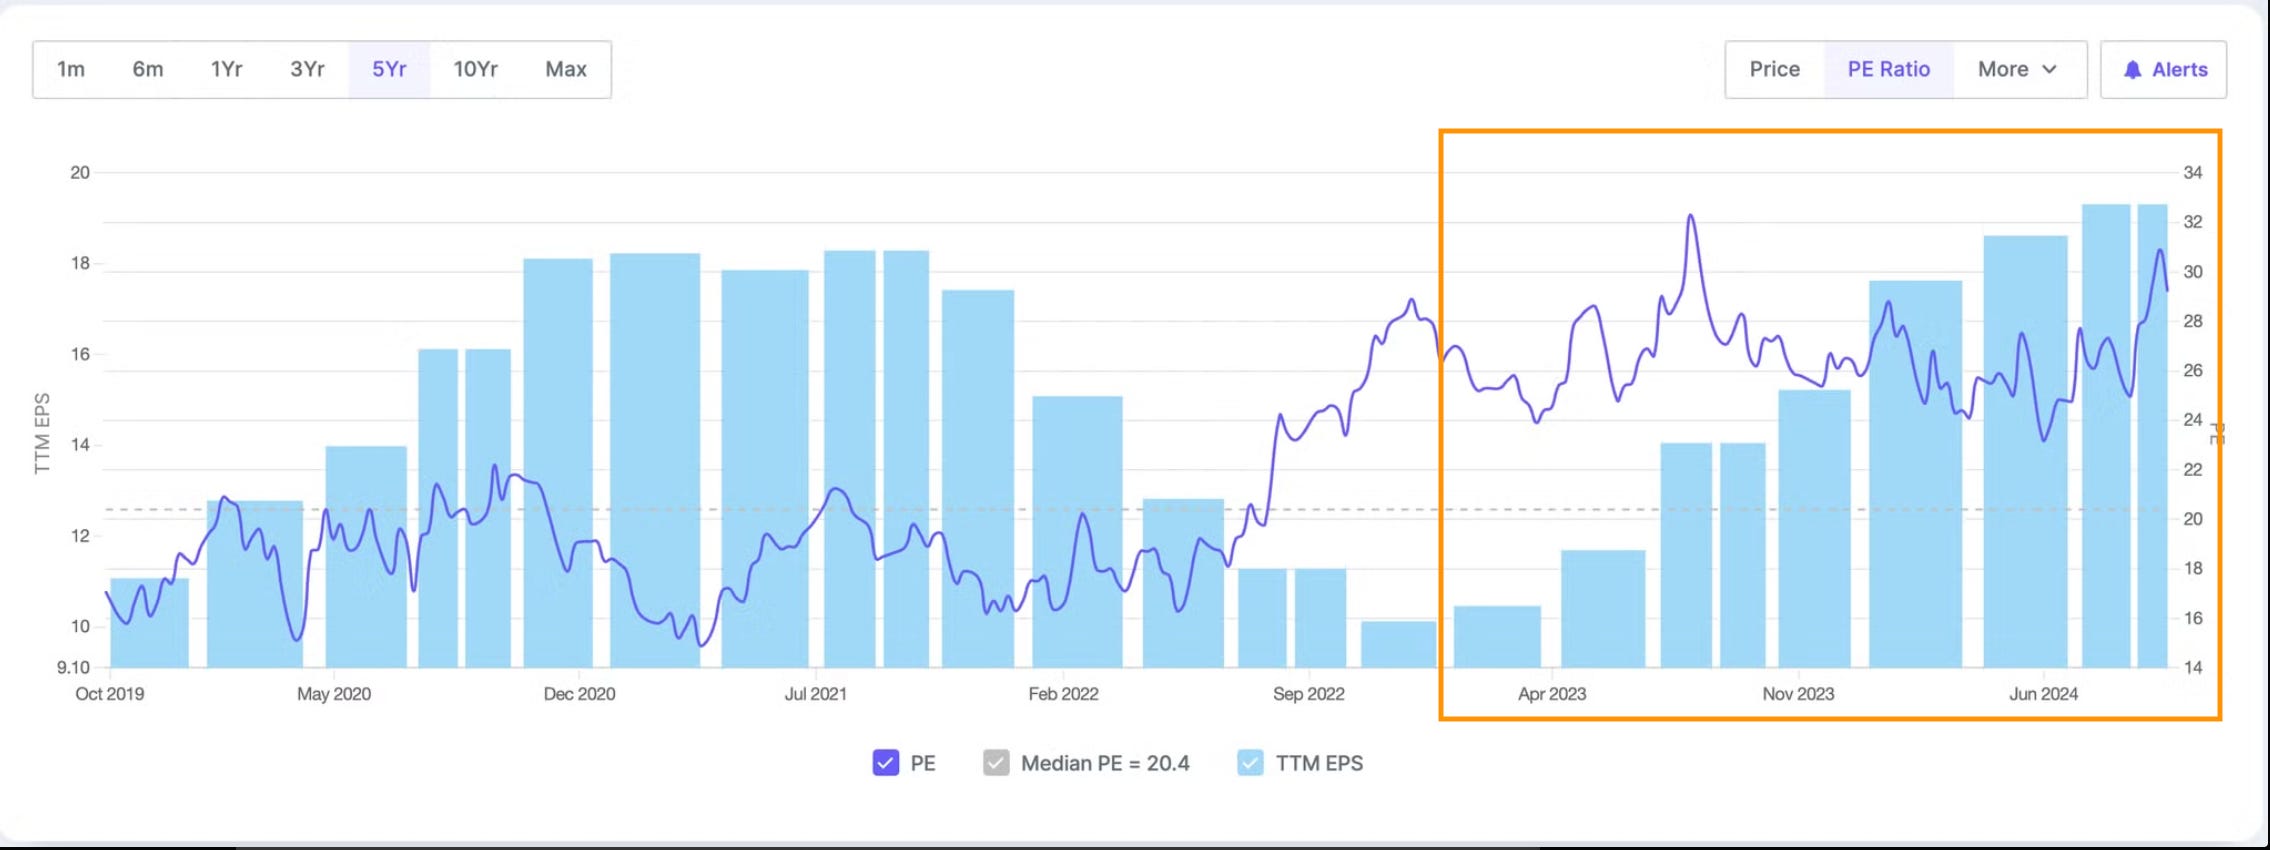
Valuations and EPS - Below chart shows Price and TTM EPS (EPS of last 4 quarters) have grown at the same speed since March 23 leading to valuations consistent at 30 PE
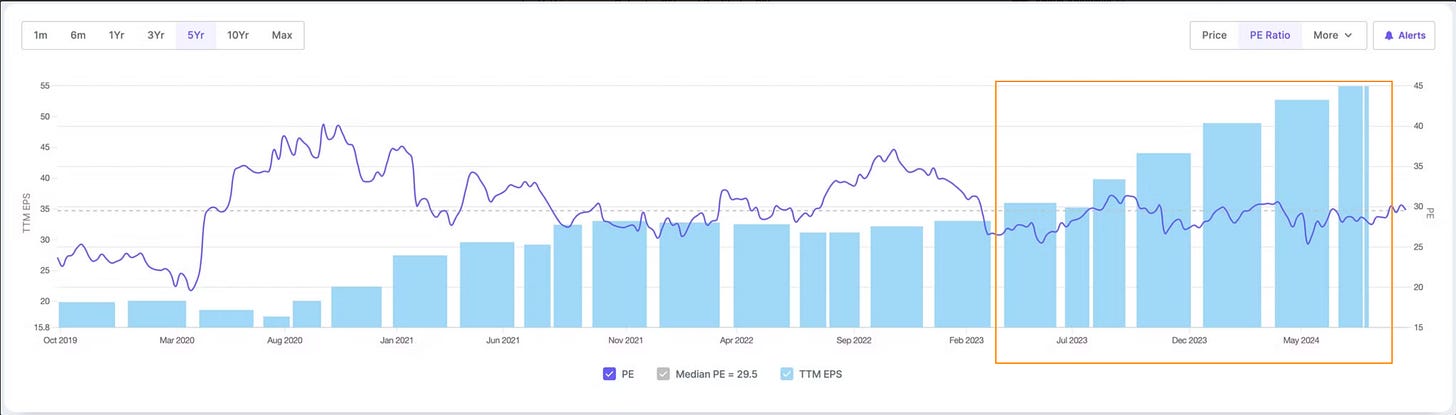
PE consistent at 30 i.e. historical average
TTM EPS (EPS of Last 4 quarters) - Growing consistently QoQ since Dec 2022
What led to outperformance
US Business -
North America reached all-time high quarterly revenue of $250 million, up 13% YoY
India Business
Branded prescription business grew 10% YoY
Gross Margin
Improved to 67.2%, up 226 basis points YoY due to better product mix
R&D Expenses
Currently at 5.3% of revenue, lower than usual
Product Portfolio
Launched generic version of Lanreotide injection; Albuterol market share increased to 17%
Manufacturing & Regulatory
Patalganga and Kurkumbh facilities classified as VAI by US FDA
Future Pipeline
Multiple peptide launches planned in coming quarters
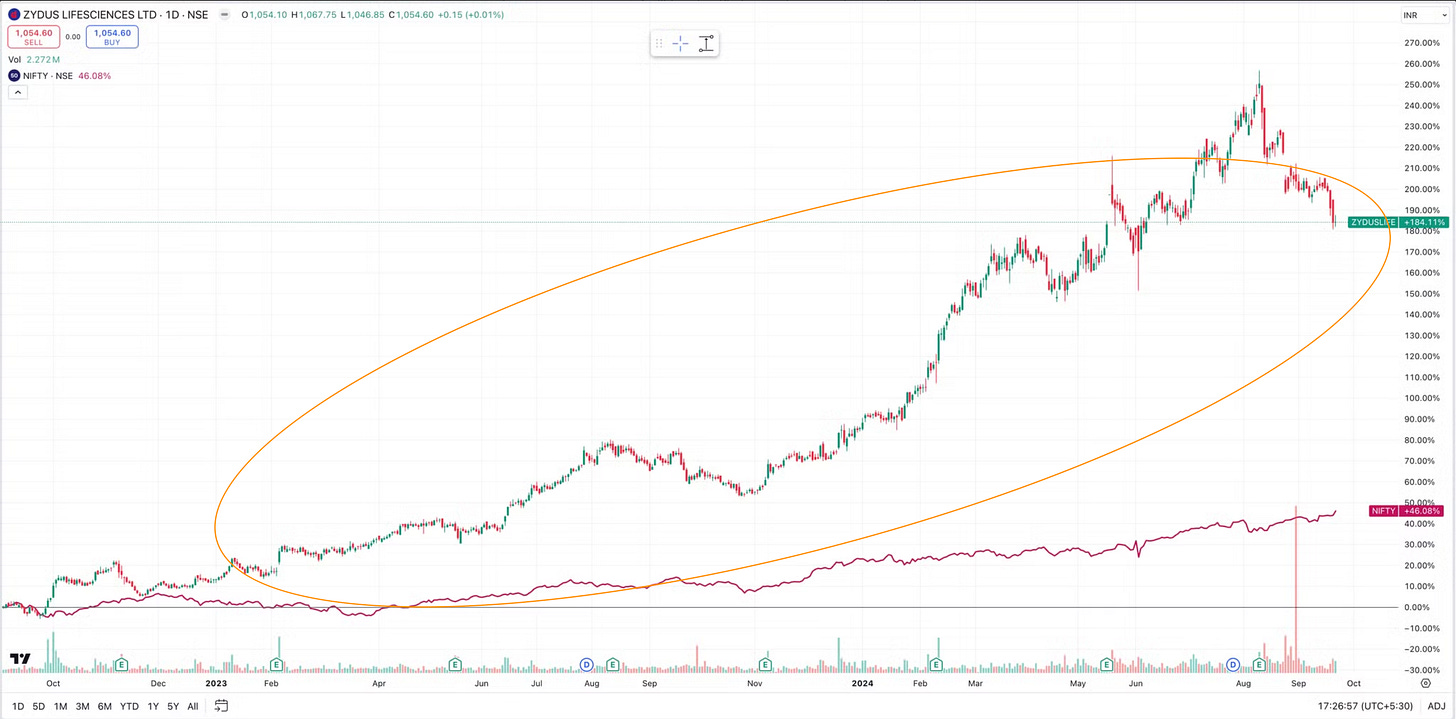
Zydus Lifesciences - Market cap 1,06,000+ Cr
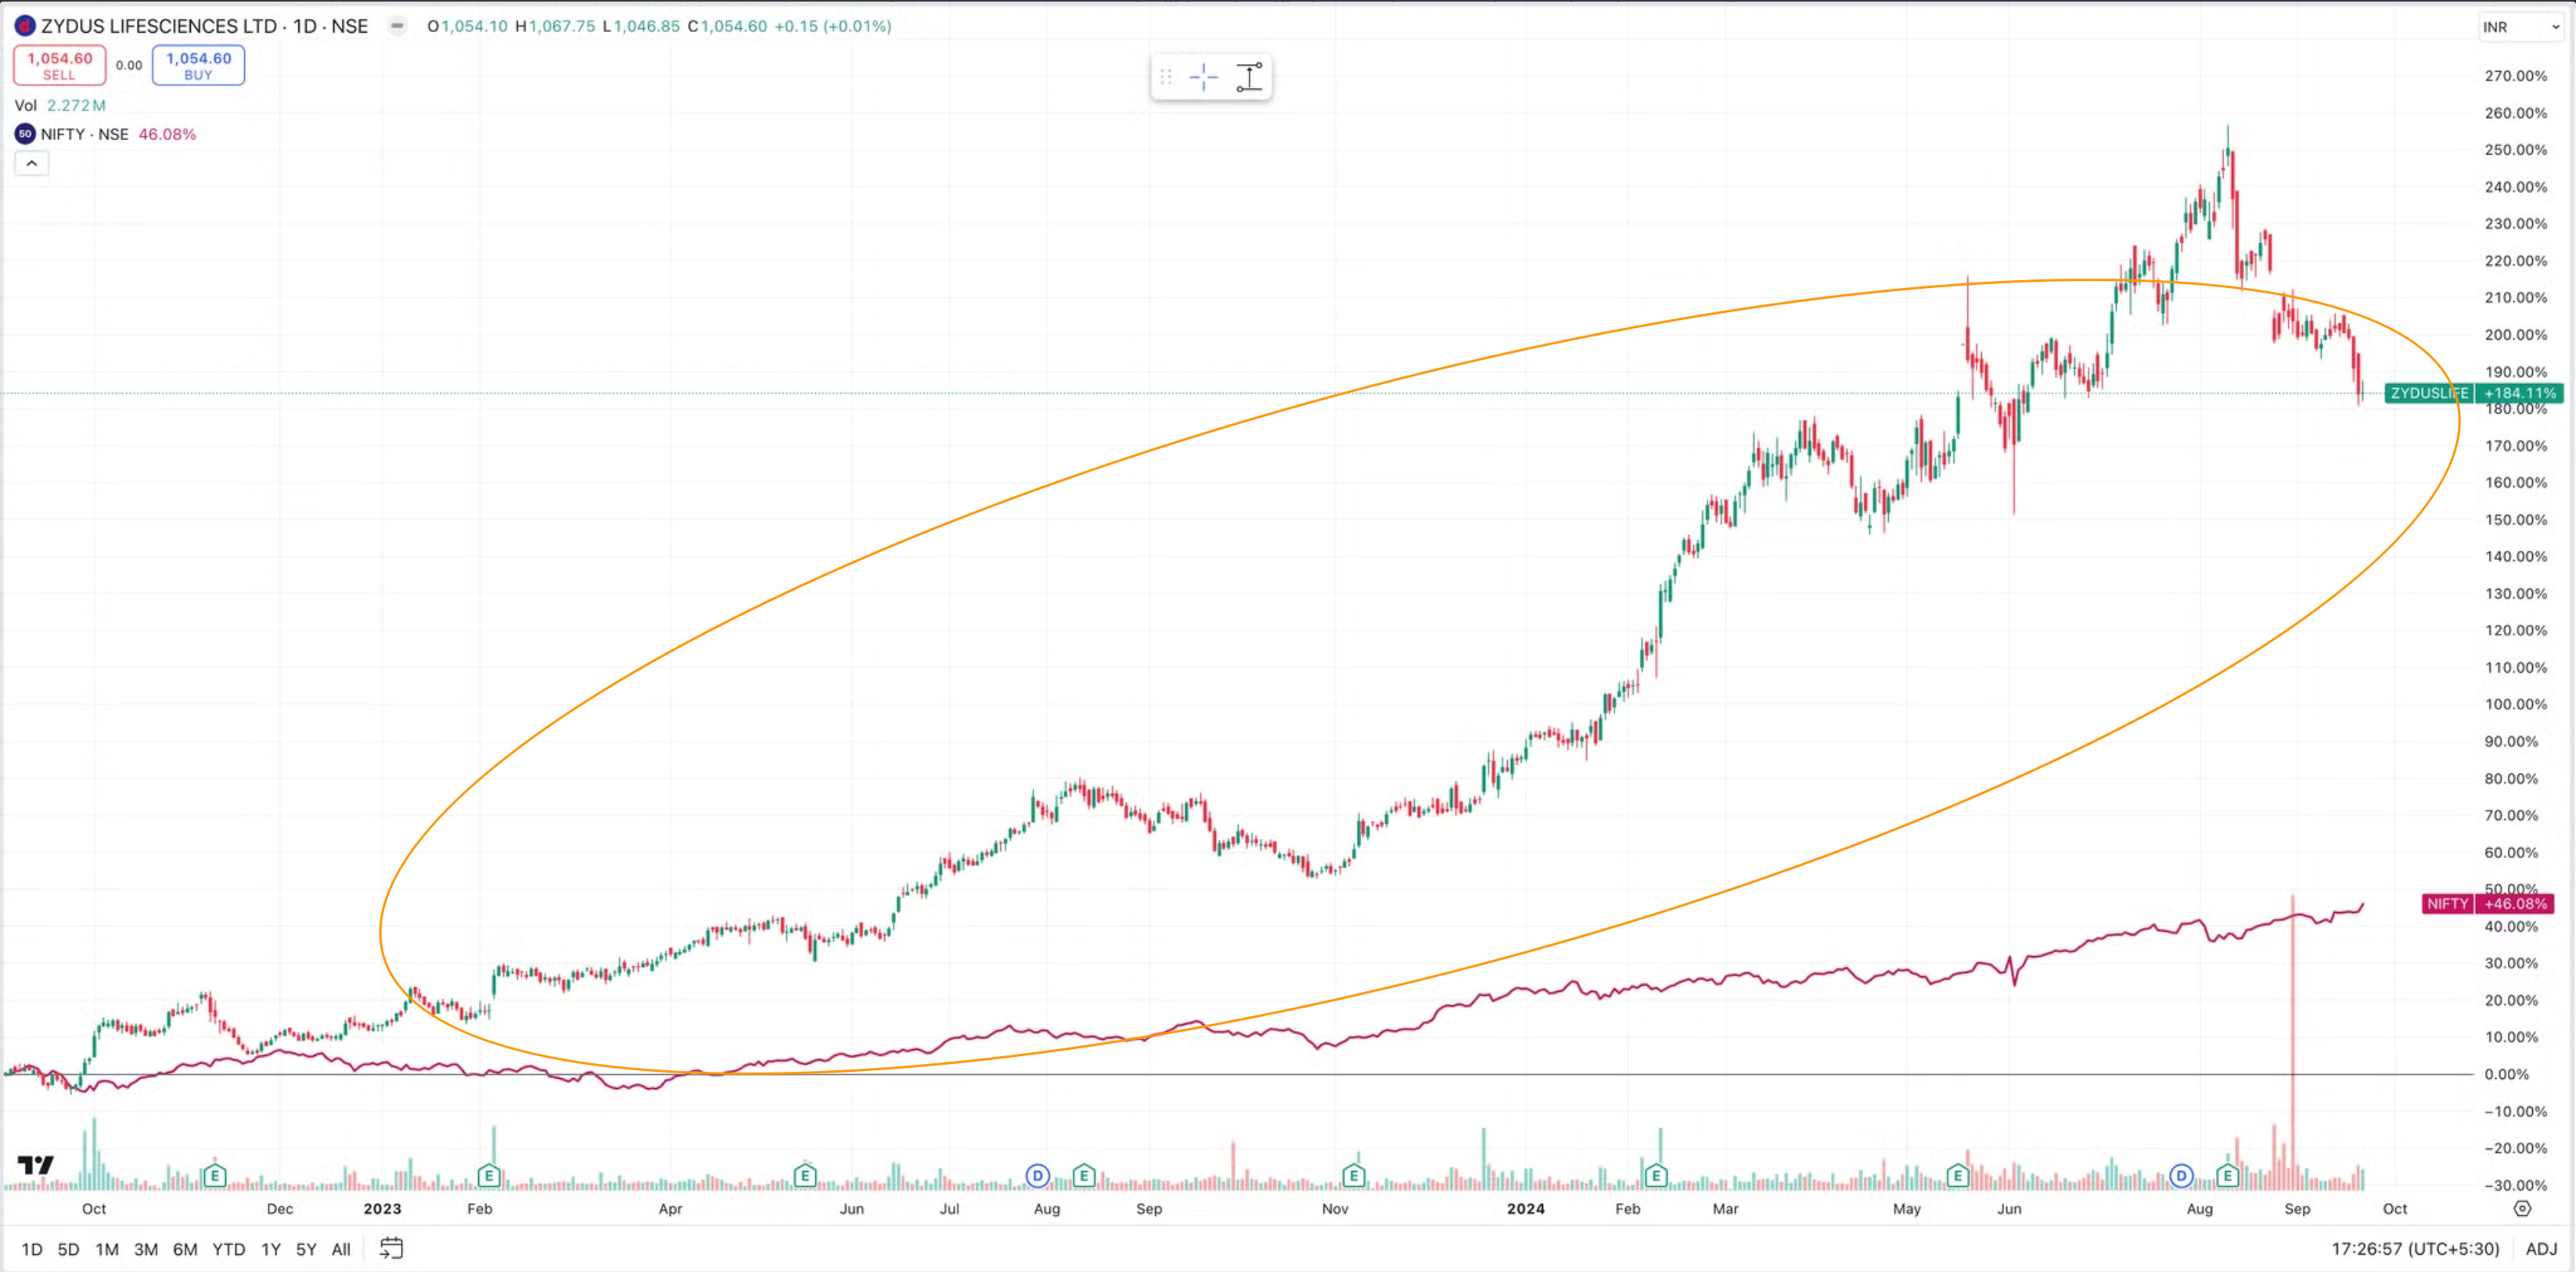
Price action - Since Sept 22, ZydusLife - 184%, NIFTY 46%
Operational metrics performance - Below chart shows Revenue, Gross, Operating and Net Profit Margin improving quarterly since Feb 2023
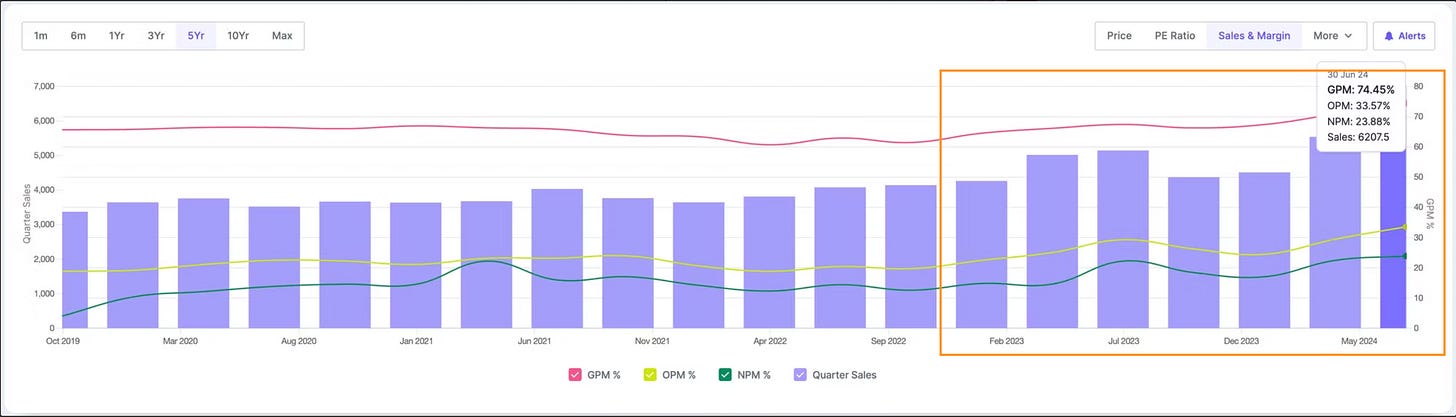
Q1 25 results (QoQ Increase) - Sales increased by 12% and Profits increased by 50%
Q1 25 results (YoY increase) - Sales increased by 21% and Profits increased by 15%
Valuations and EPS - Below chart shows Price and EPS have grown at the same speed since Dec 22 leading to valuations averaging around 25 PE
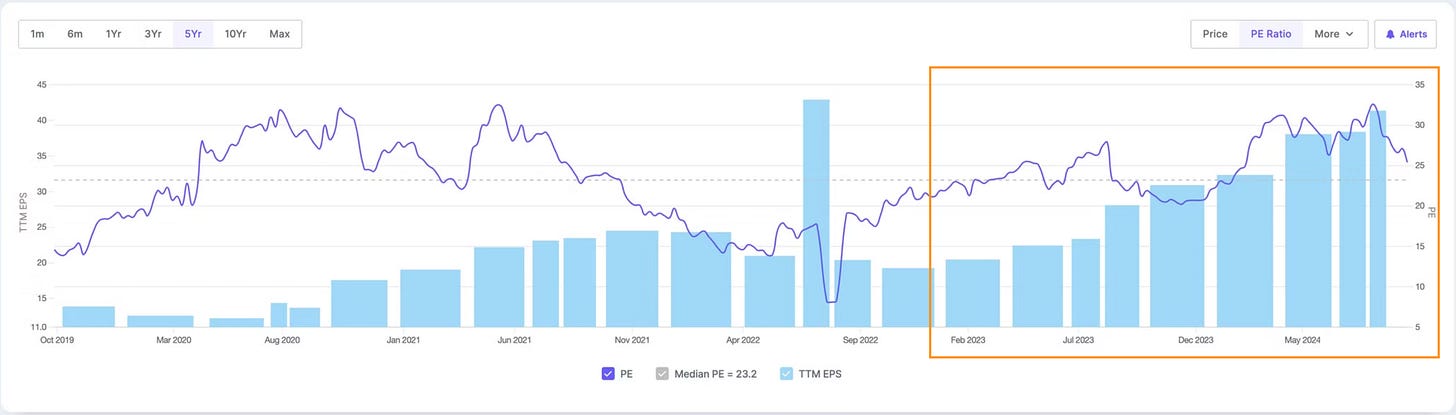
PE 25 - near historical average
TTM EPS (EPS of Last 4 quarters) - Growing consistently QoQ since Dec 2022
What led to outperformance
Revenue Growth
Consolidated revenues up 21% YoY to Rs. 62.1 billion
US Business
Reached all-time high quarterly revenue of $250 million
India Business
Branded formulations grew 13% YoY, outpacing market
Profitability
EBITDA margin improved to 33.6%, up 430 bps YoY
Product Pipeline
Launched 7 new products in US, including Zituvimet
R&D
Completed patient recruitment for key clinical trials
Cash Position
Deleveraged balance sheet by repaying entire debt
Dr. Reddys Laboratories - Market Cap 1,10,000+ Cr
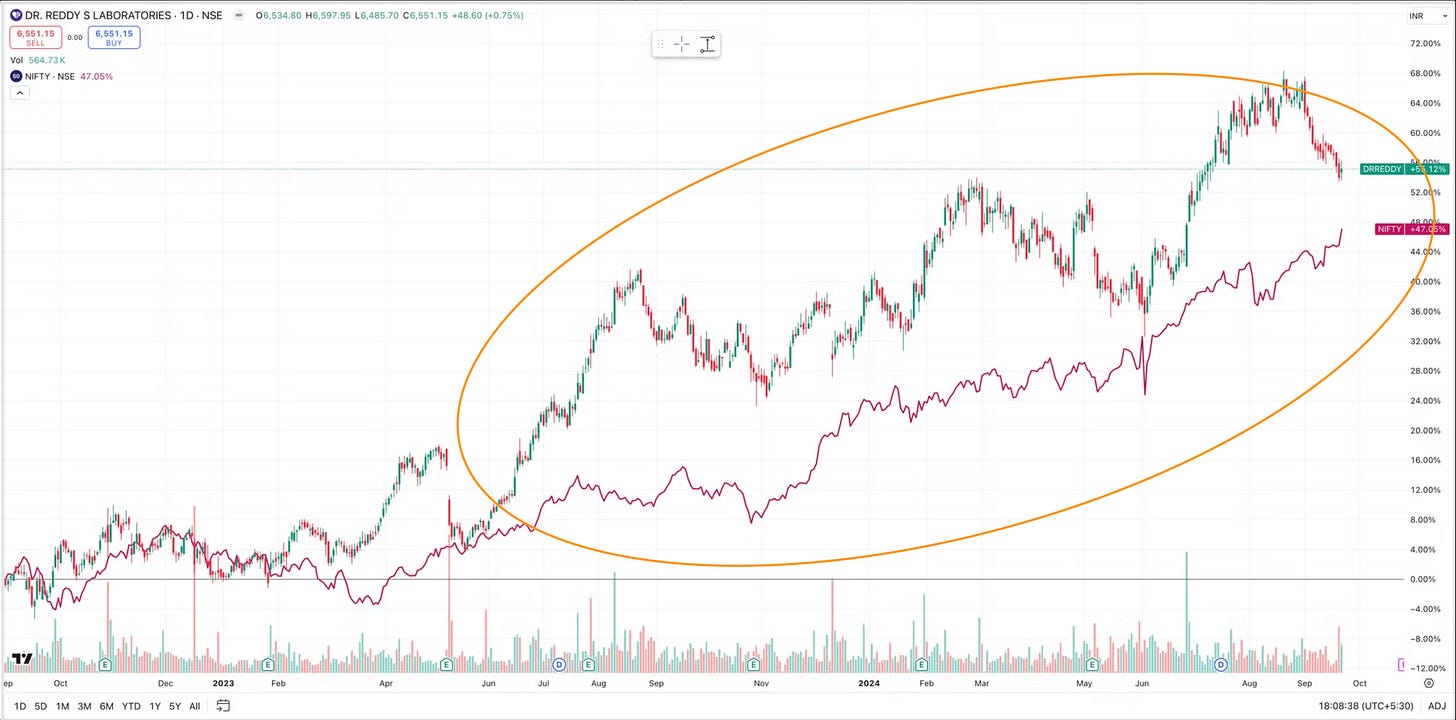
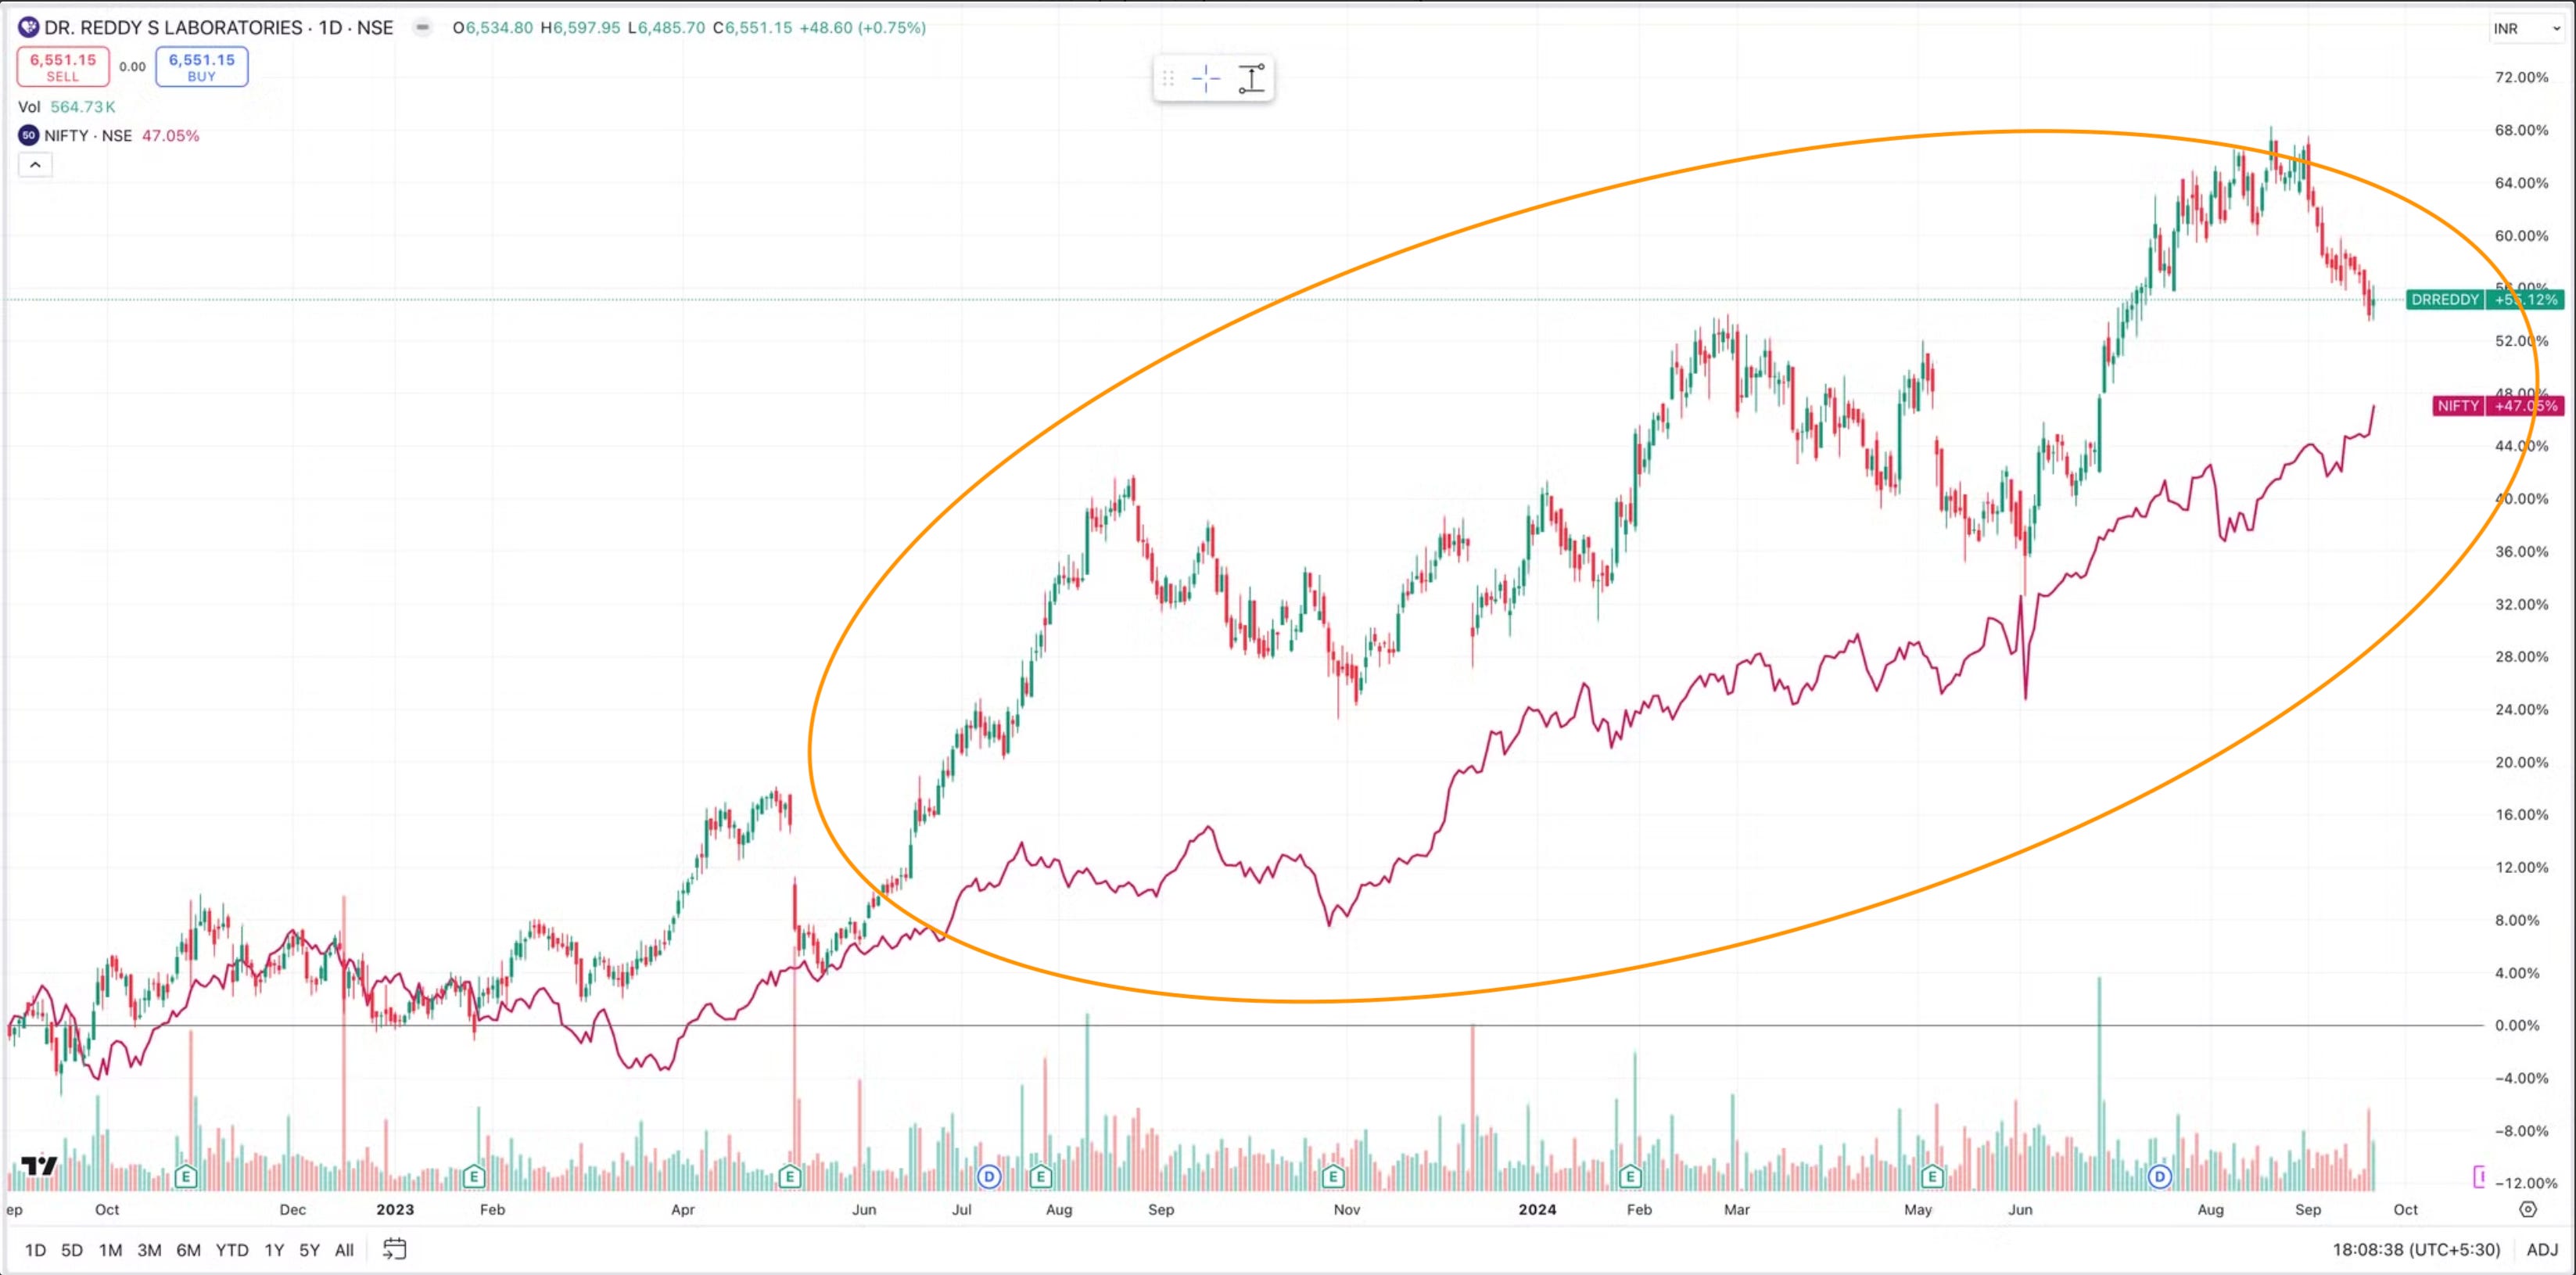
Price action - Since Sept 22,Dr Reddy - 55%, NIFTY 46%
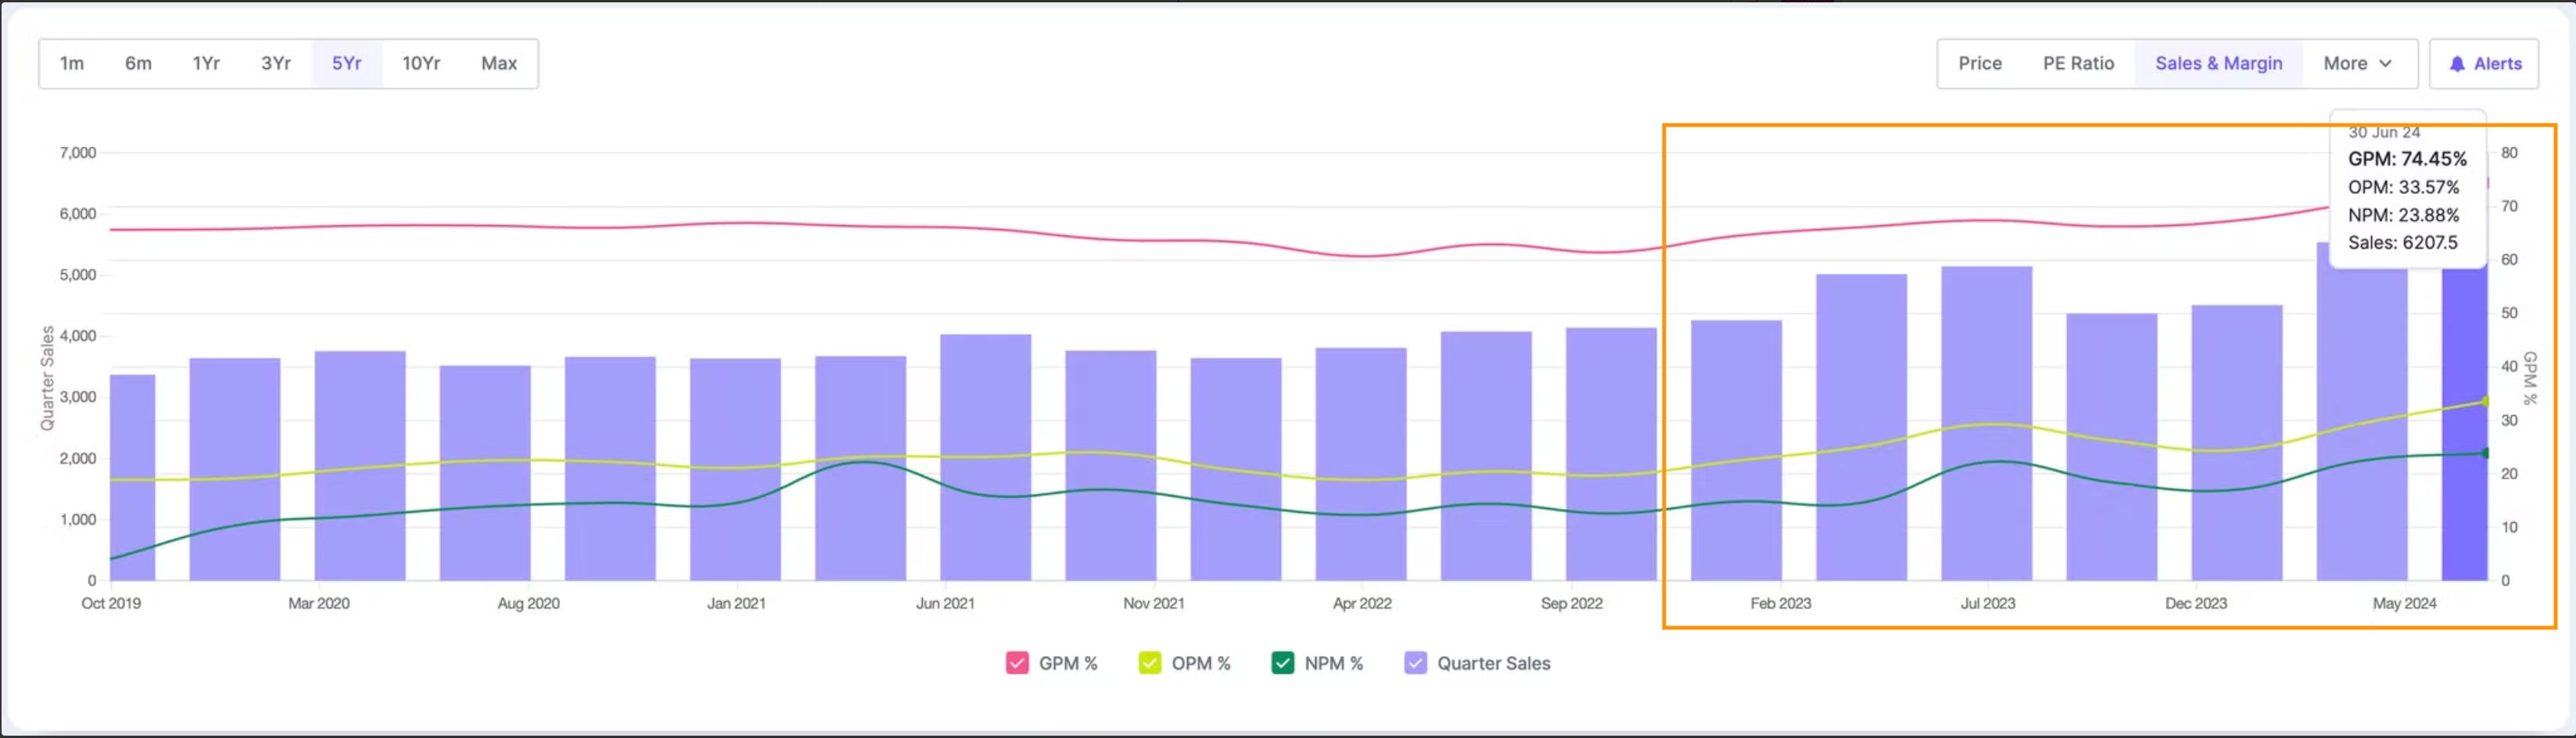
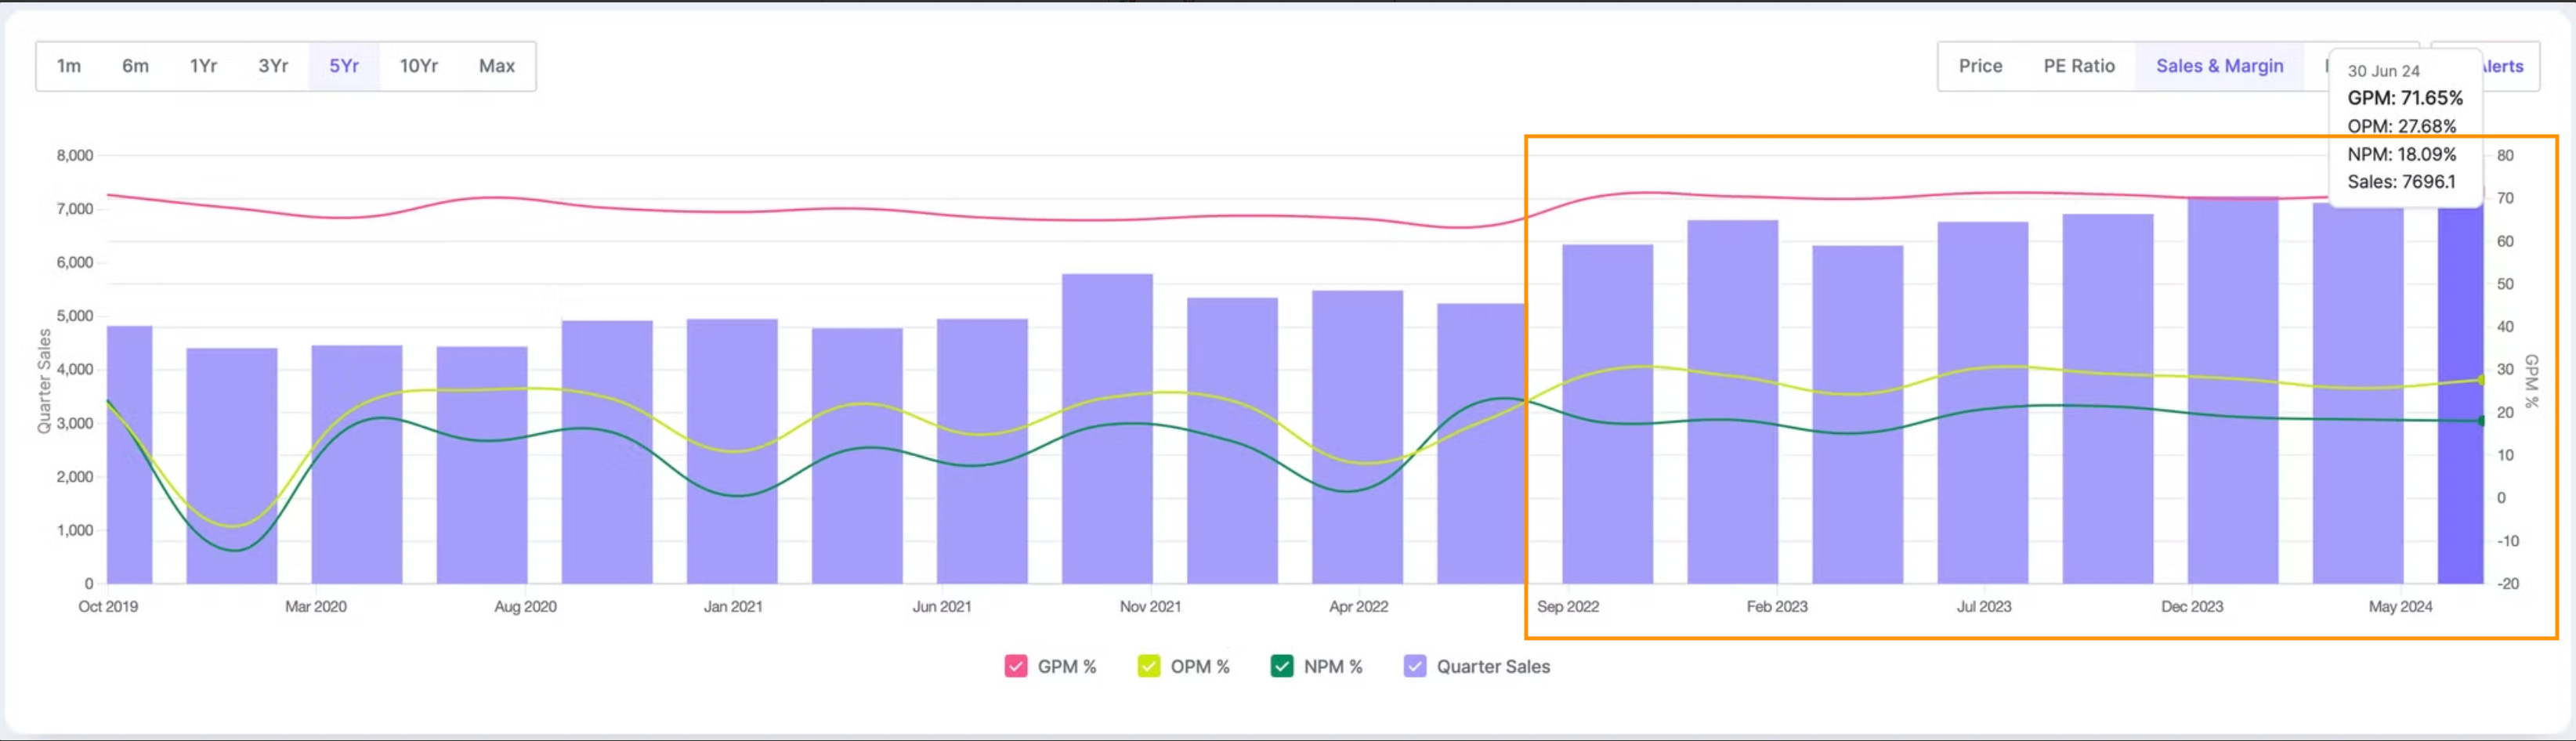
Operational metrics performance - Below chart shows Revenue, Gross, Operating and Net Profit Margin improving quarterly since Sept 2022
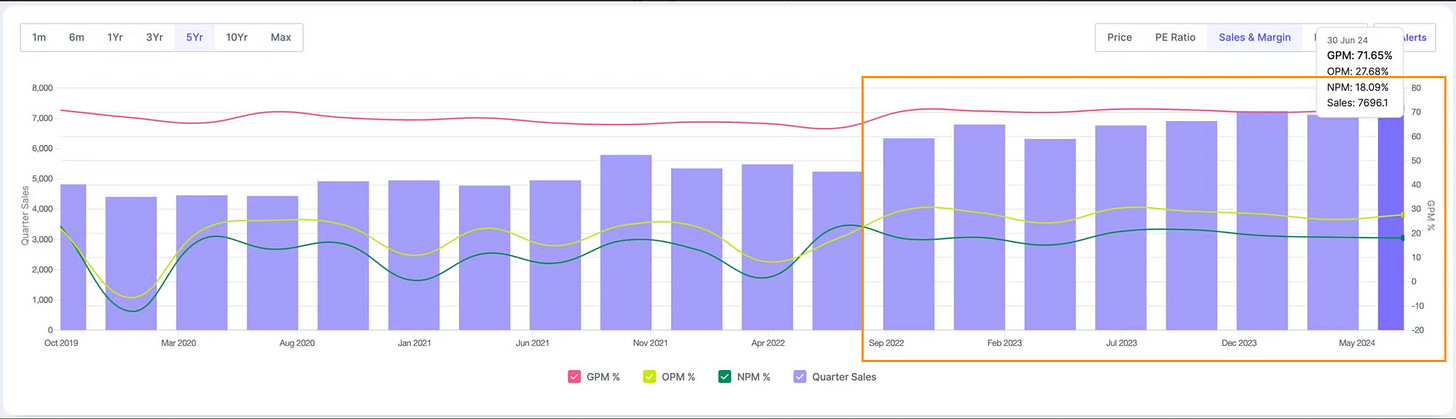
Q1 25 results (QoQ Increase) - Sales increased by 8% and Profits increased by 6%
Q1 25 results (YoY increase) - Sales increased by 14% and Profits decreased by 9%
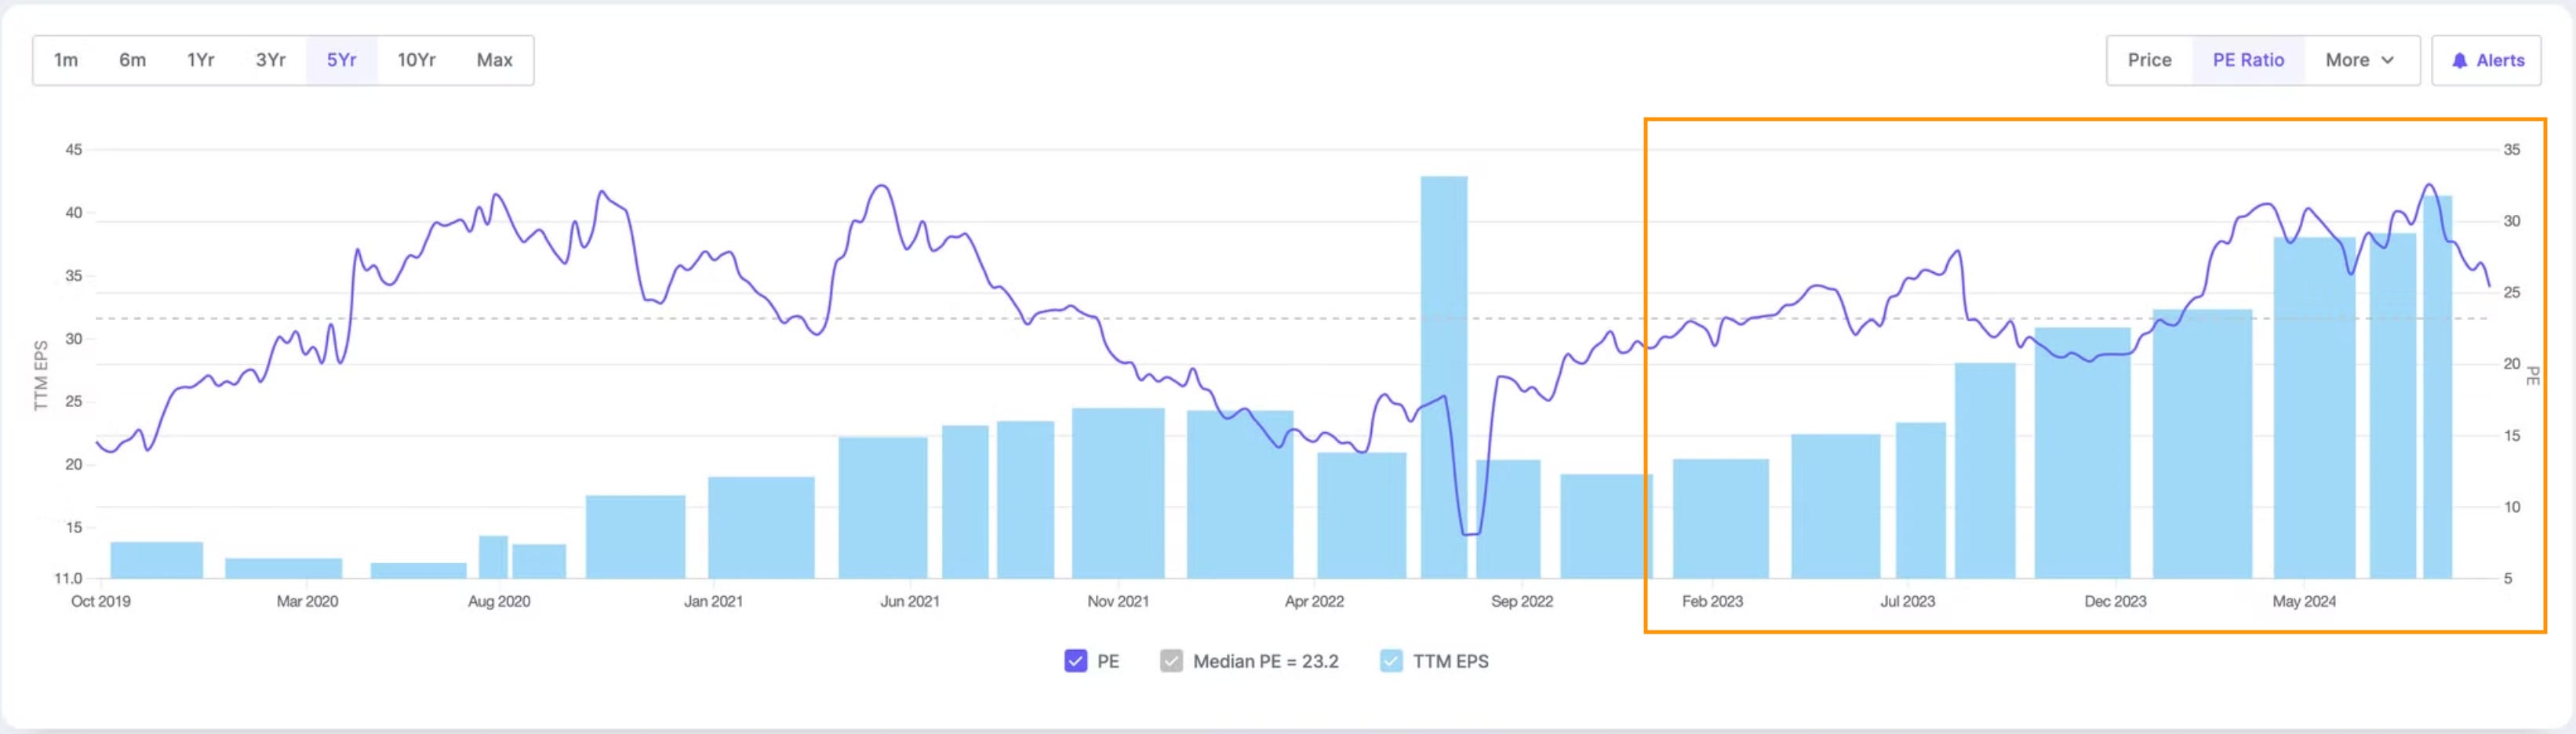
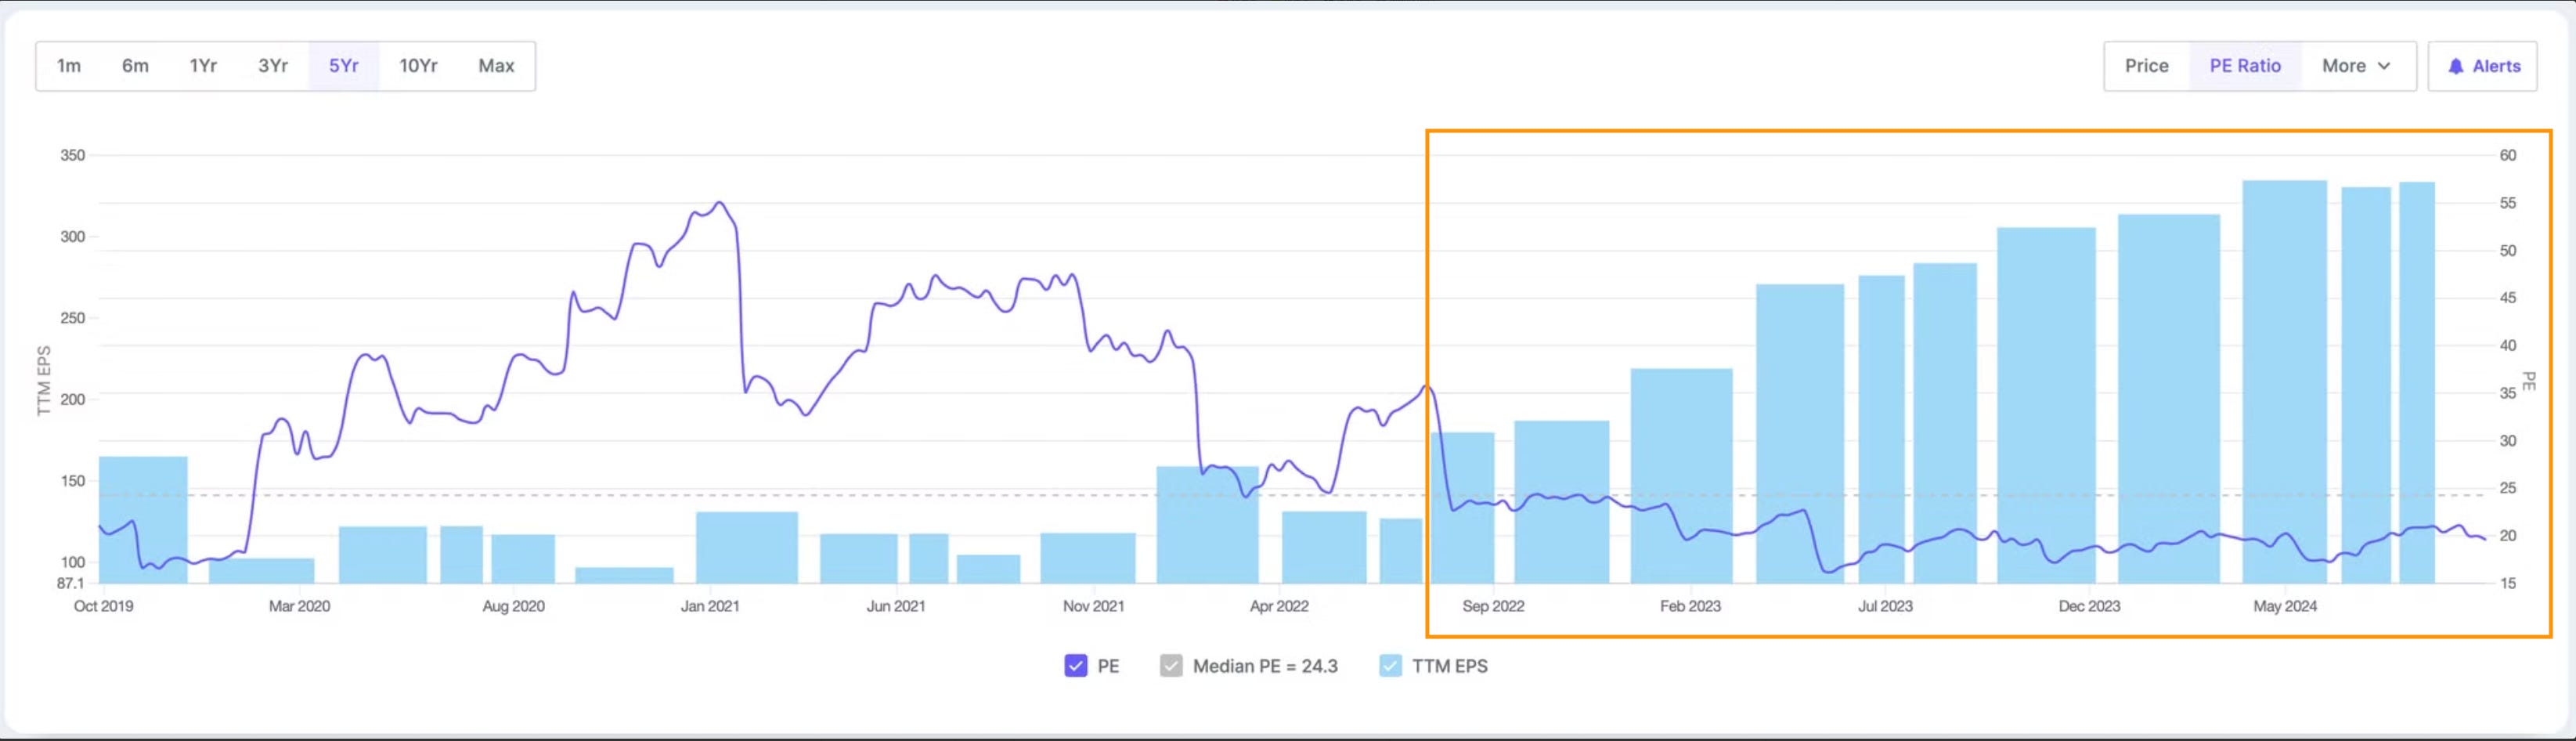
Valuations and EPS - Below chart shows EPS growth has moved faster than price growth since Feb 23 leading to a PE derating
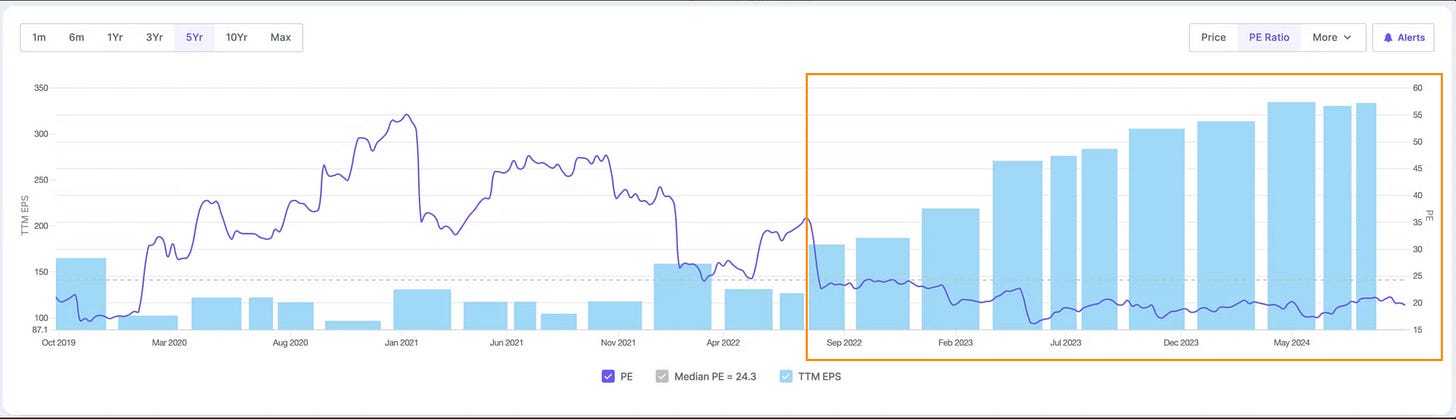
PE 20 - below historical average
TTM EPS (EPS of Last 4 quarters) - Growing consistently QoQ since Dec 2022
What led to outperformance
US Business
North America Generics revenues up 19% YoY to $463 million
Gross Margin
Improved to 60.4%, up 170 bps YoY
EBITDA
Up 15% QoQ to Rs. 2,160 crores, margin at 28.2%
R&D Expenses
8.1% of sales, focused on biosimilars and complex generics
New Initiatives
Acquisition of Nicotinell® and related NRT brands
Biosimilars
Denosumab and abatacept in pipeline for future launches
Aurbindo Pharma - Market Cap 86,775+ Cr
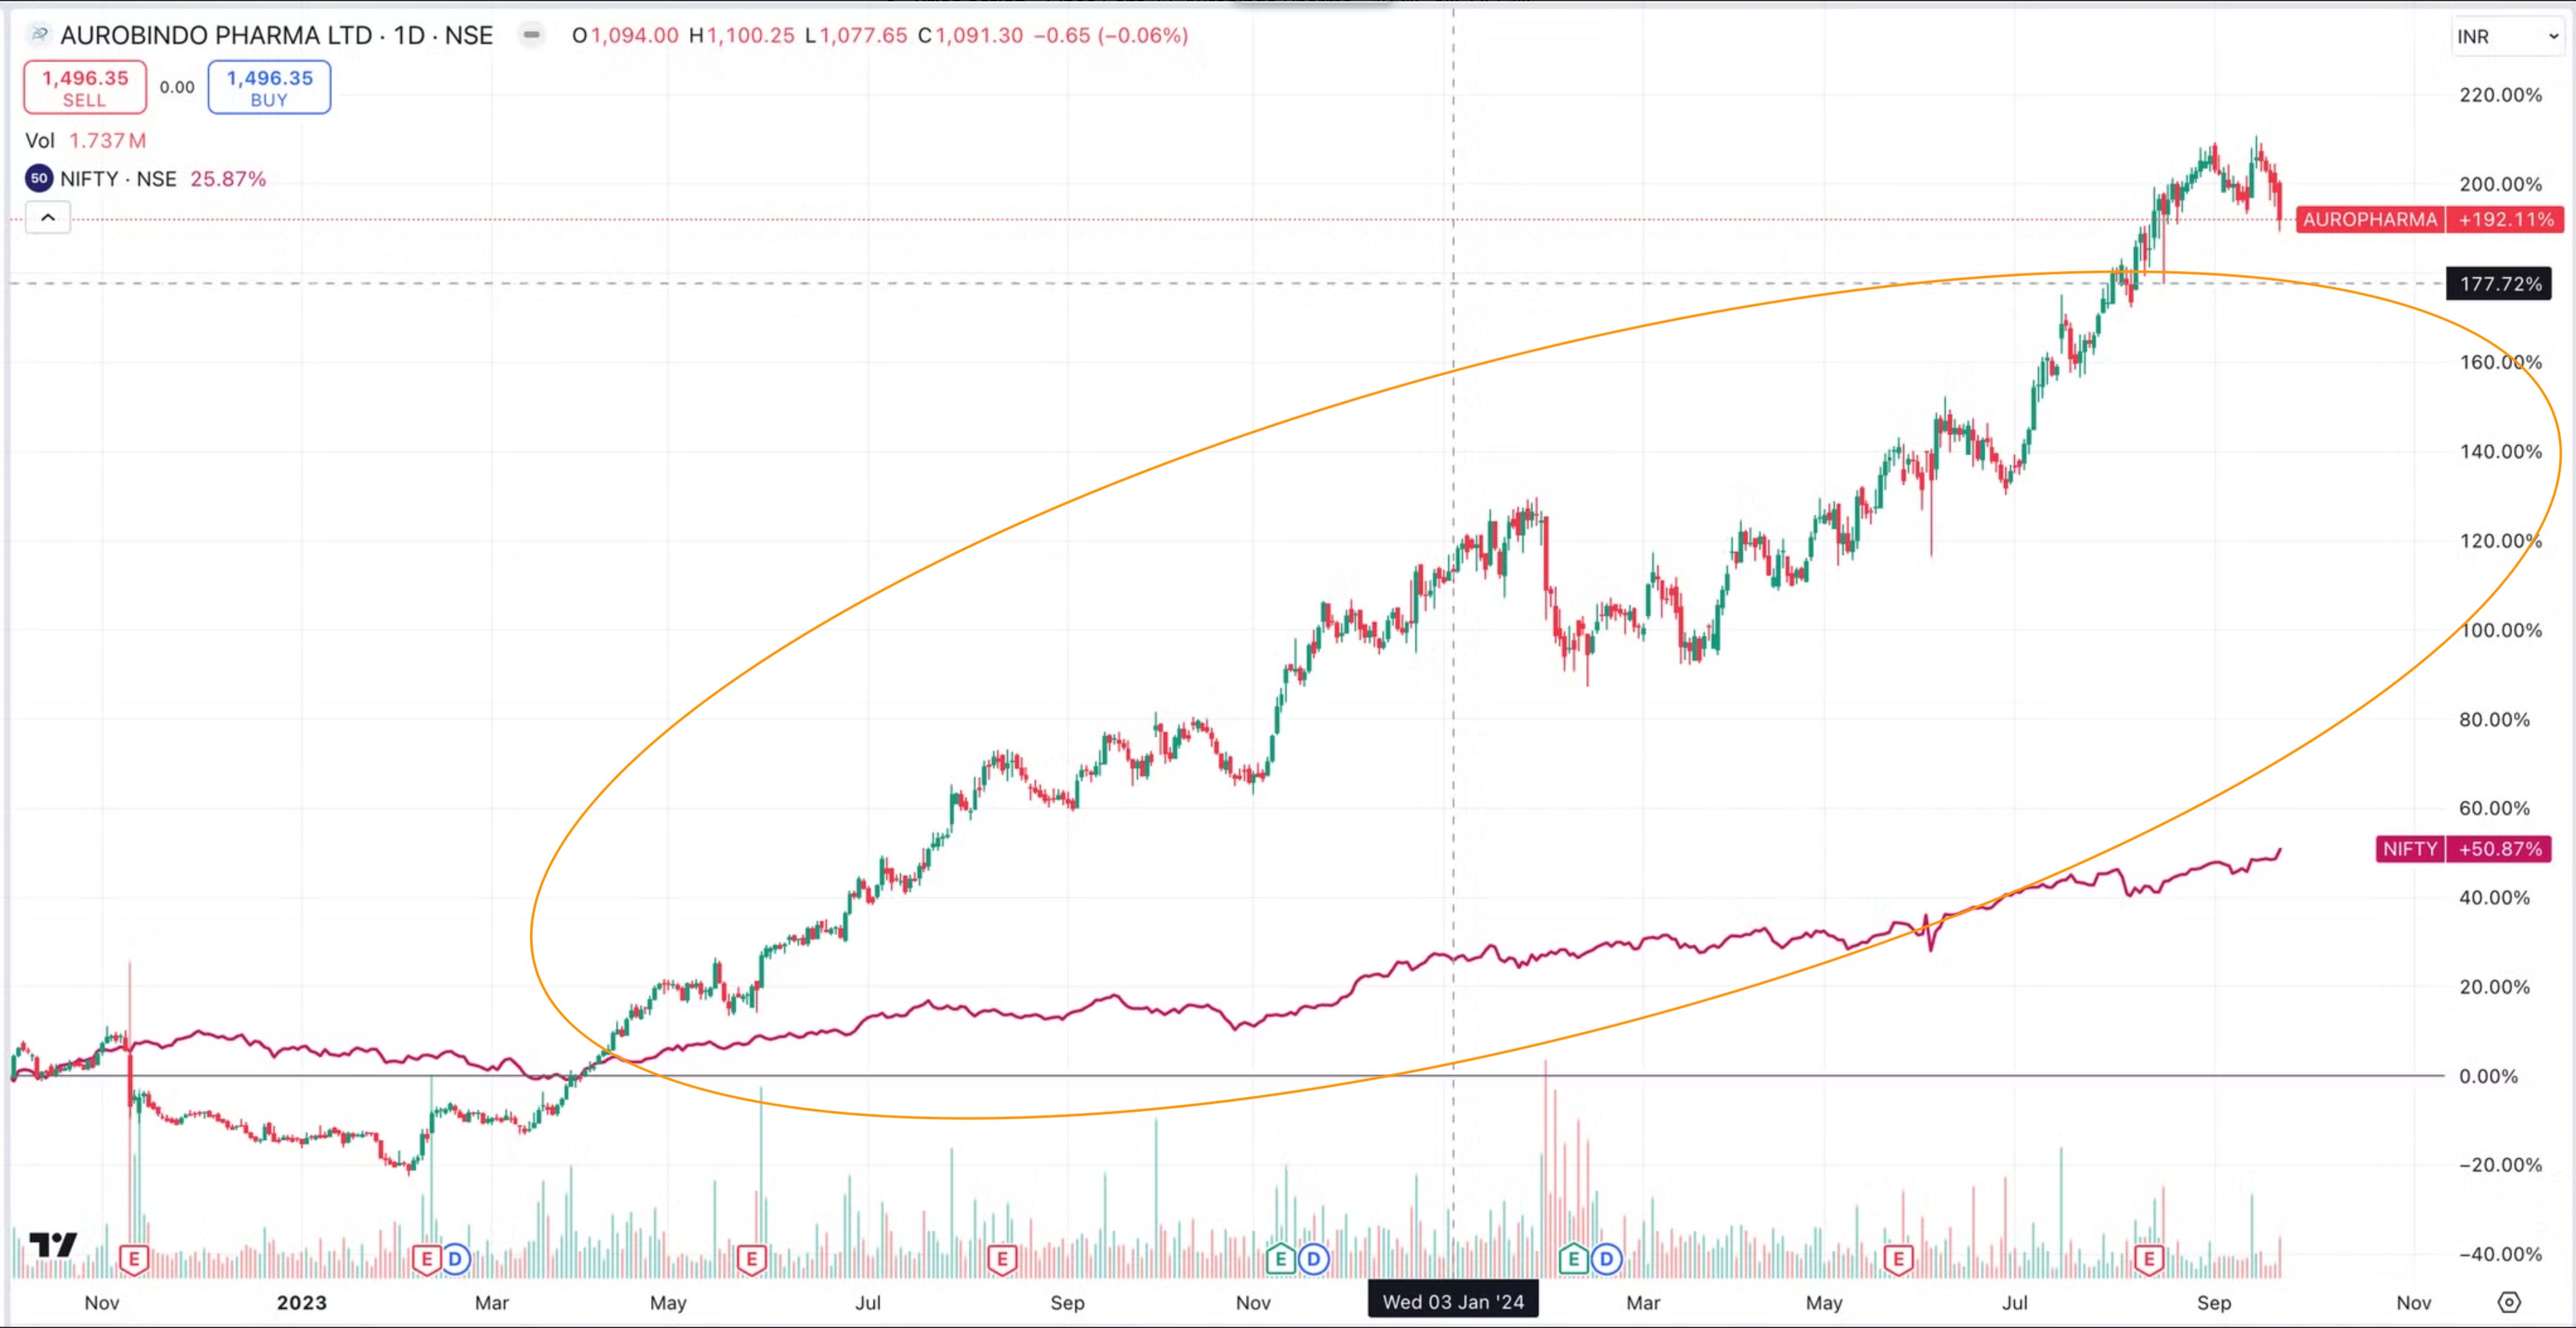
Price action - Since Sept 22, Aurobindo Pharma - 192%, NIFTY 51%
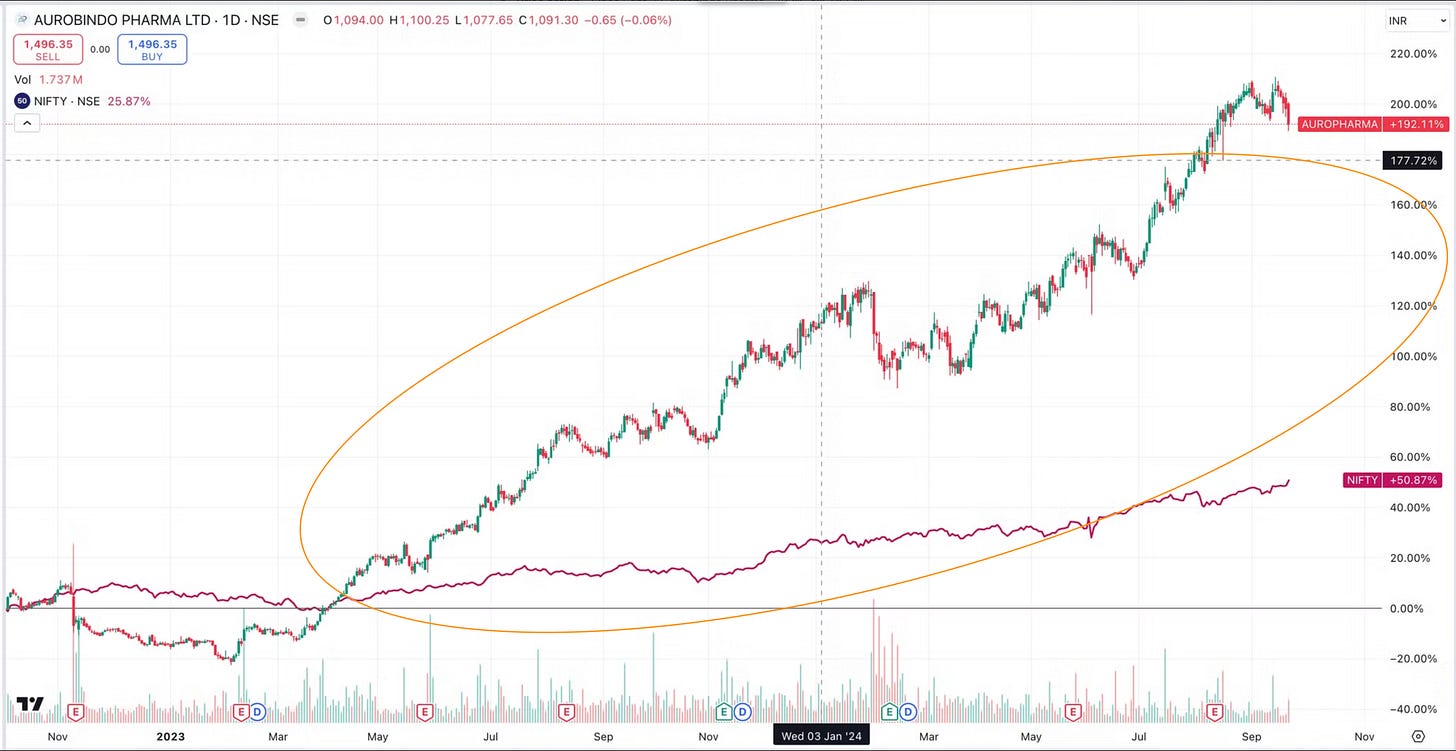
Operational metrics performance - Below chart shows Revenue, Gross, Operating and Net Profit Margin improving quarterly since Dec 2022
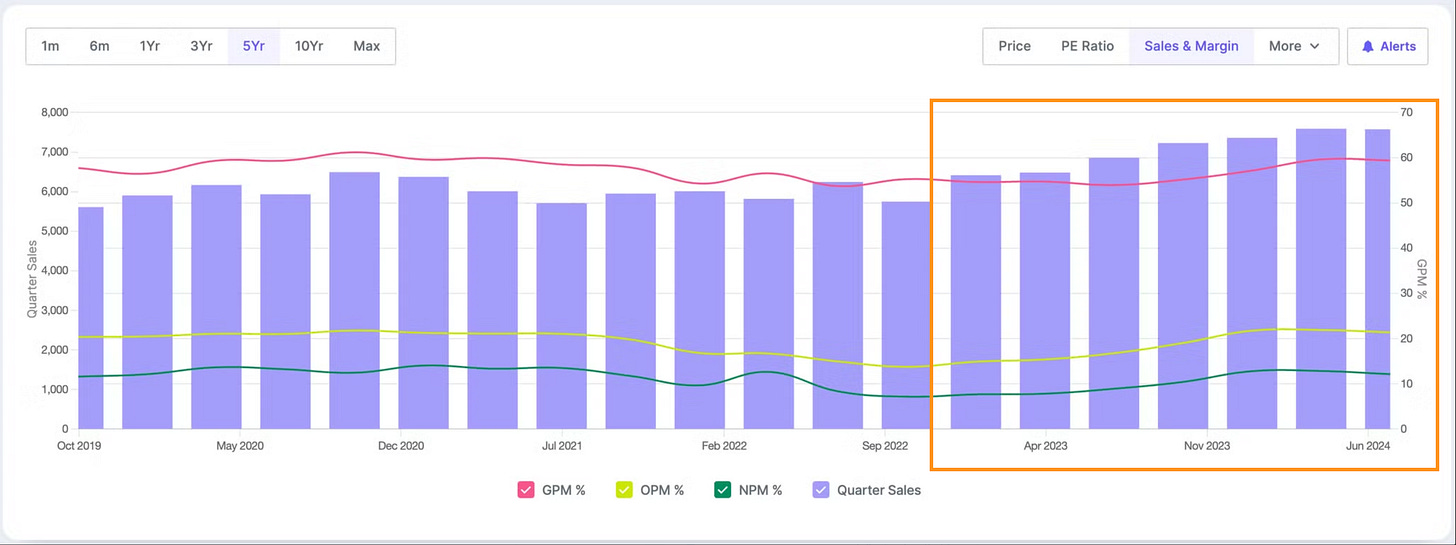
Q1 25 results (QoQ Increase) - Sales by 0% and Profits by 43%
Q1 25 results (YoY increase) - Sales by 10% and Profits by 27%
Valuations and EPS - Below chart shows EPS and Price growth has moved together since July 23 keeping the PE stable around 25
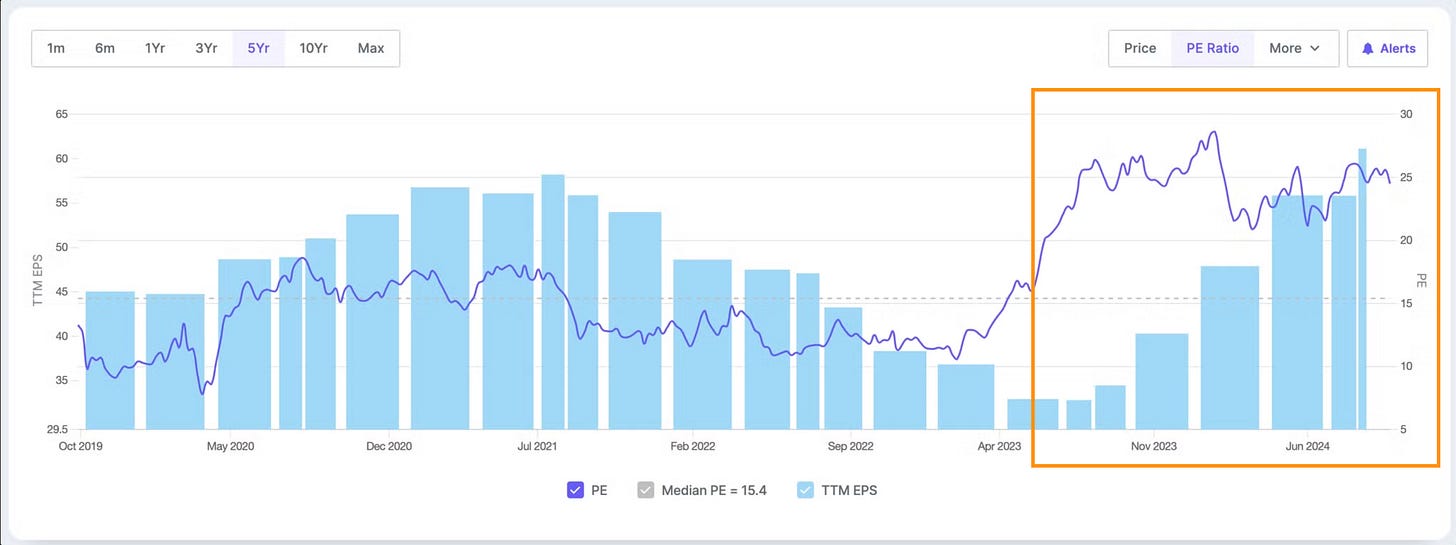
PE 25 - above historical average
TTM EPS (EPS of Last 4 quarters) - Growing consistently QoQ since July 2023
What led to outperformance
Revenue Growth
Topline growth of 10% YoY to Rs. 7,567 crores
US Business
Revenue of $426 million, 12% YoY growth
Europe Business
Strong performance with €221 million revenue
EBITDA Margin
Maintained at 21.4%, in line with expectations
Pen-G Plant
Expected to ramp up significantly from October'24
Regulatory Issues
Remediation costs expected to reduce significantly in Q2
Biosimilars Pipeline
Progress in clinical trials, filings expected from next year
Revlimid
Continued contribution to revenue
API Business
6% YoY growth to Rs. 1,092
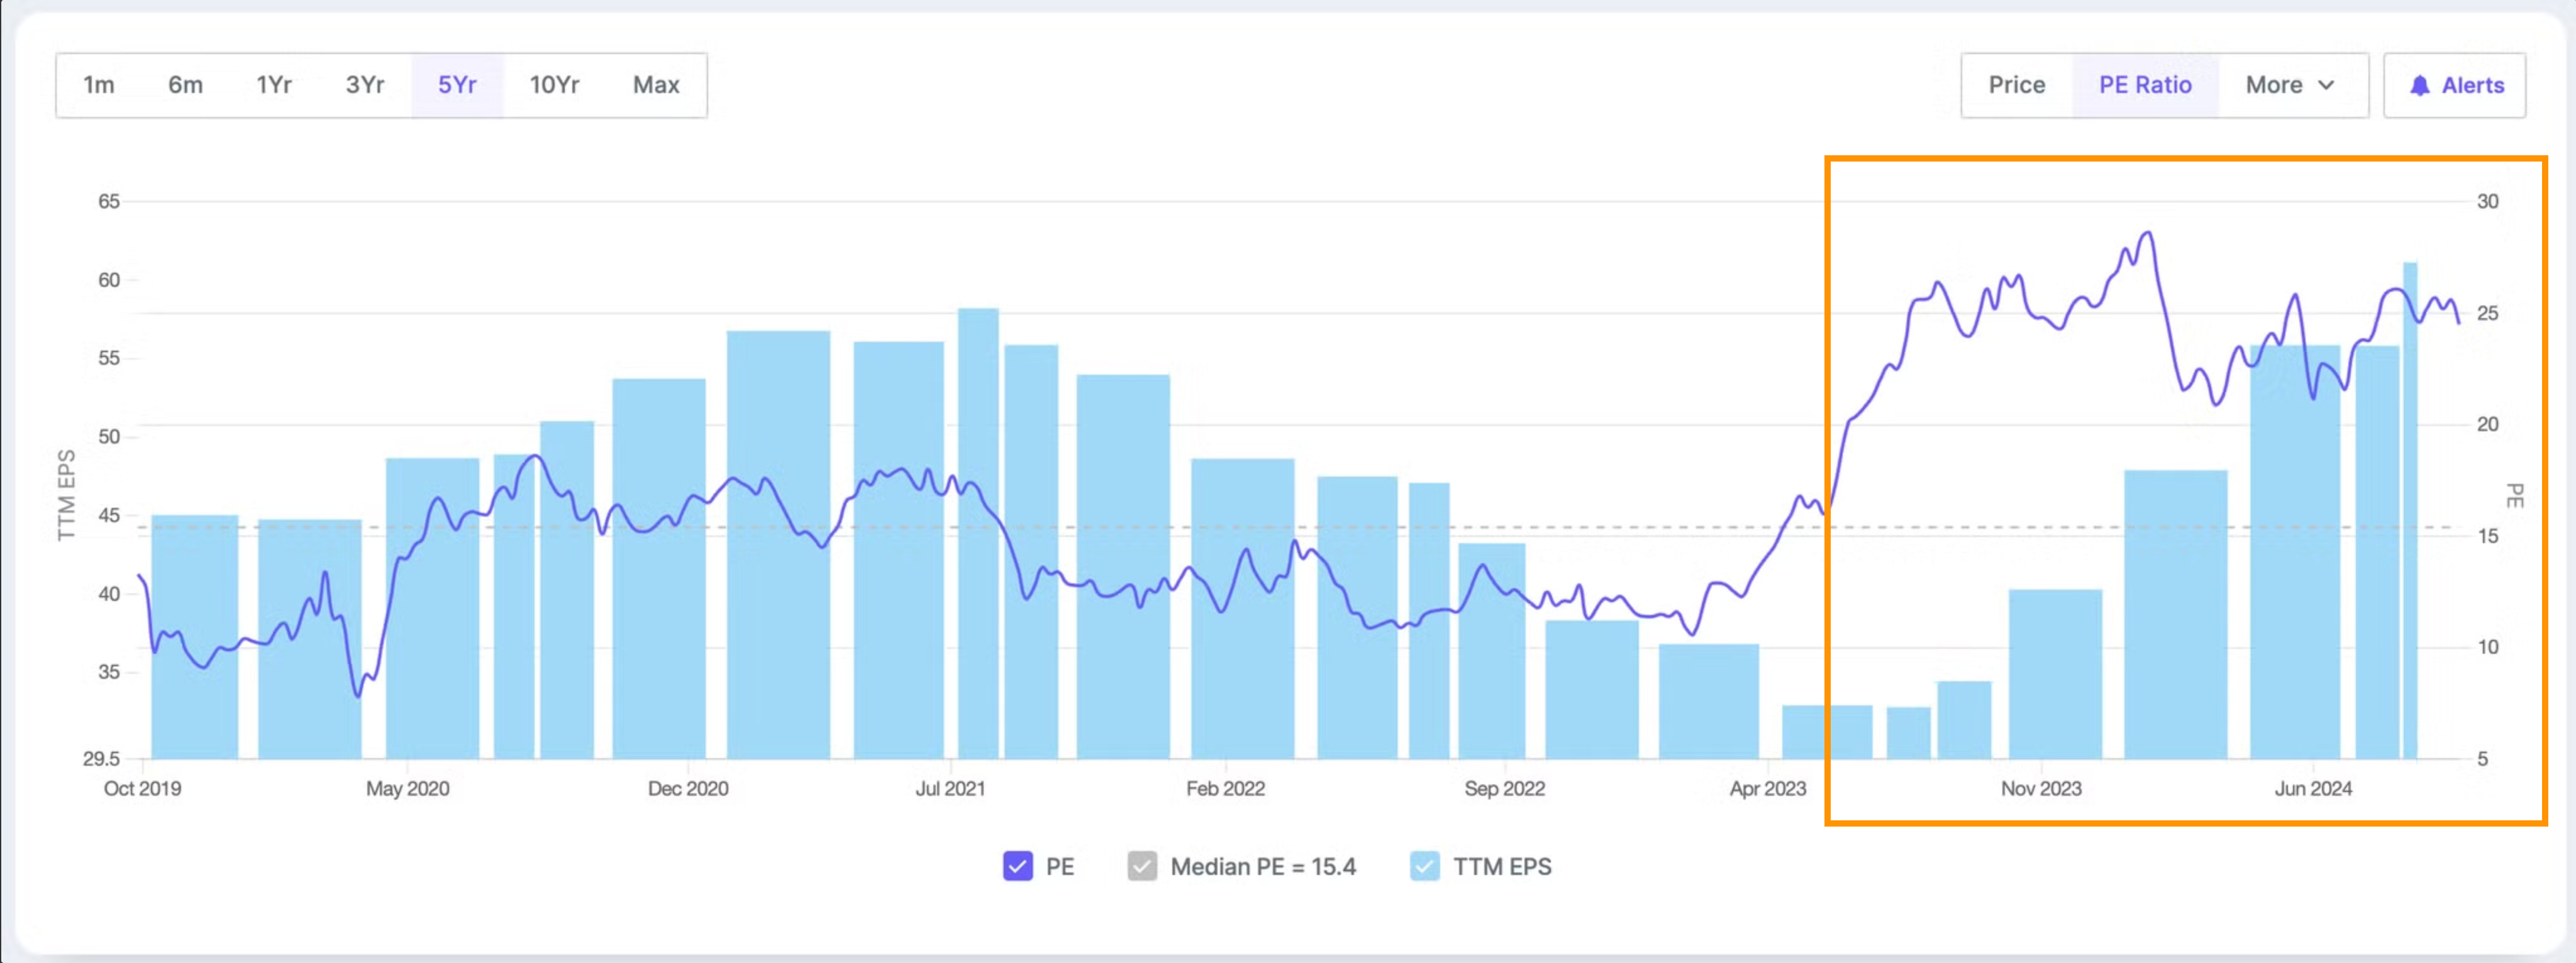
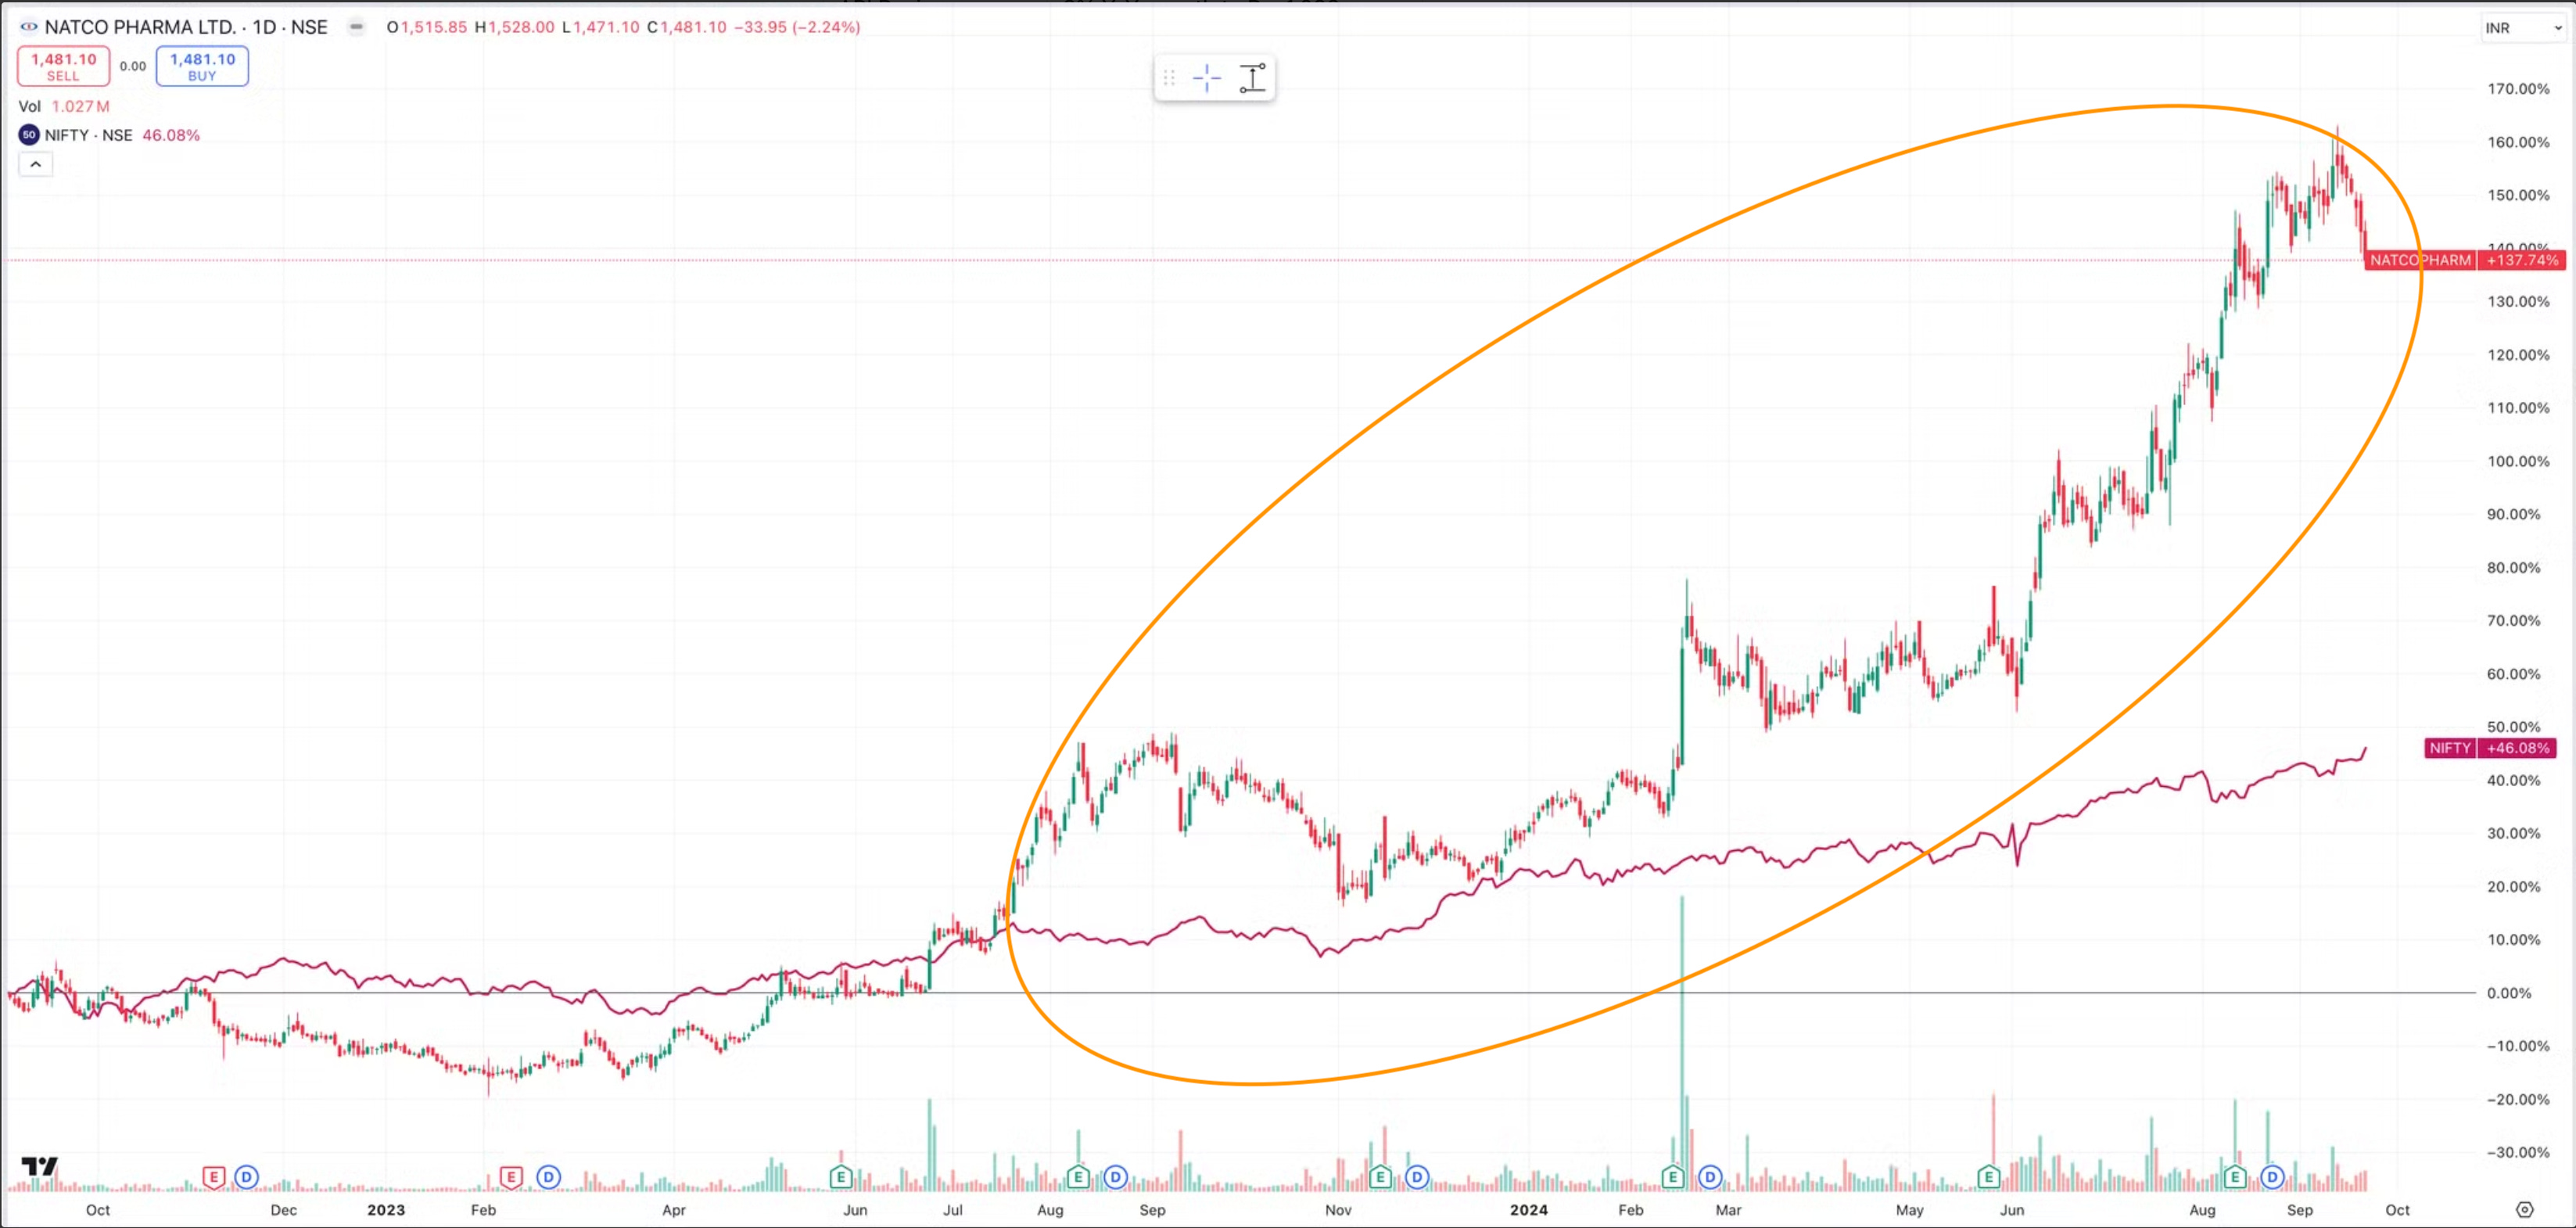
Natco Pharma - Market Cap 25,318 + Cr
Price action - Since Sept 22, Natco Pharma - 137%, NIFTY 46%
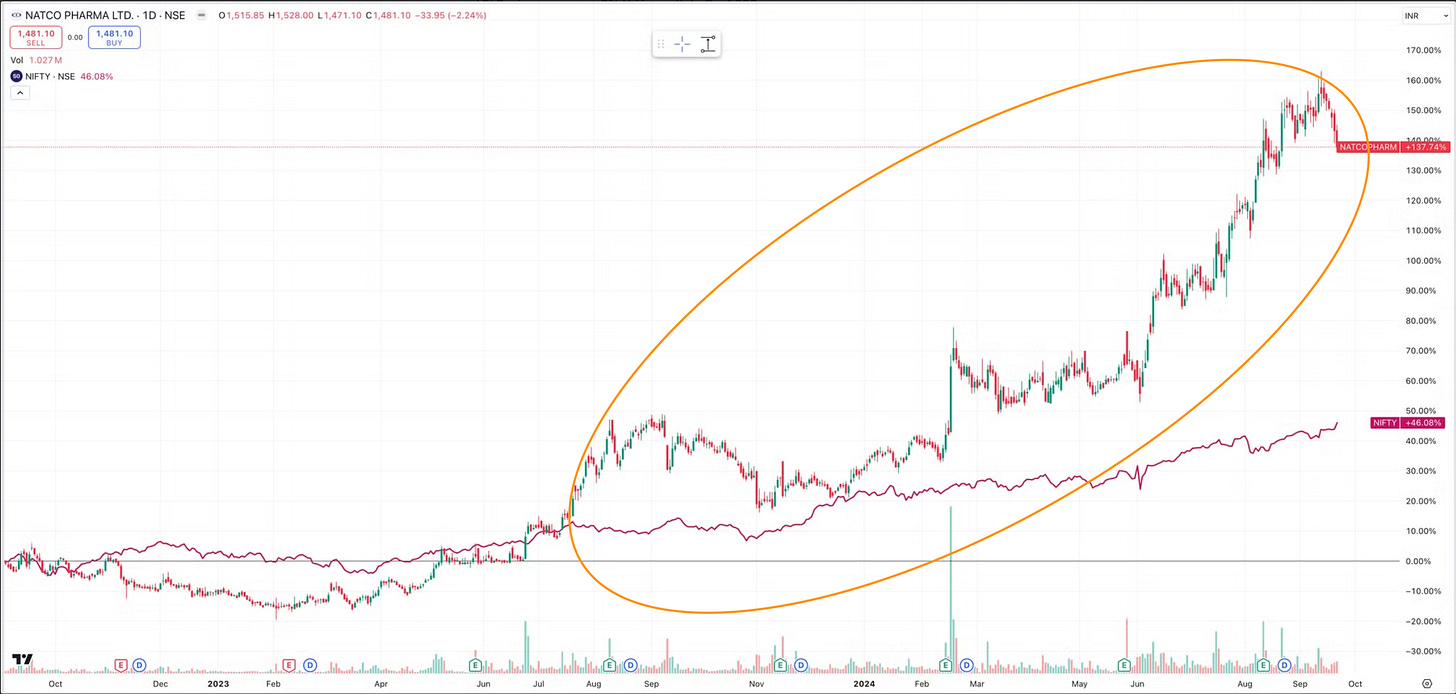
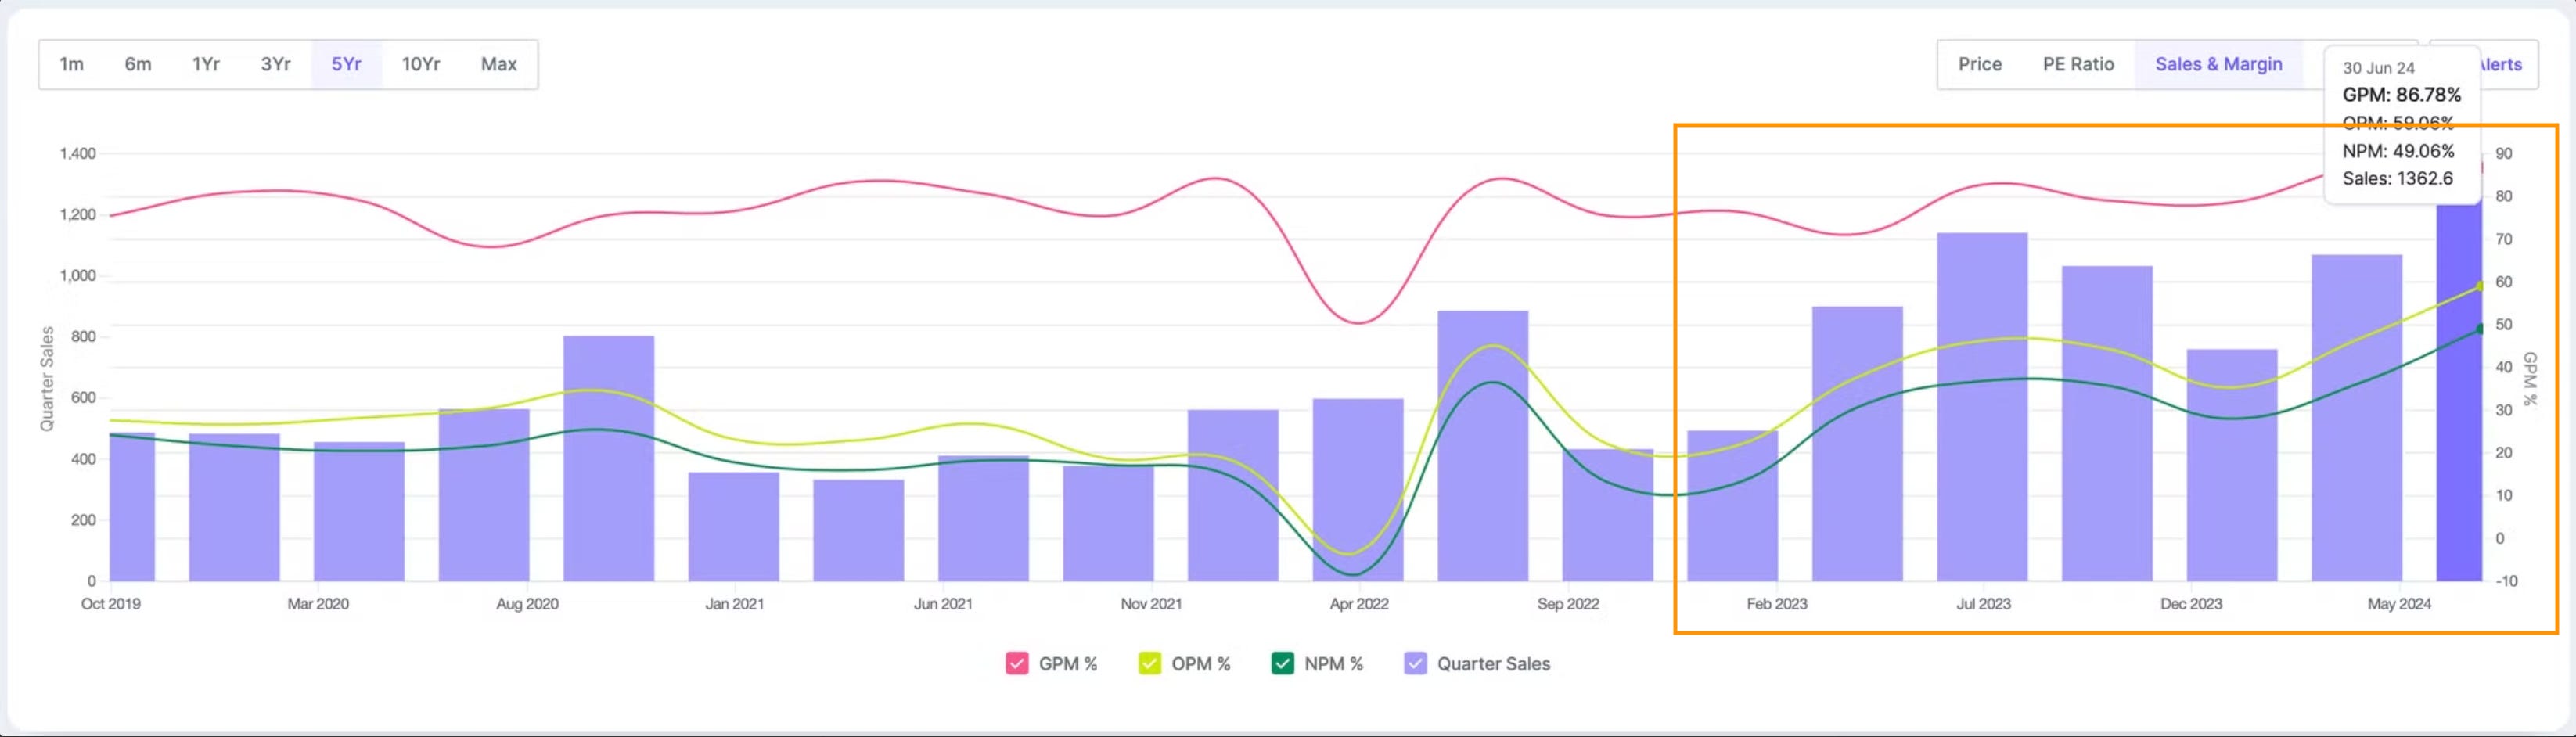
Operational metrics performance- Below chart shows Revenue, Gross, Operating and Net Profit Margin improving quarterly since Feb 2023
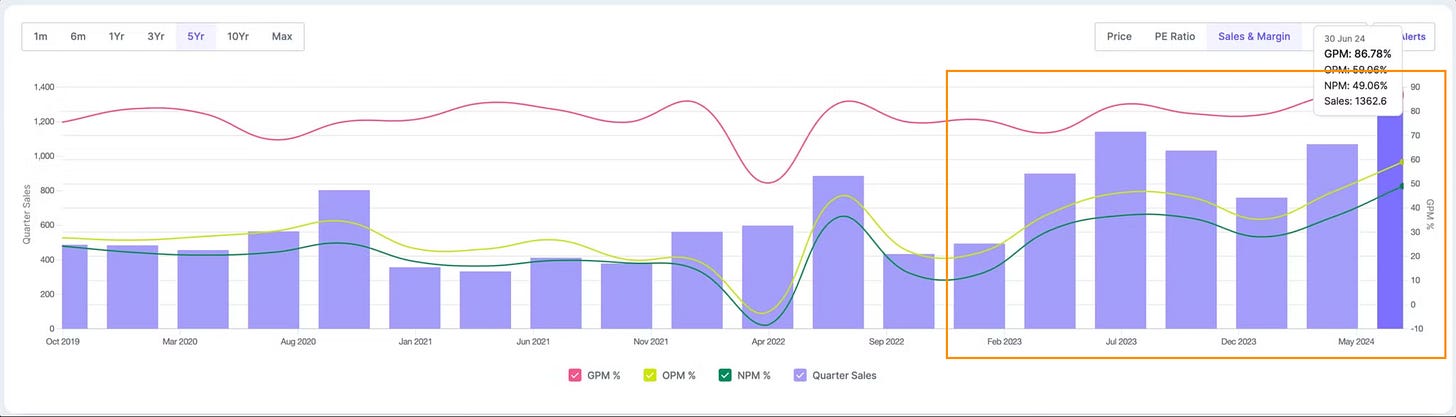
Q1 25 results (QoQ Increase) - Sales by 28% and Profits by 71%
Q1 25 results (YoY increase) - Sales by 19% and Profits by 28%
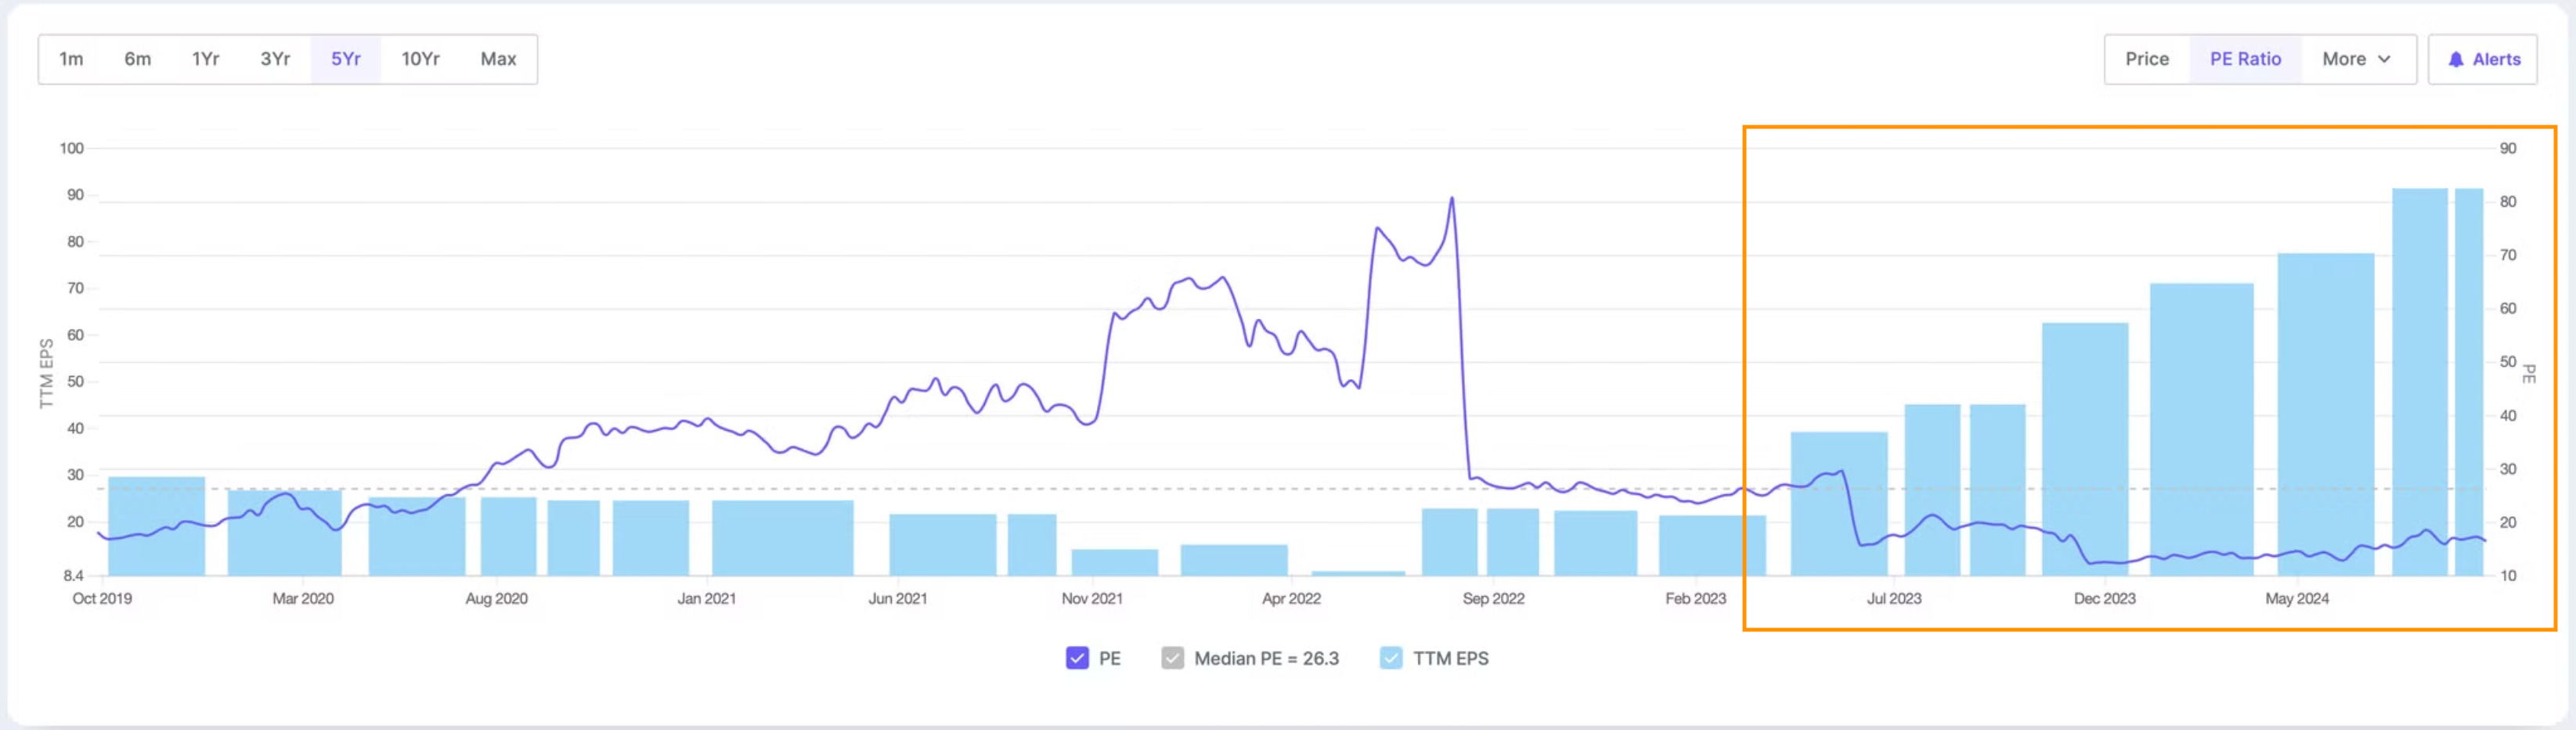
Valuations and EPS - EPS growth has moved faster than price growth since Jun 23 leading to a PE derating
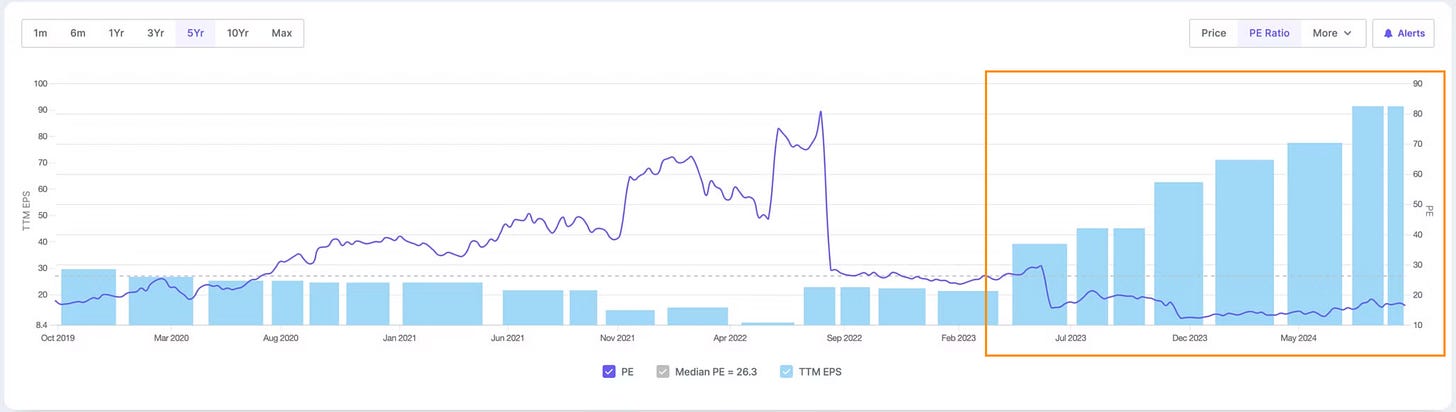
PE 16 - below historical average
TTM EPS (EPS of Last 4 quarters) - Growing consistently QoQ since Jun 2023
What led to outperformance -
Revenue Growth
Consolidated revenue up 21.6% YoY to INR 1,410.7 crores
Profitability
Net profit up 59% YoY to INR 668.5 crores
US Business
Strong performance in export formulations
Domestic Business
Stable at INR 100 crores per quarter; double-digit growth expected for the year
Product Pipeline
Potential opportunities in Semaglutide, Olaparib, and Erdafitinib
Agro Business
New business with potential for growth
Cash Position
About INR 2,000 crores cash in books
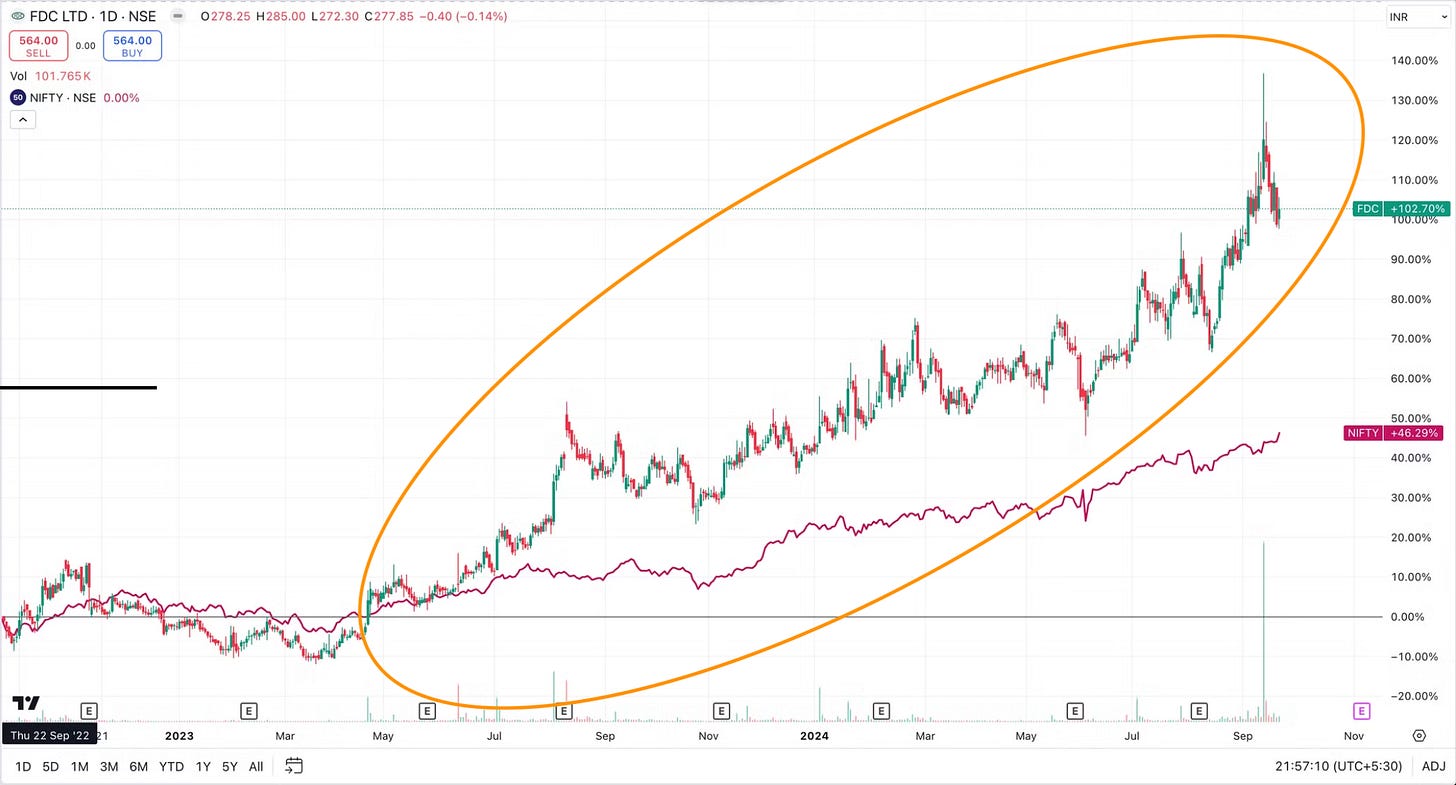
Fair Deal Corporation - Market Cap 9,245+ Cr
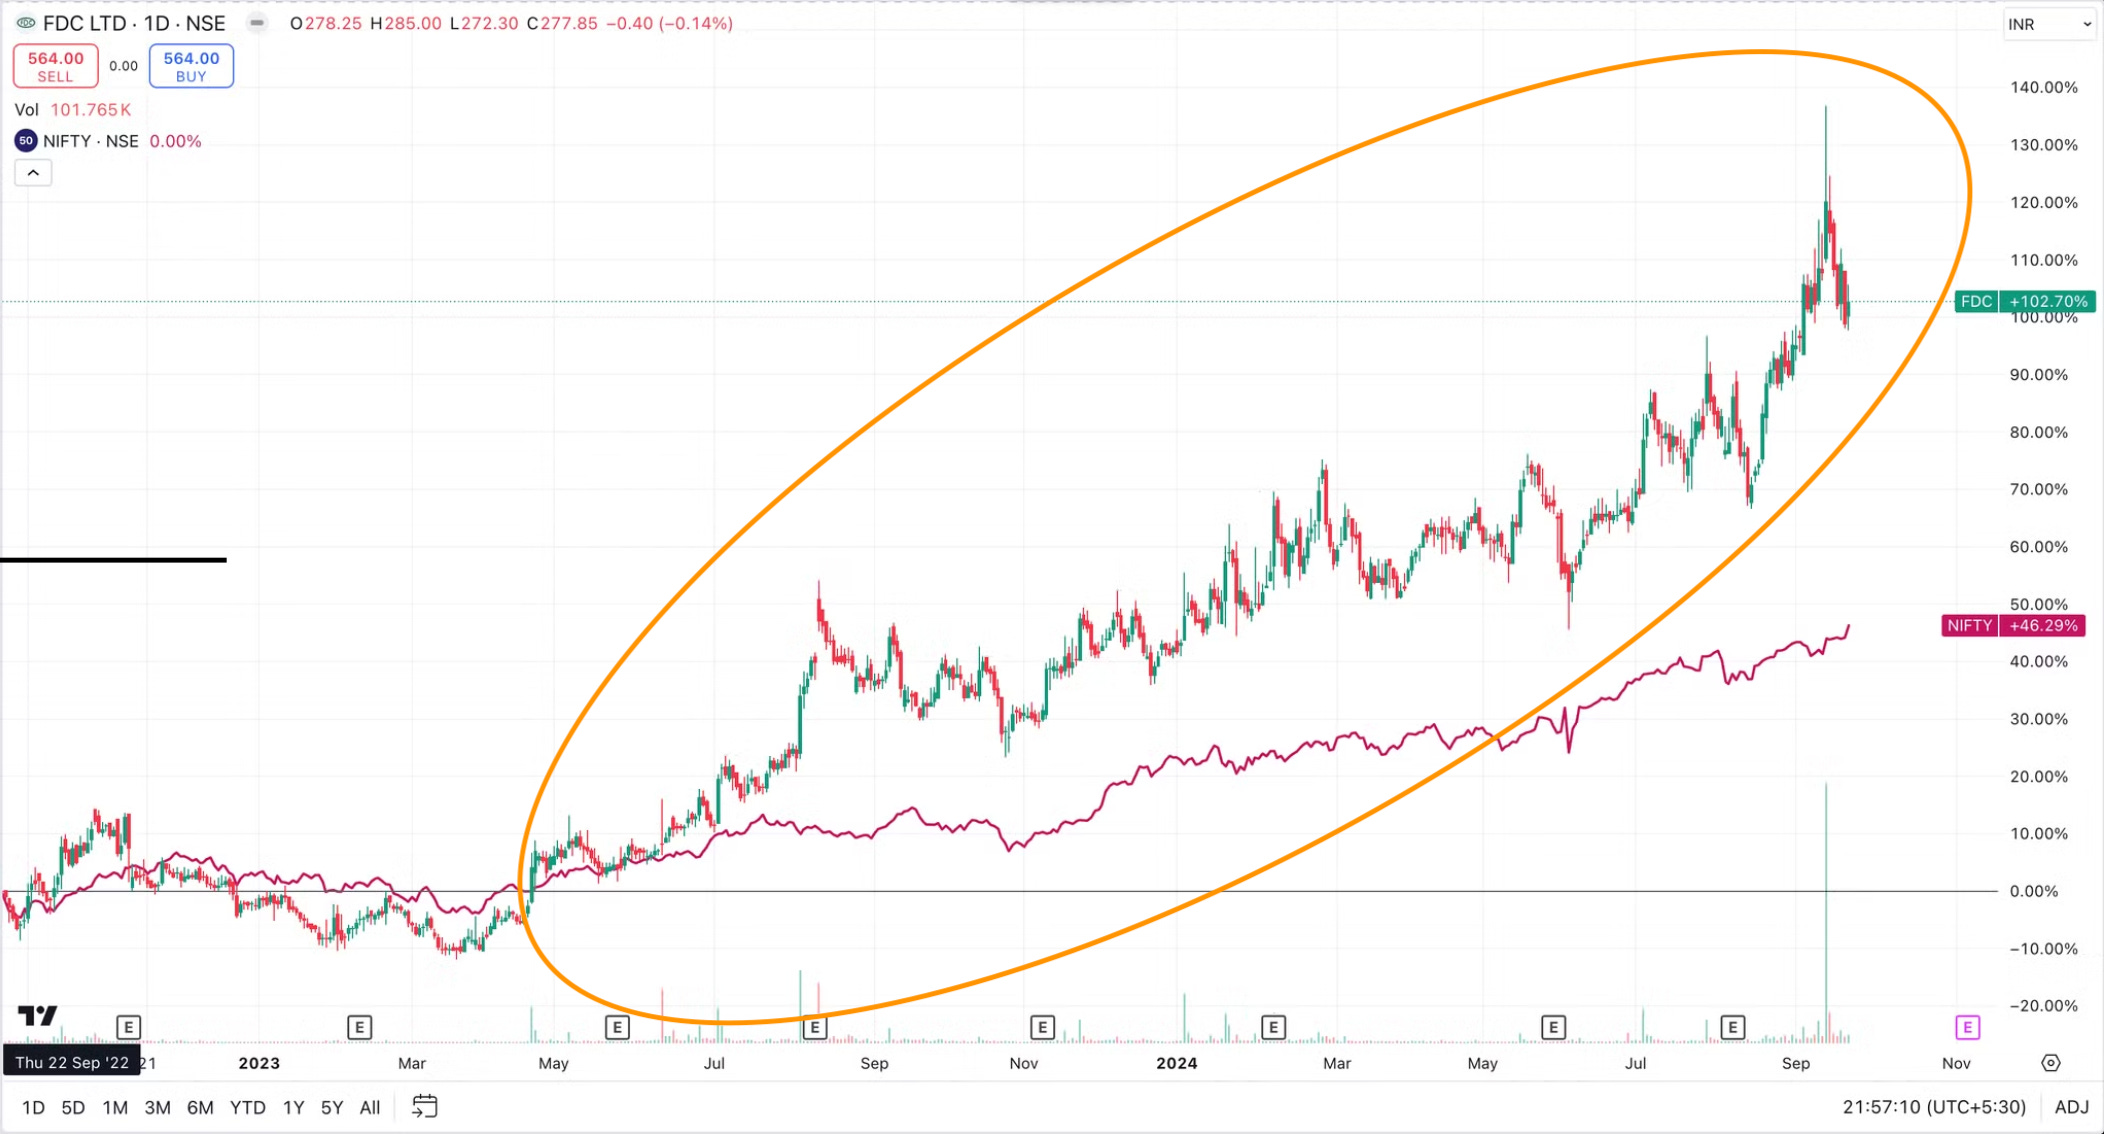
Price Action - Since Sept 22, FDC - 102%, NIFTY 46%
Operational metrics performance- Below chart shows Revenue, Gross, Operating and Net Profit Margin improving quarterly since Jan 2023
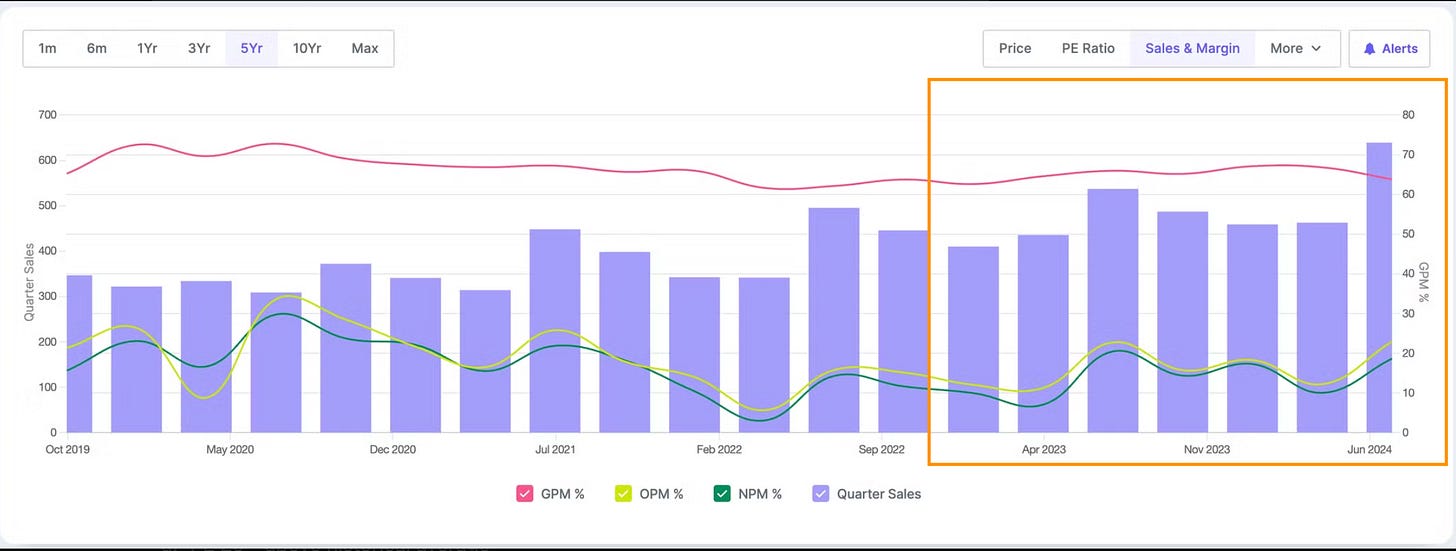
Q1 25 results (QoQ Increase) - Sales by 38% and Profits by 63%
Q1 25 results (YoY increase) - Sales by 19% and Profits by 1%
Valuations and EPS - Below chart shows EPS and Price growth has moved together since April 23 stabilising the PE at 29
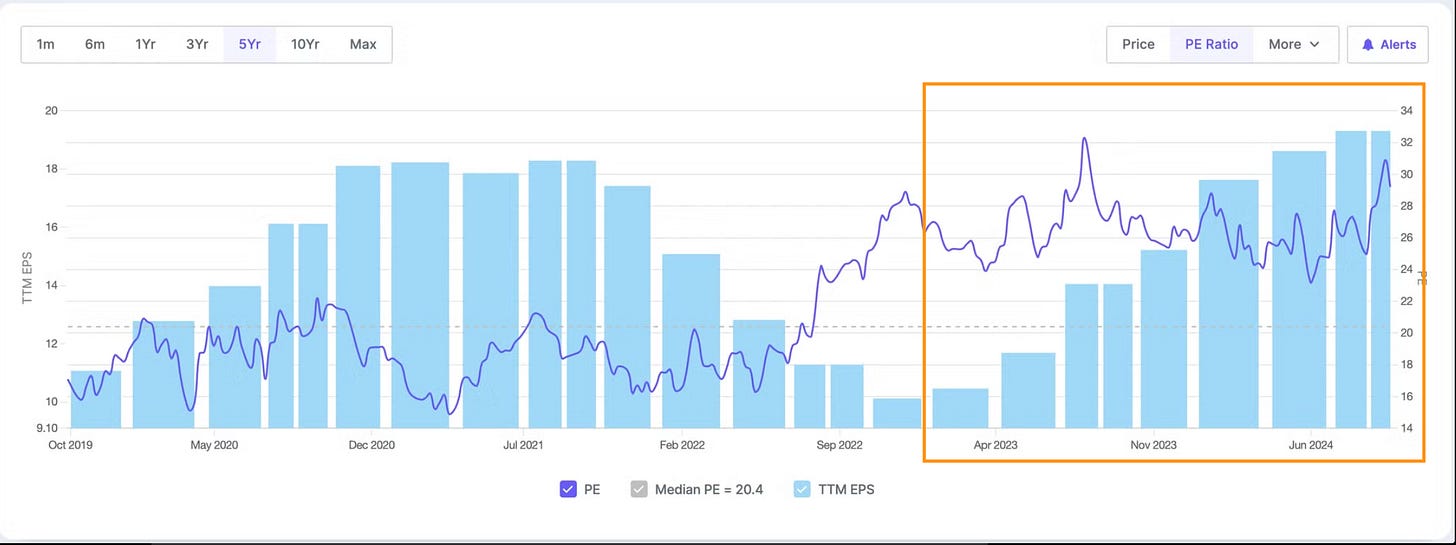
PE 29 - above historical average
TTM EPS (EPS of Last 4 quarters) - Growing consistently QoQ since April 2023
What led to outperformance
No Q1 25 Concall published
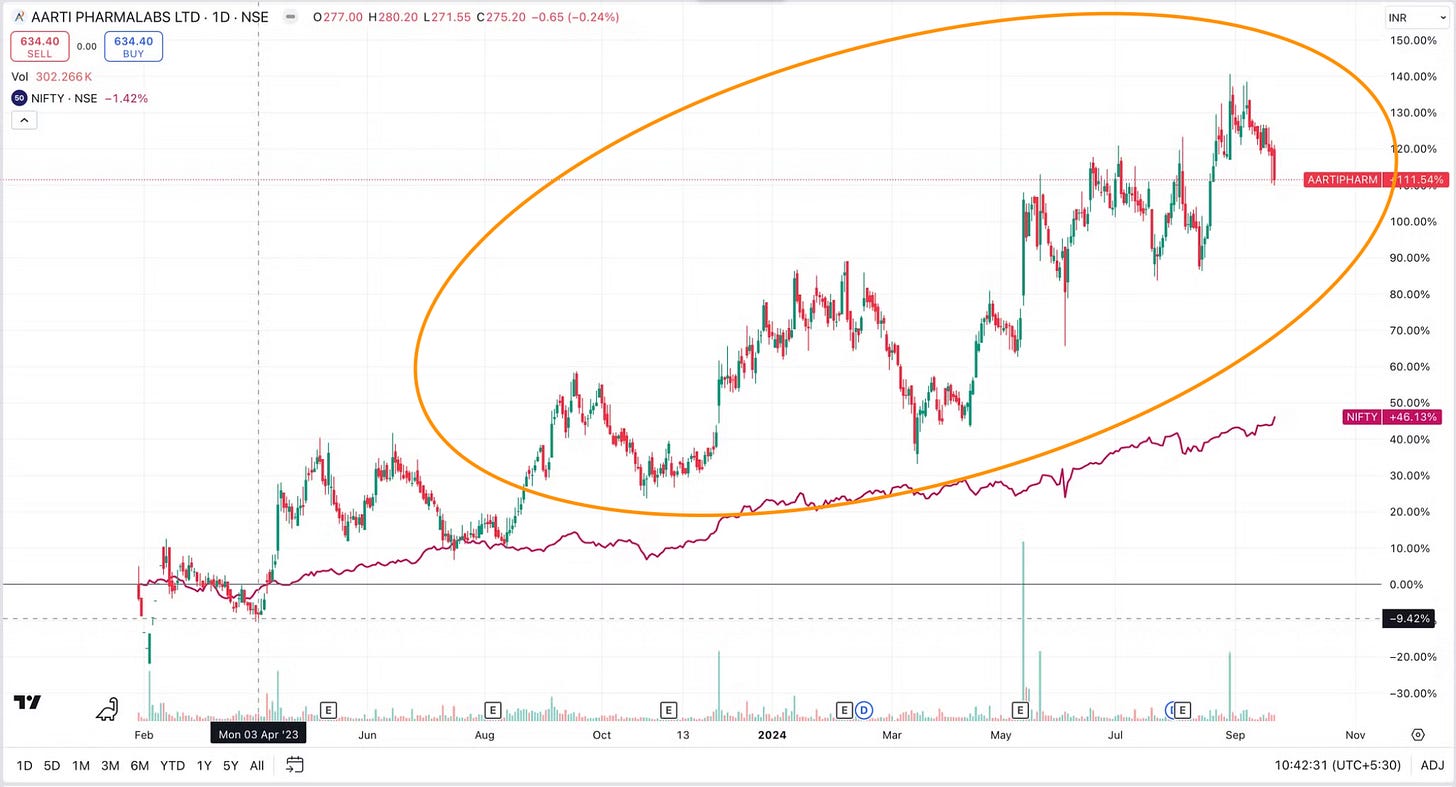
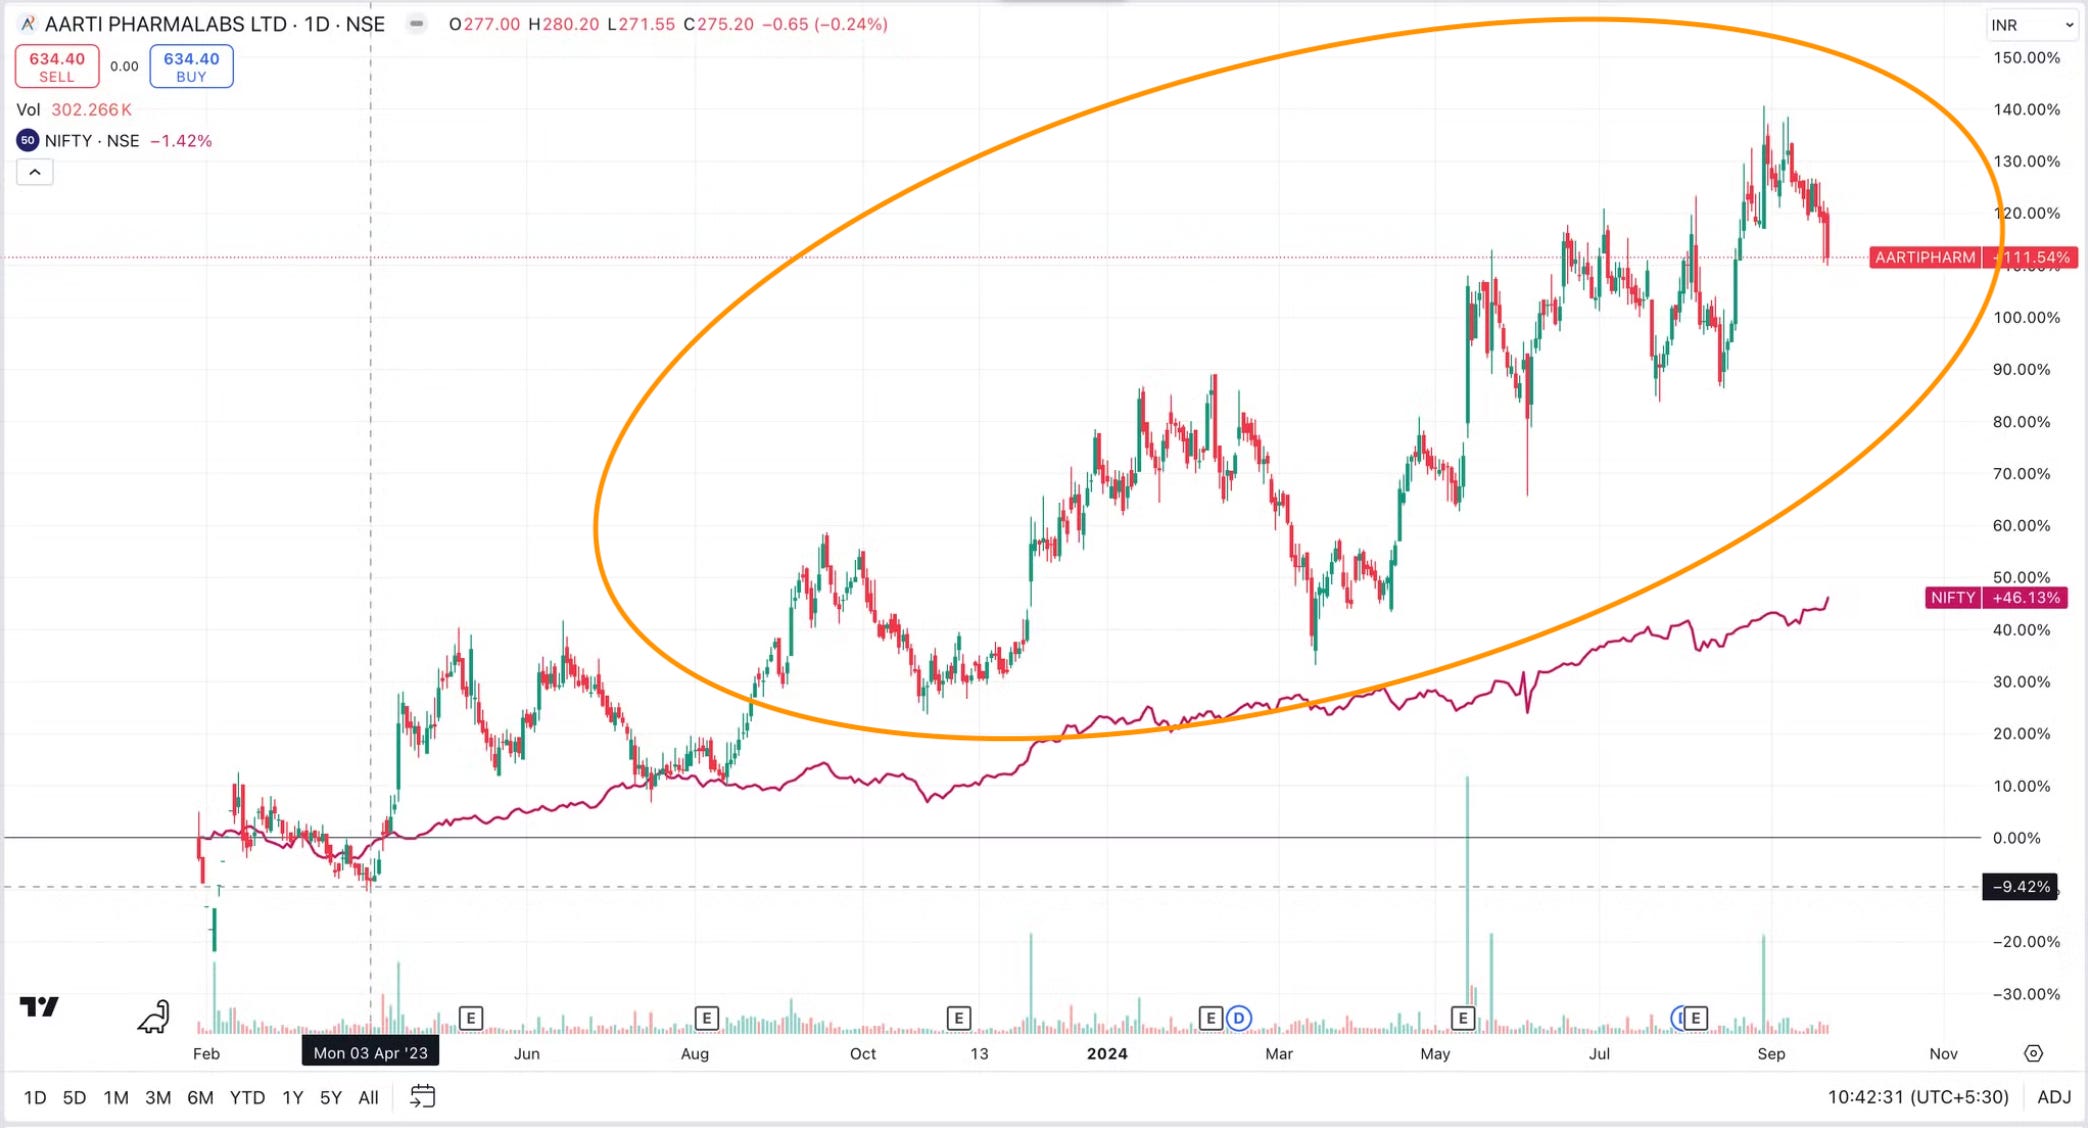
Aarti Pharma - Market Cap 5,777+ Cr
Price Action - Since Sept 22, Aartipharm - 111%, NIFTY 46%
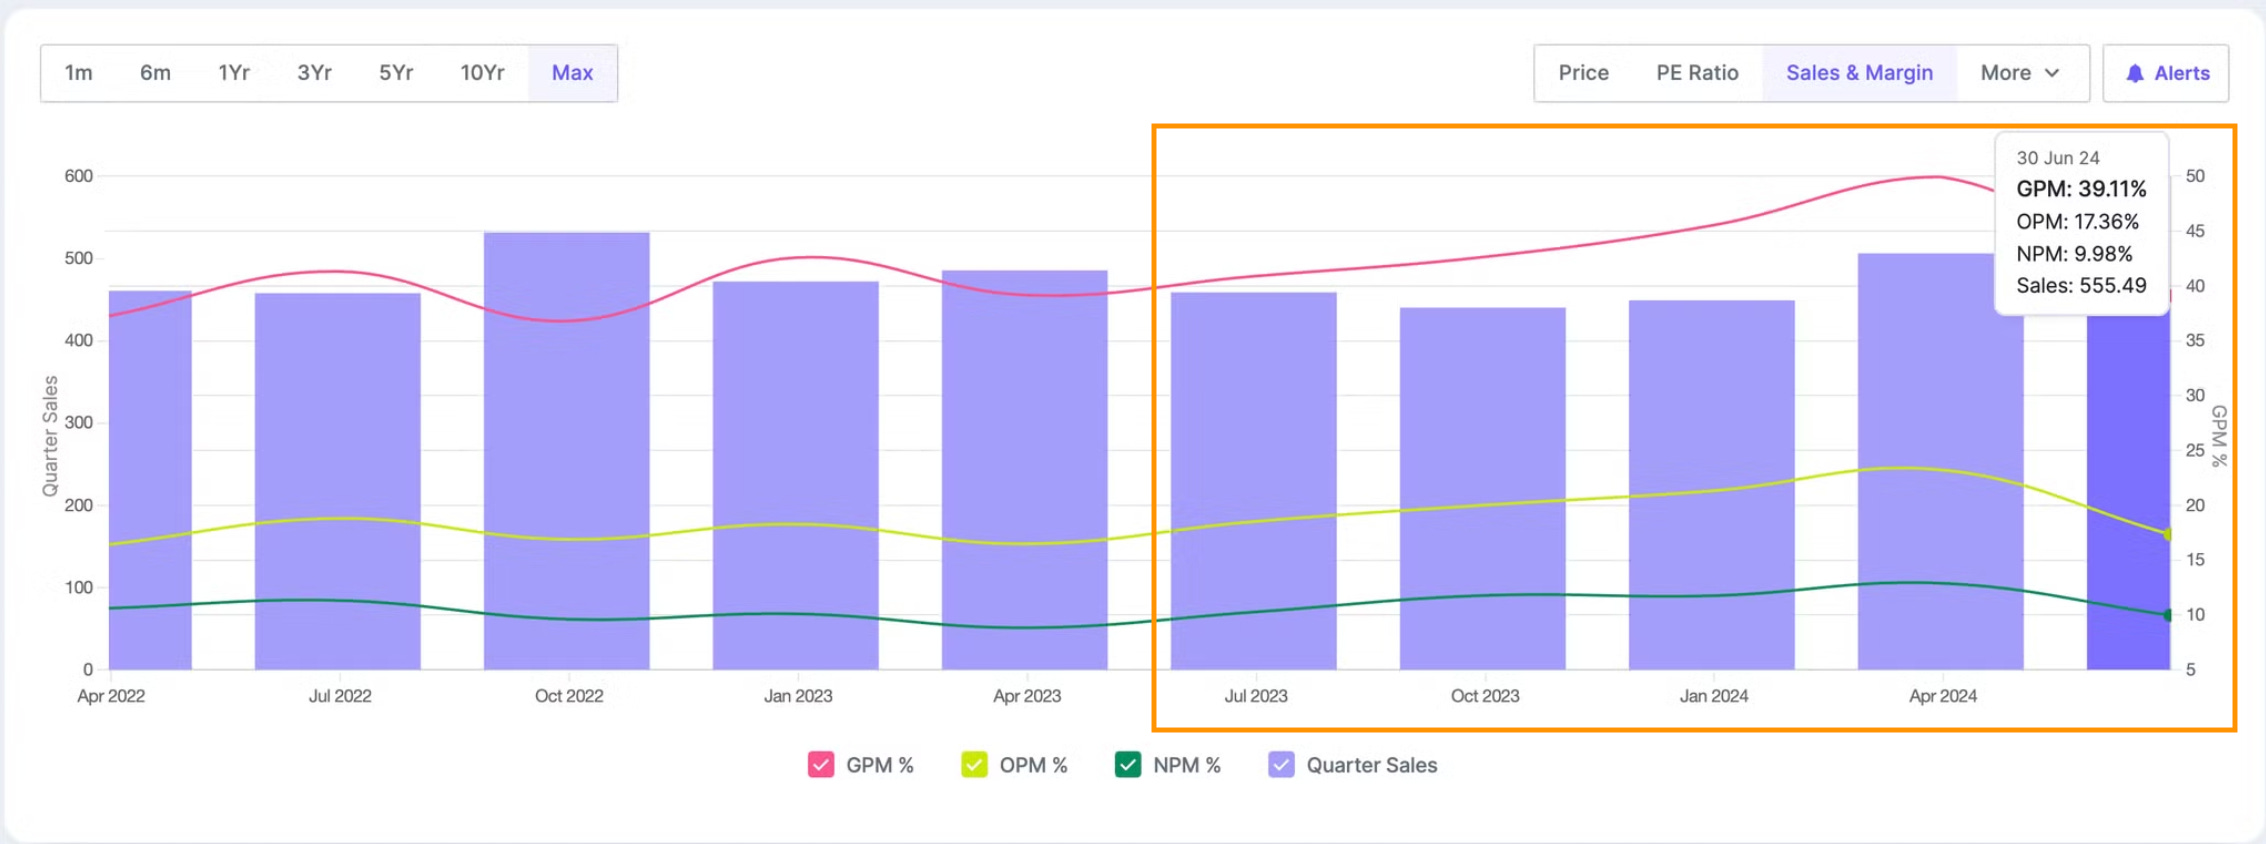
Operational metrics performance- Below chart shows Revenue, Gross, Operating and Net Profit Margin improving quarterly since July 2023
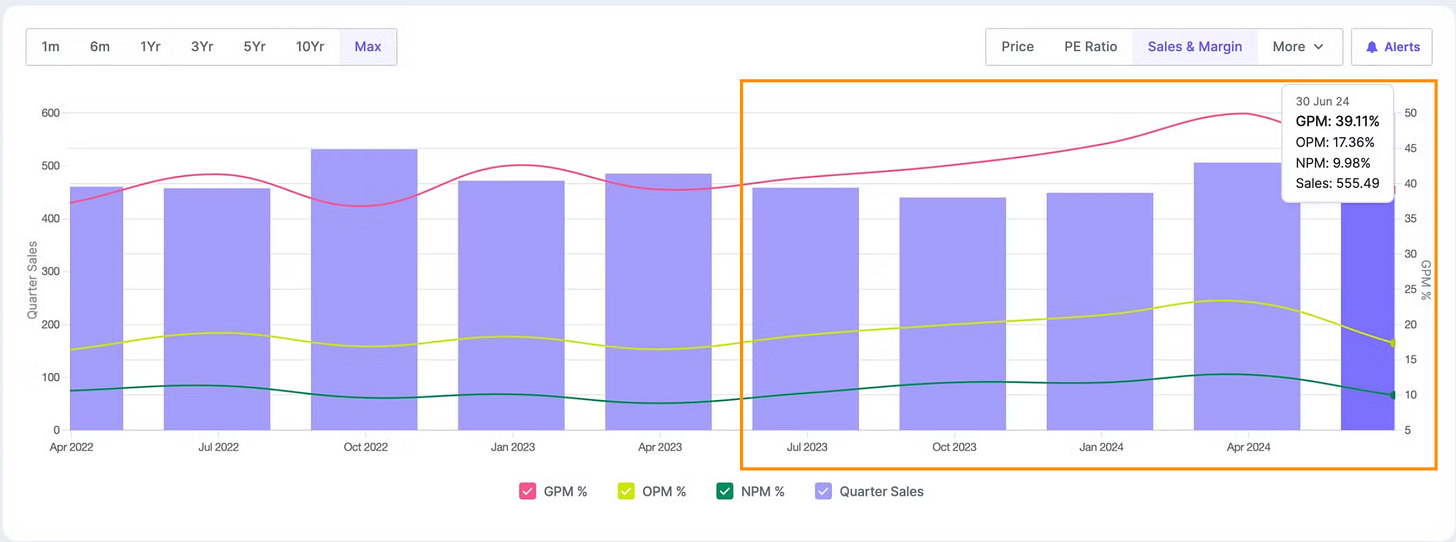
Q1 25 results (QoQ Increase)- Sales by 10% and Profits down by 1%
Q1 25 results (YoY increase) - Sales increase by 21% and Profits down by 6%
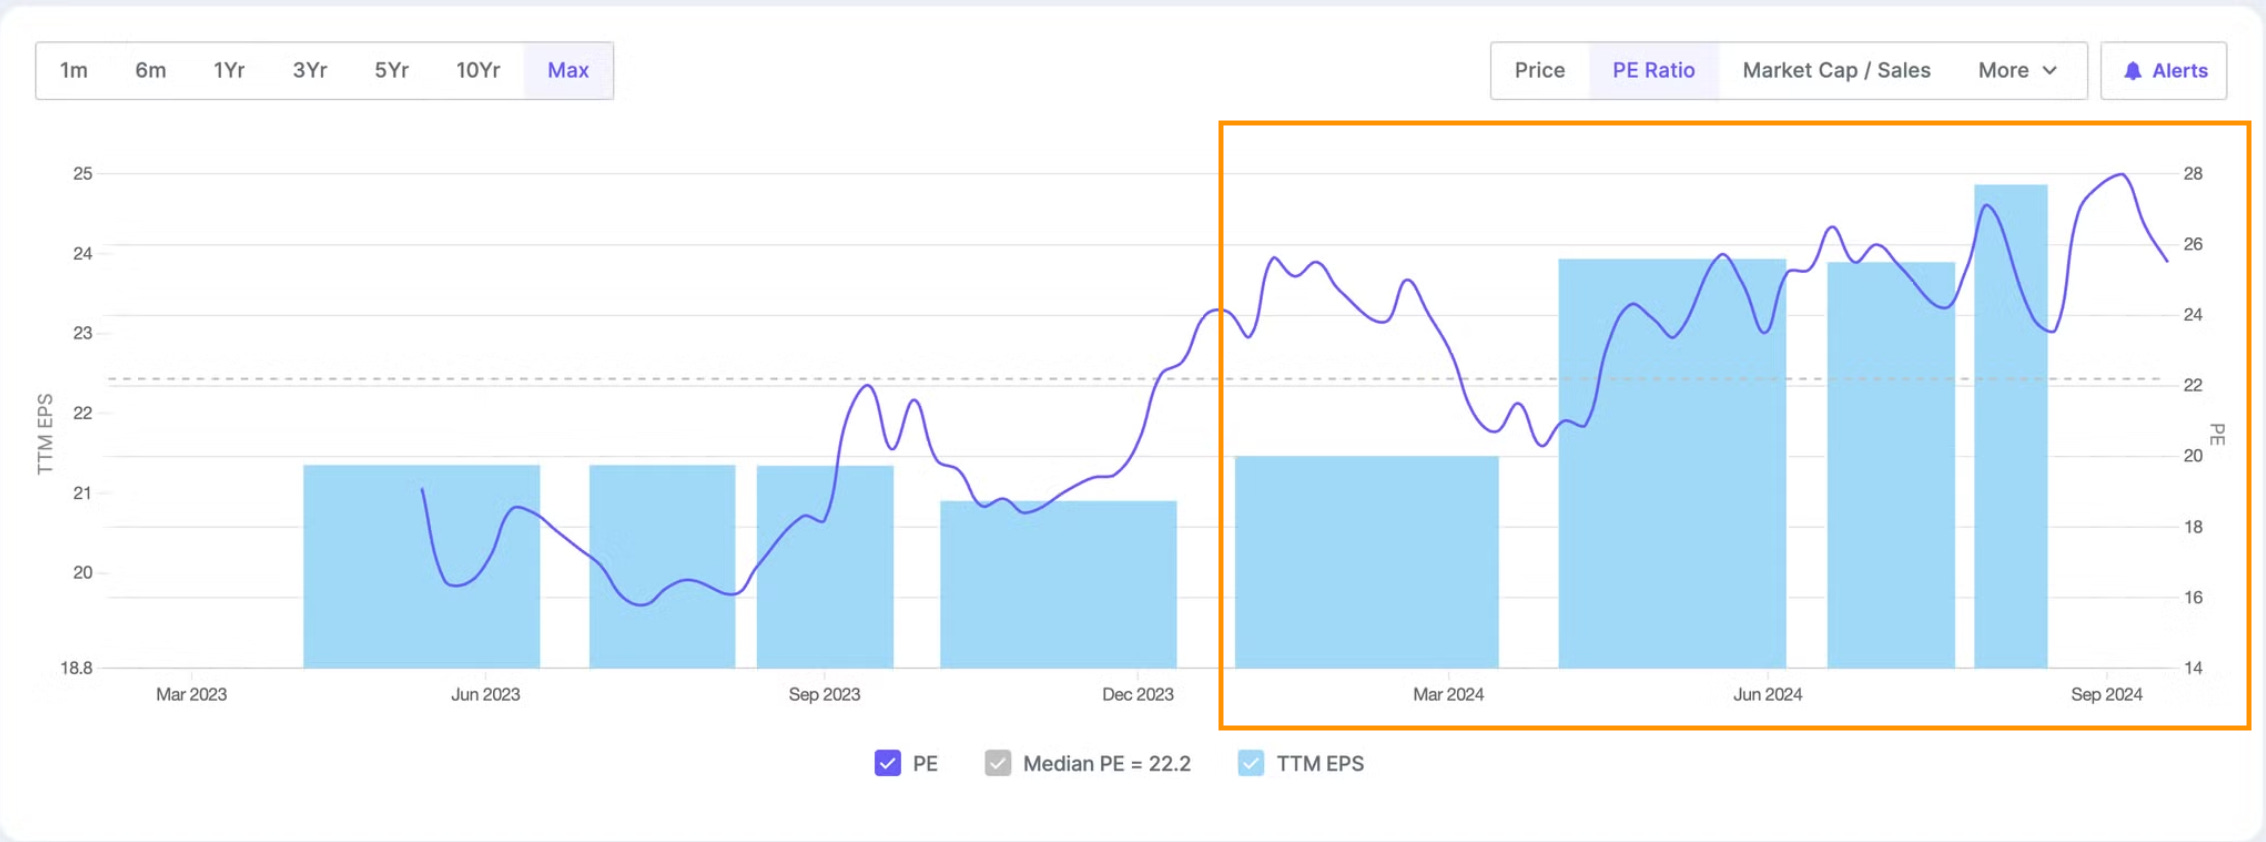
Valuations and EPS - Below chart shows Price growth is faster than EPS growth since March 24 leading to PE increasing to 25.6
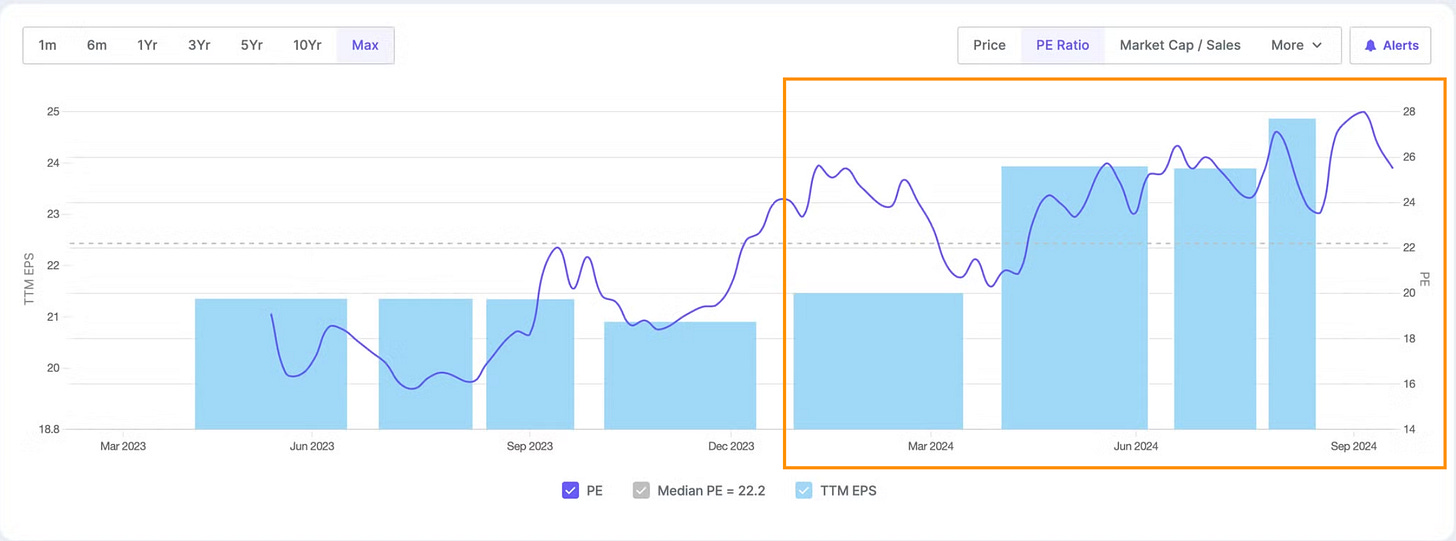
PE 25.6 - above historical average
TTM EPS (EPS of Last 4 quarters) - Growing consistently QoQ since Dec 2023
What led to outperformance
Revenue Growth
Consolidated top line up 27% YoY to Rs. 555 crores
Xanthine Derivatives
Contributed 54% of turnover; international revenues growing
CDMO/CMO Business
53 active projects with 18 customers; 25-30% Y-o-Y growth expected in FY25
API and Intermediates
Contributed 44% of turnover; 55% from regulated markets
Capacity Expansion
Xanthine capacity to reach 9000 MT by FY26 ; Atali project to add 500 KL capacity
Margins
Consolidated EBITDA up 14% YoY to Rs. 96.4 crores
Regulatory Environment
Biosecure Act in US driving more inquiries from non-Chinese suppliers
Solar Power Plant
New plant at Akola to generate 1/3rd of power requirement
Granules - Market Cap 13,648 + Cr
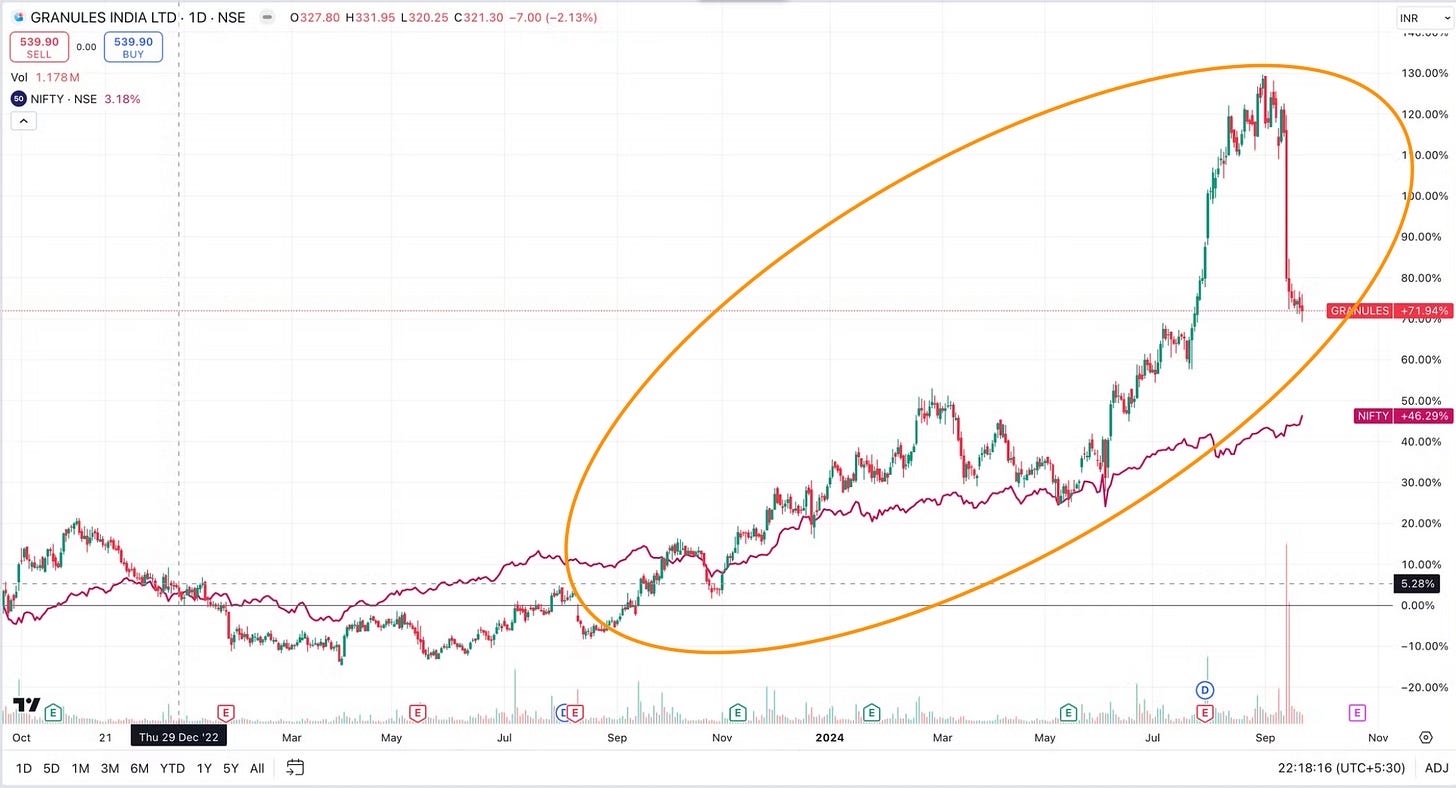
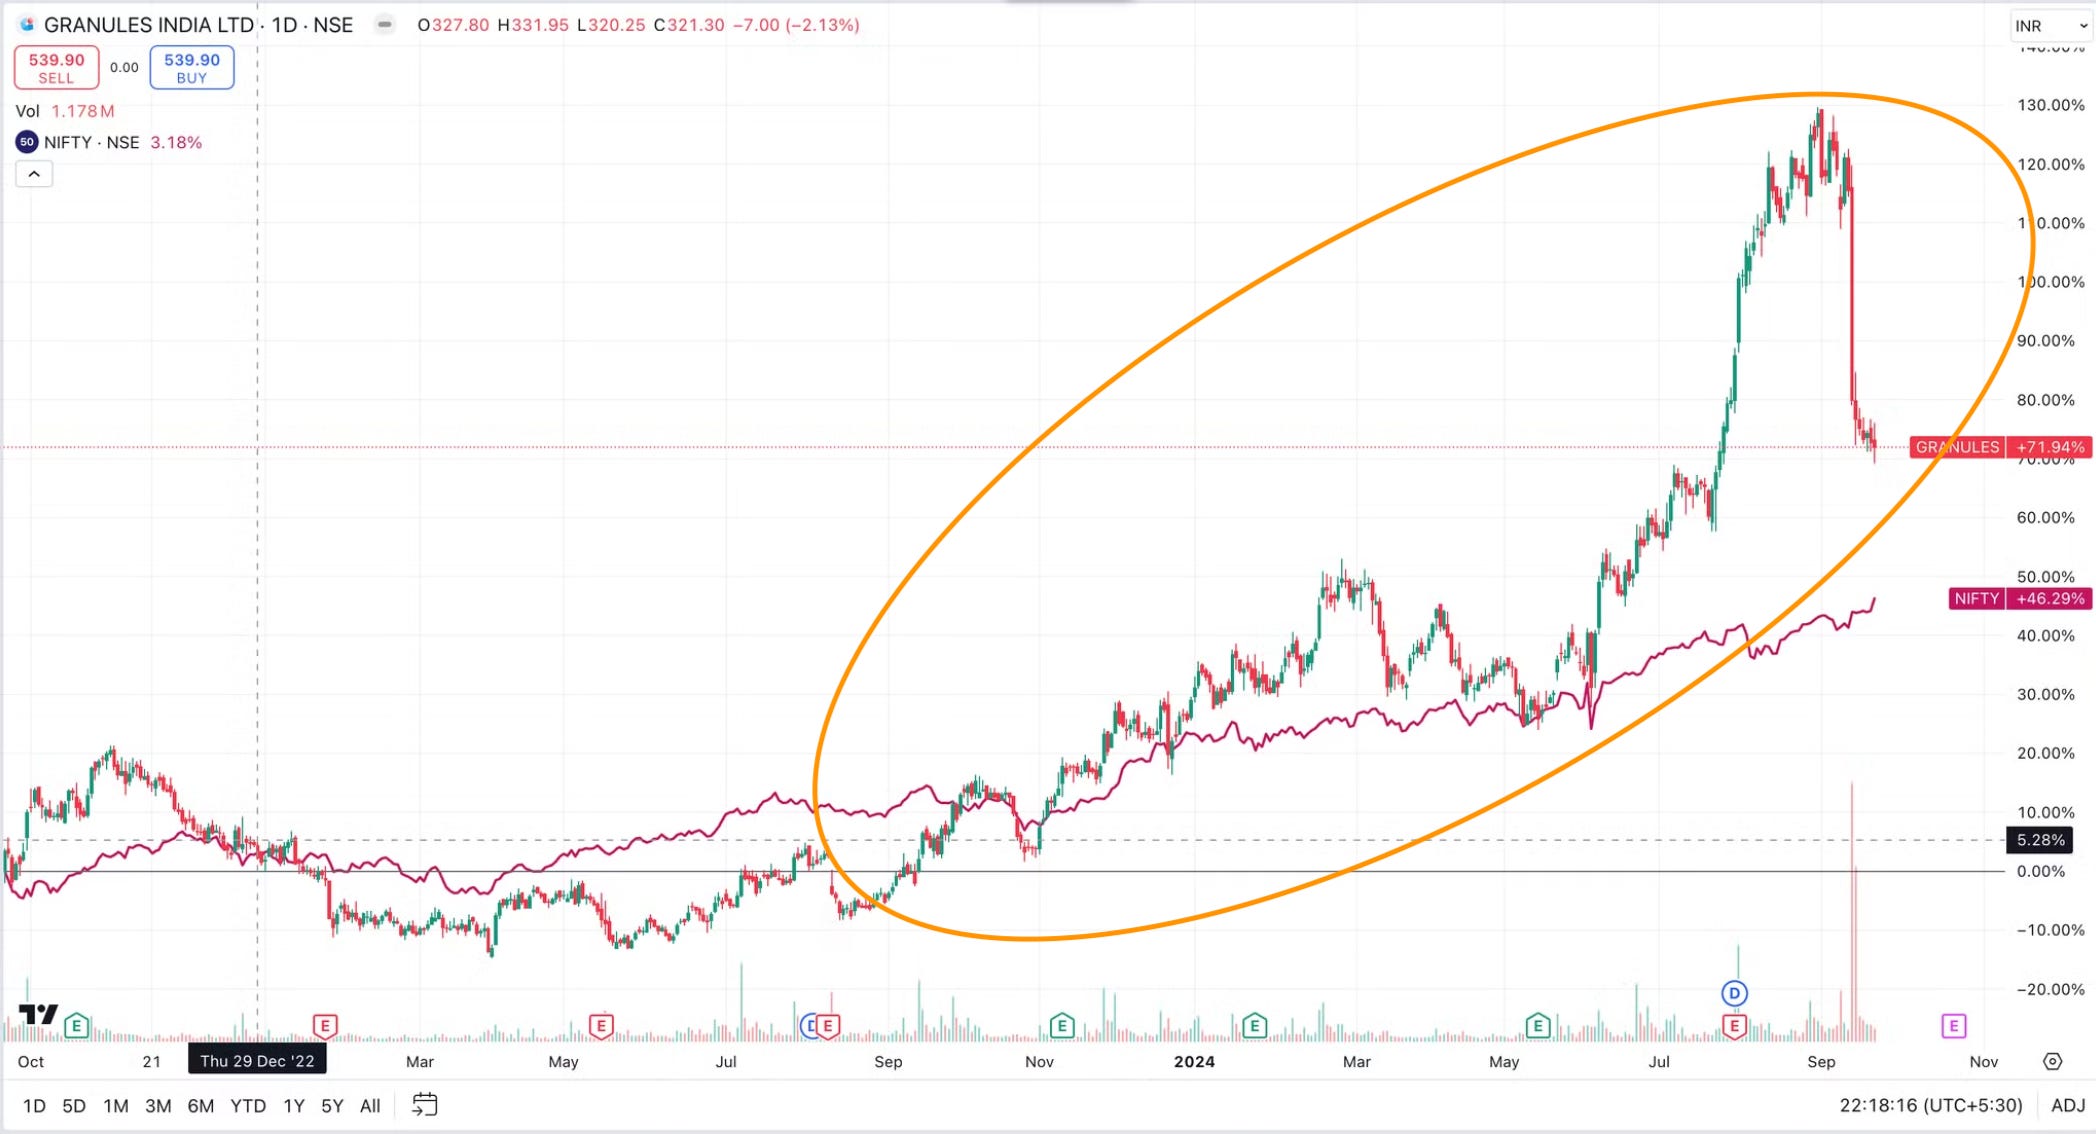
Price Action - Since Sept 22, Granules - 71%, NIFTY 46%
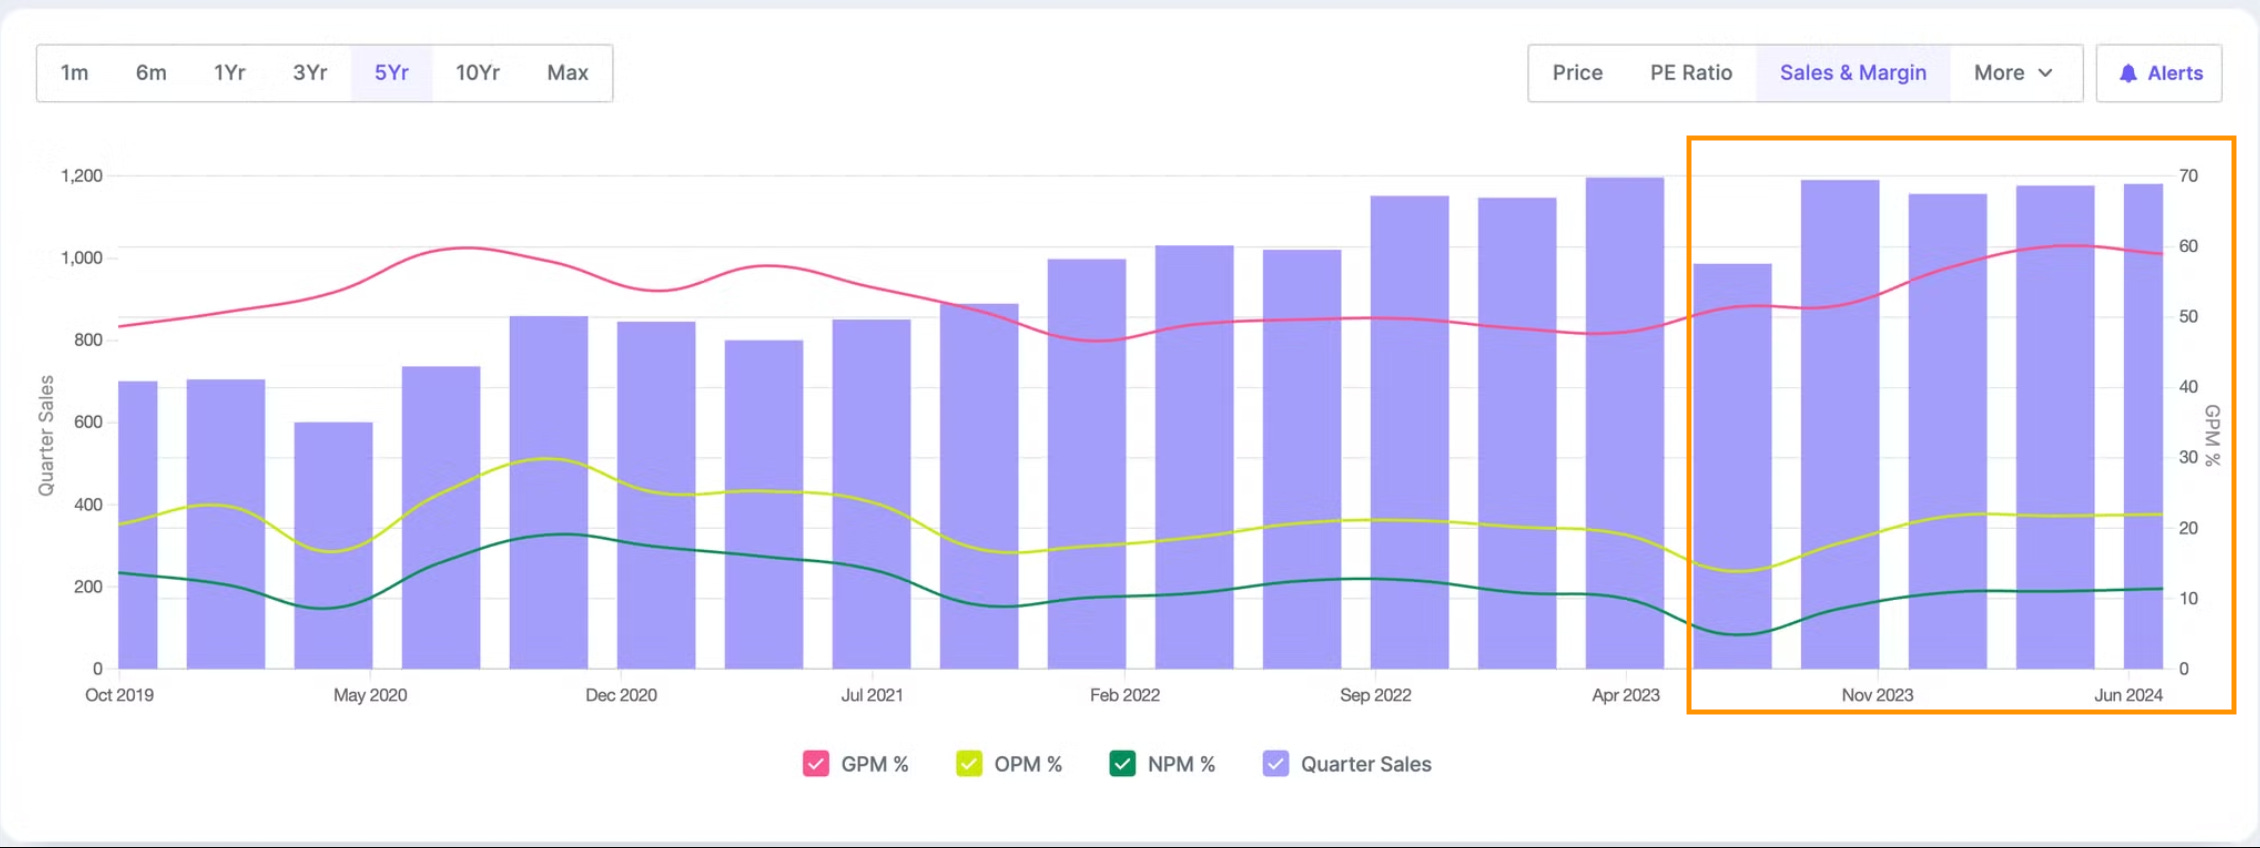
Operational metrics performance- Below chart shows Revenue, Gross, Operating and Net Profit Margin improving quarterly since July 2023
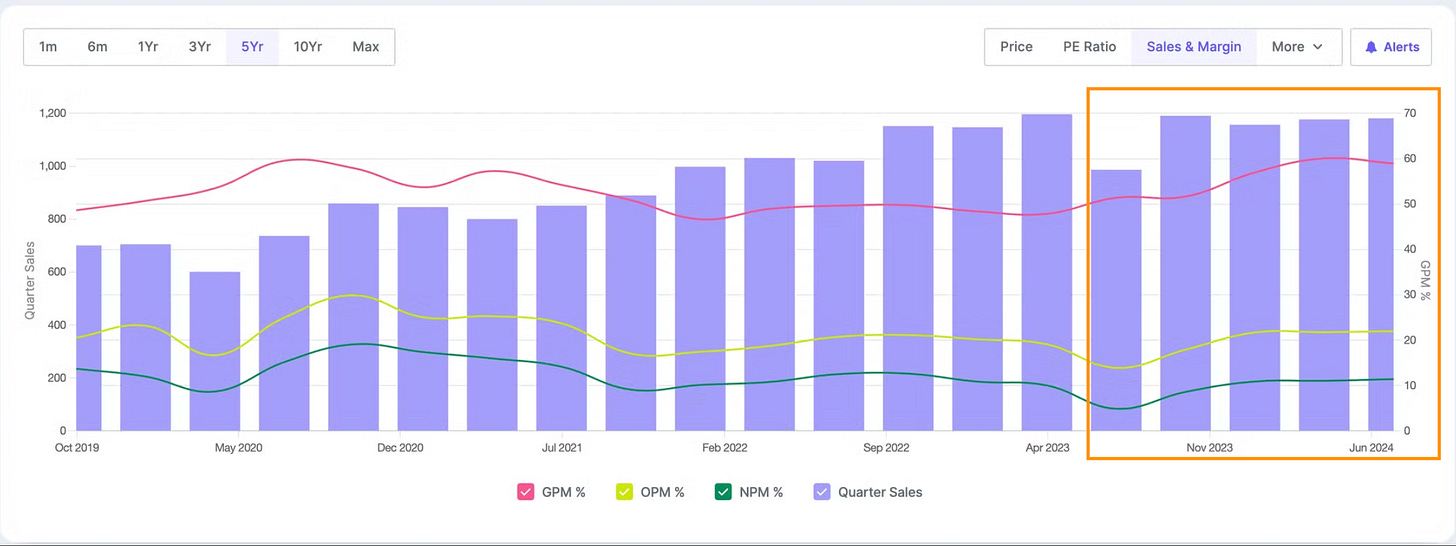
Q1 25 results (QoQ Increase) - Sales increase by 0% and Profits increase by 8%
Q1 25 results (YoY increase) - Sales increase by 20% and Profits increase by 58%
Valuations and EPS - Below chart shows Price growth is faster than EPS growth since Nov 23 leading to PE increasing to 26
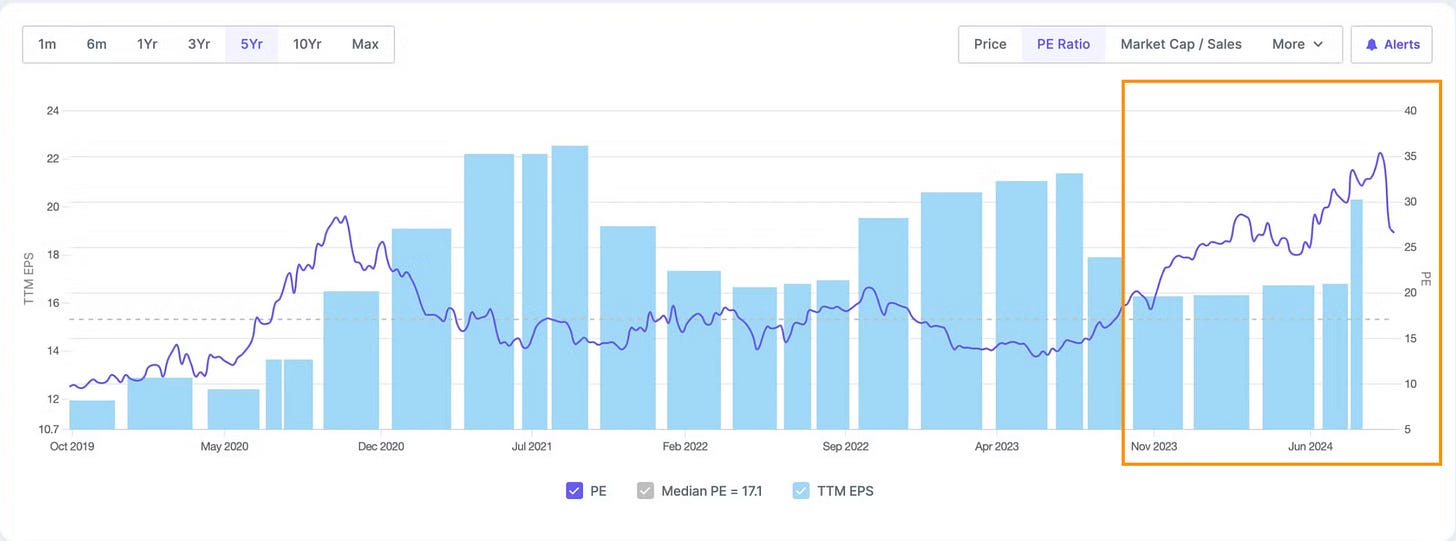
PE 26 - above historical average
TTM EPS (EPS of Last 4 quarters) - Growing slightly QoQ since Dec 2023 and then sharp increase in Q1 25
What led to outperformance
Revenue Growth
Overall revenue up 20% YoY to Rs. 11,799 million
Formulations Business
FD sales contribute 76% of revenue, up from 65% in FY24
US Market Performance
North America sales grew 45% YoY
New Products
Sales from new products beyond legacy five contribute 35% of revenue
Gross Margins
Improved to 58.9% from 51.4% in Q1 FY24
EBITDA
Rs. 2,593 million, 22% of sales, up 89% YoY
Capacity Expansion
New formulation facility at Genome Valley commenced operations
Pipeline Development
Progress in oncology, ADHD, and enzyme technology platforms
OTC Business
Contributes 15% to overall sales, growing in strong double digits
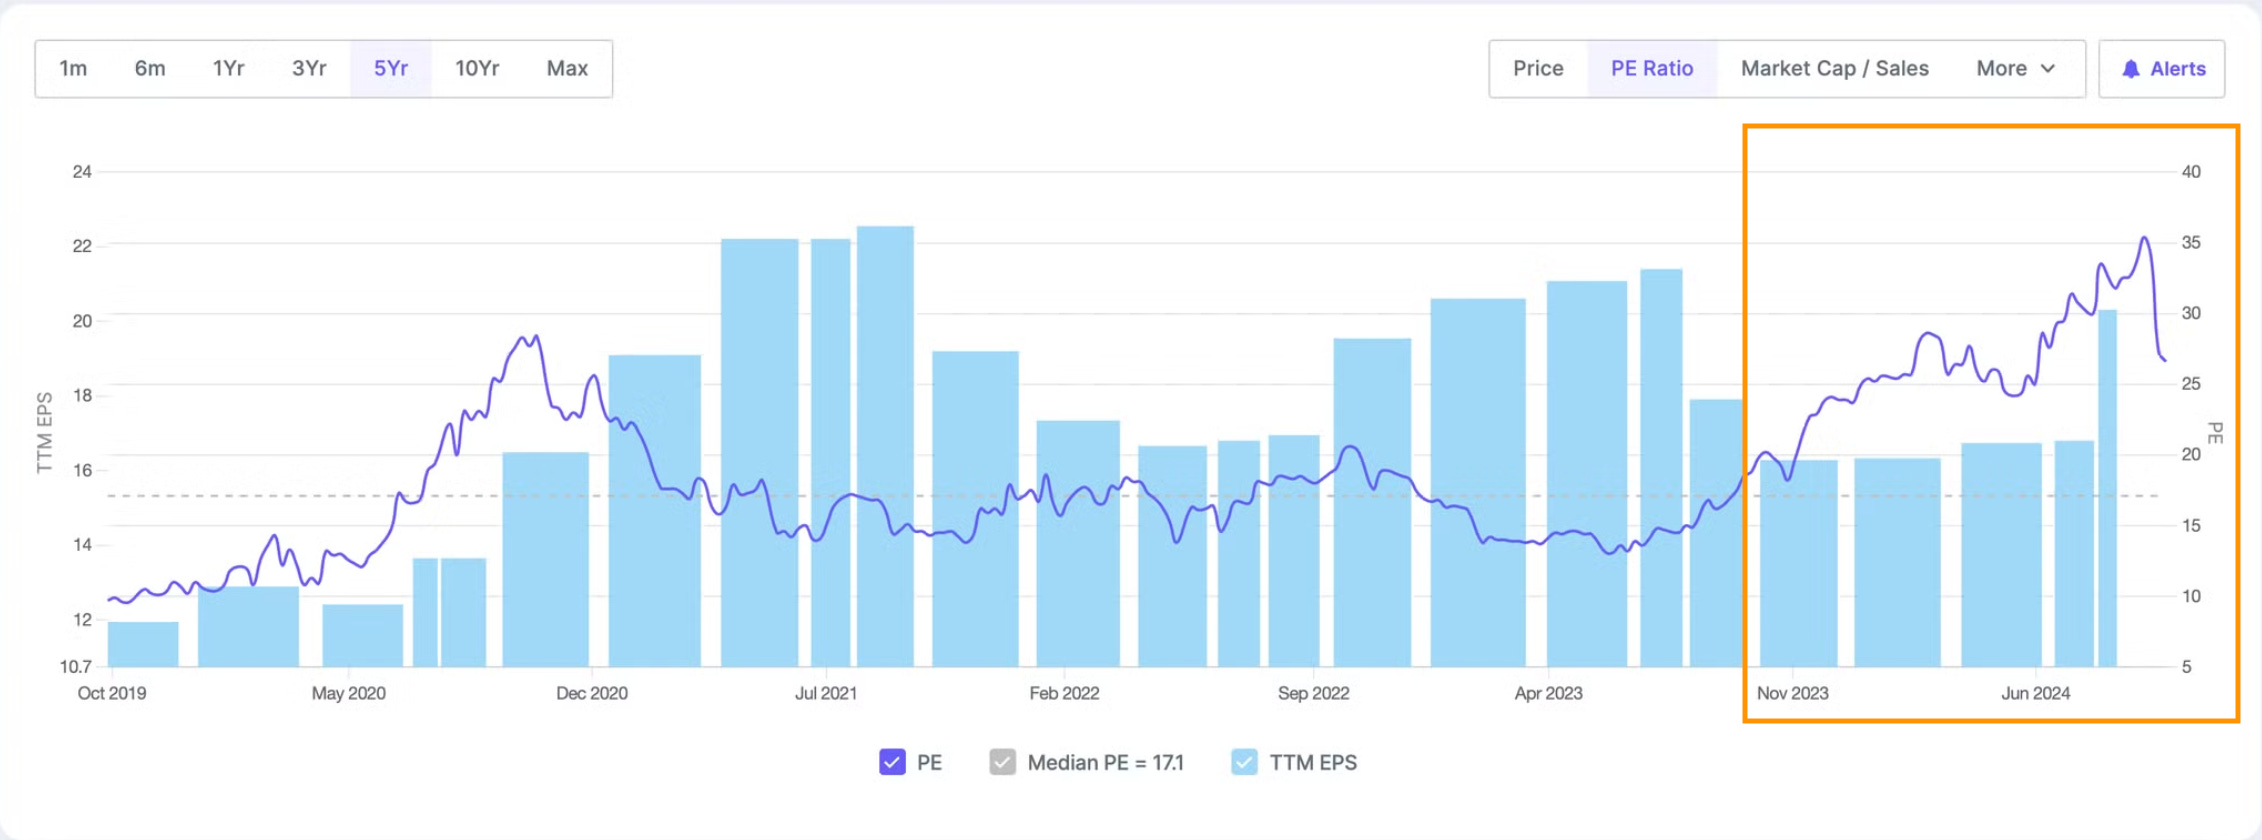
Advanced Enzymes - Market Cap 5,772 + Cr
Price Action - Since Sept 22, Advanced Enzymes - 80%, NIFTY 46%
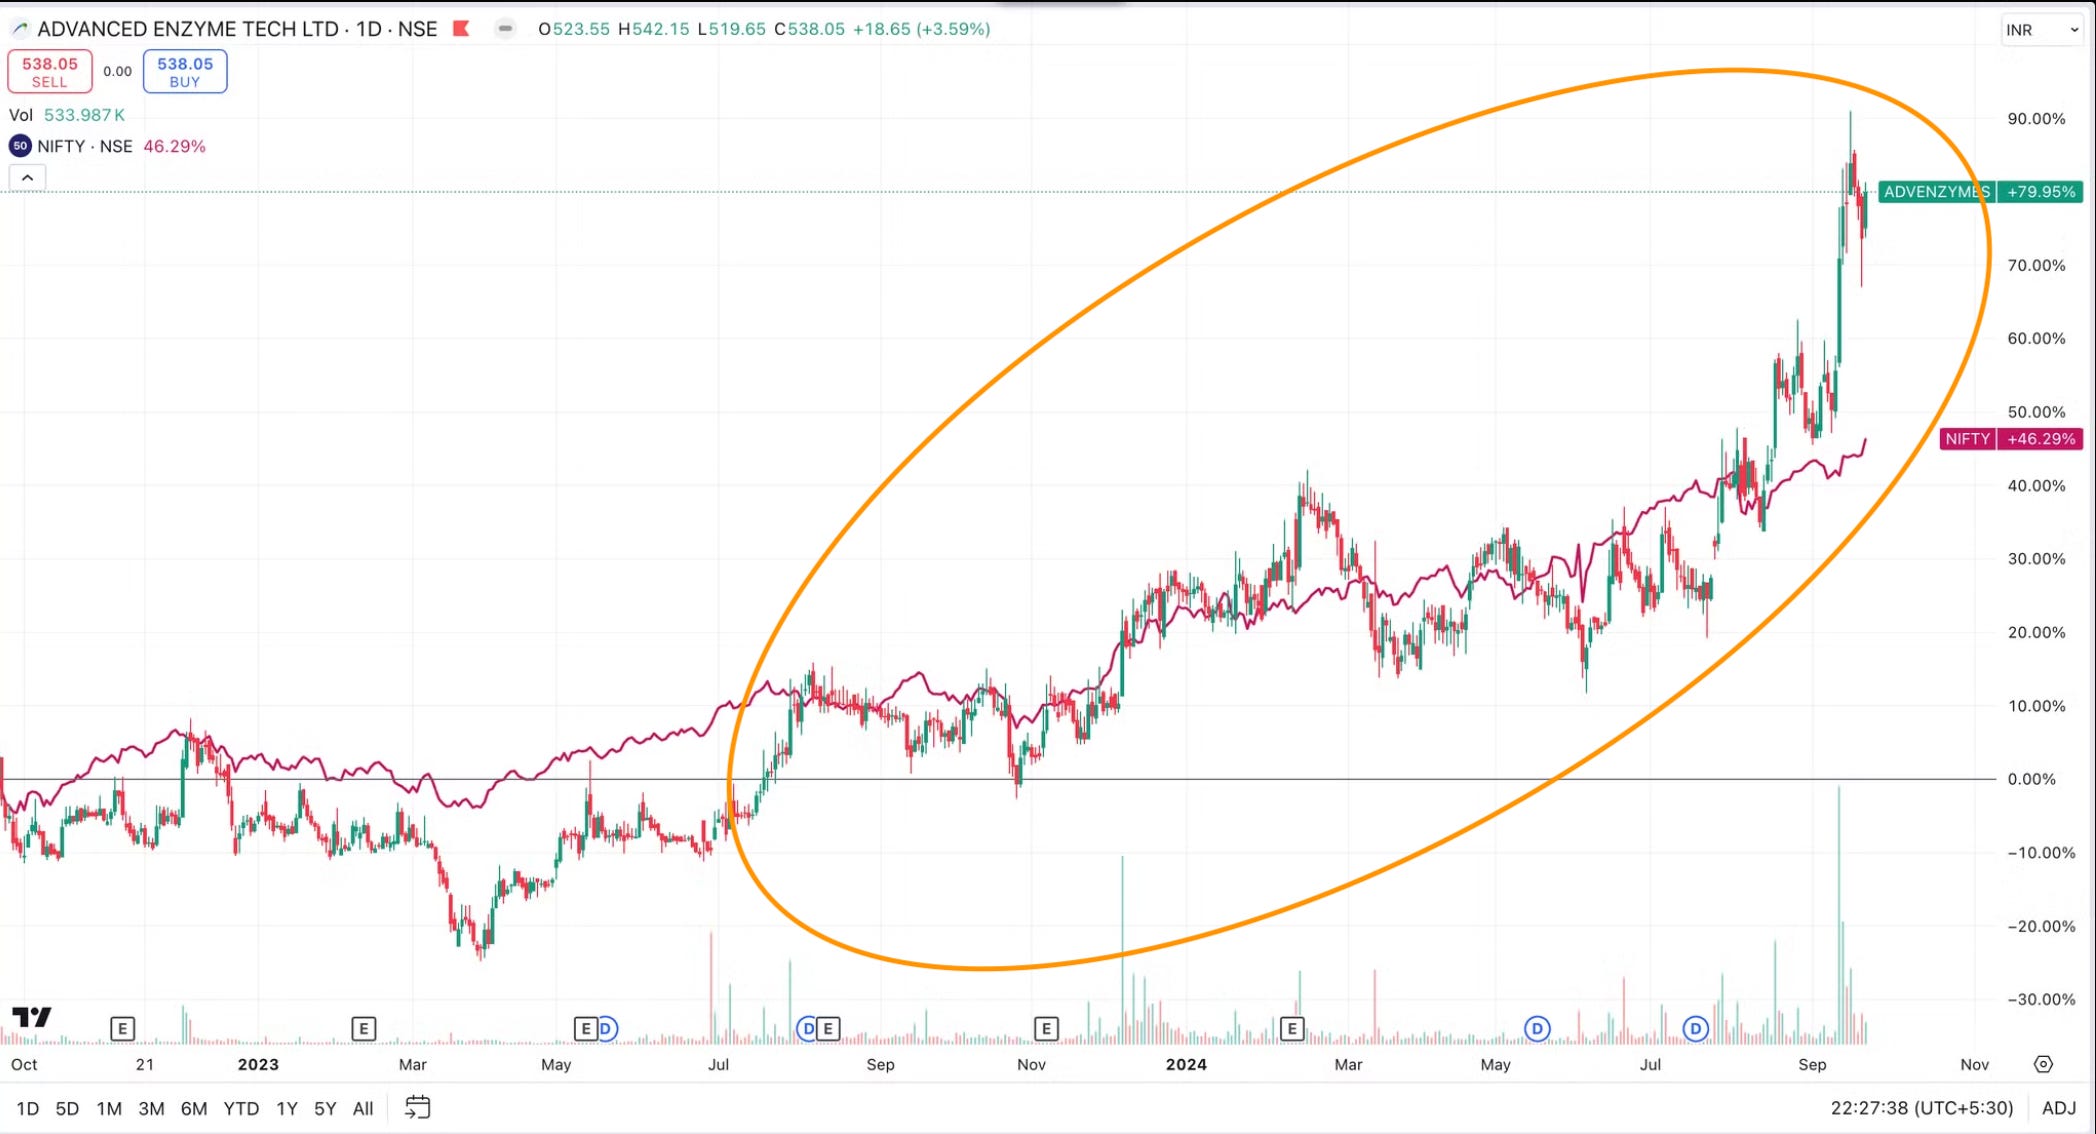
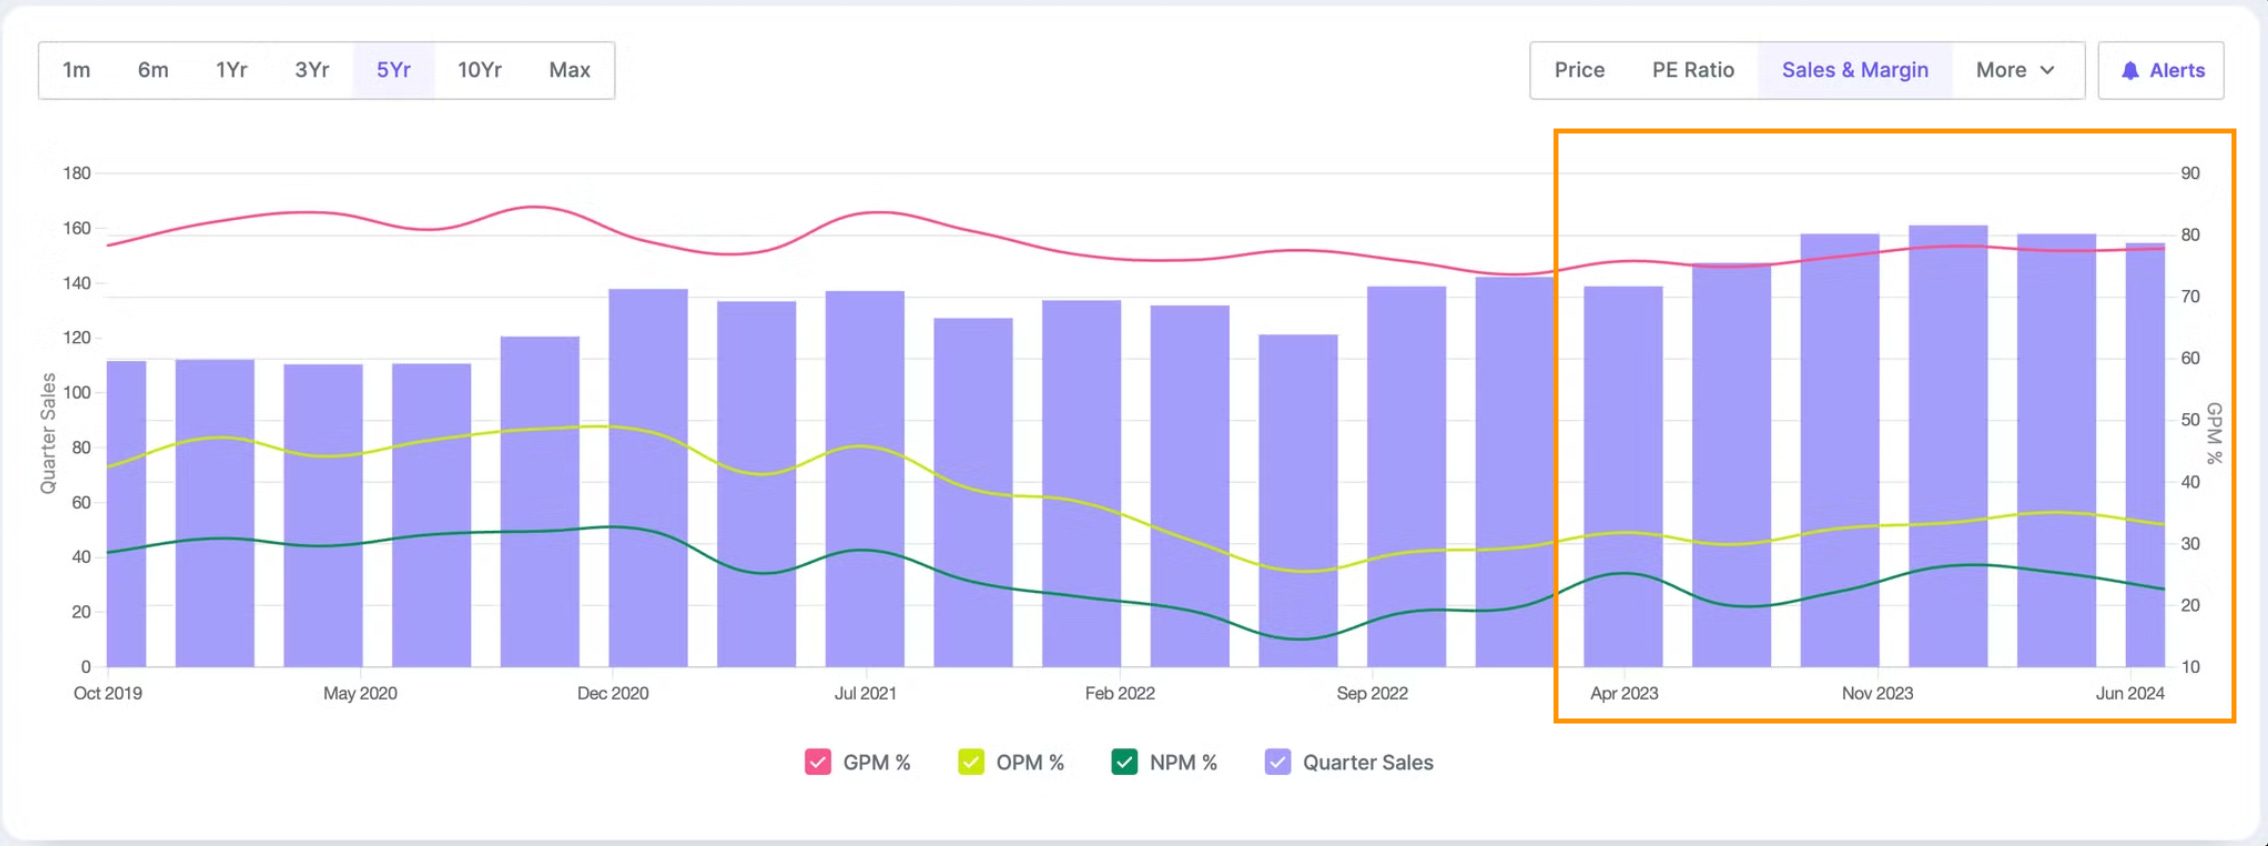
Operational metrics performance - Below chart shows Revenue, Gross, Operating and Net Profit Margin improving quarterly since Jan 2023
Q1 25 results (QoQ Increase) - Sales increased by 2% and Profits increased by 13%
Q1 25 results (YoY increase) - Sales increased by 5% and Profits increased by 11%
Valuations and EPS - Below chart shows Price and EPS growth was same from April 23 till July 24 then price escalated leading to PE increasing to 40
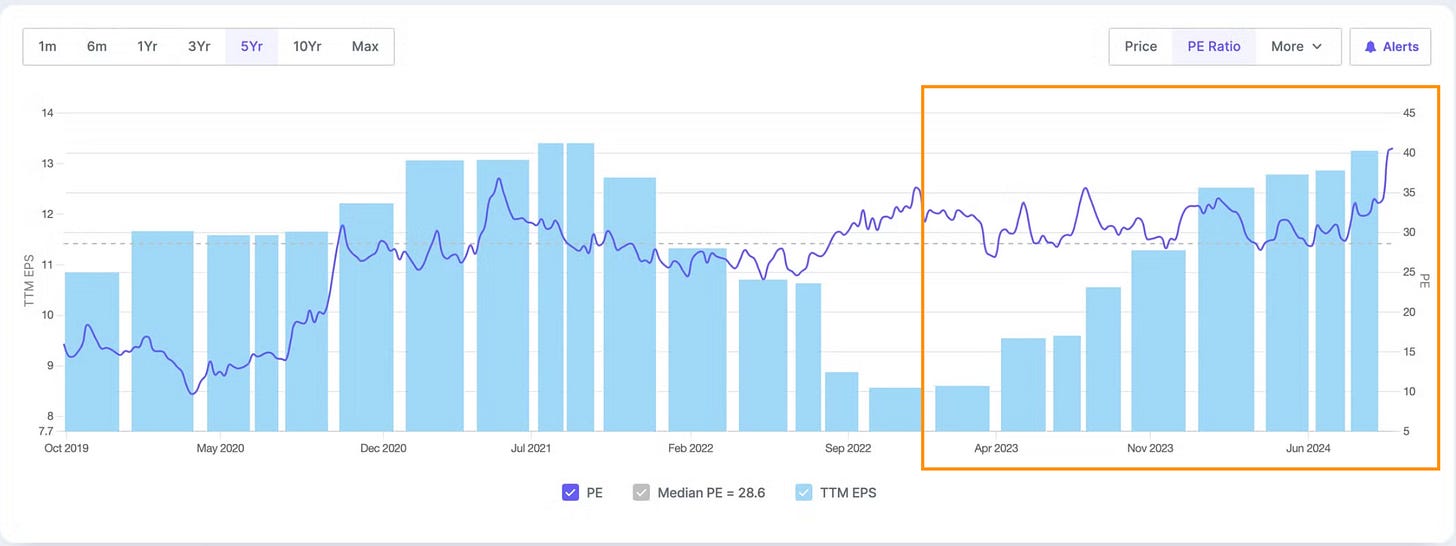
PE 40 - above historical average
TTM EPS (EPS of Last 4 quarters) - Growing consistently QoQ since April 2023
What led to outperformance
Revenue Growth
Overall revenue up 5% YoY to INR 1,545 million
EBITDA
Up 16% YoY to INR 512 million; 33% margin
Segment Performance
Bio-processing grew 12% YoY; Animal Nutrition up 9% YoY
US Market
Strong growth in US sales, up from INR 422 million to INR 494 million YoY
New Products
50 products in pipeline; some in final stages
Capacity Utilization
Currently at 60-65%
R&D Investments
Spent INR 76 million (4% of sales) on R&D
Margins
Expecting 33-34% EBITDA margins for the year
Growth Outlook
Targeting 12-15% growth for FY25
International Expansion
Focusing on US market for new product launches
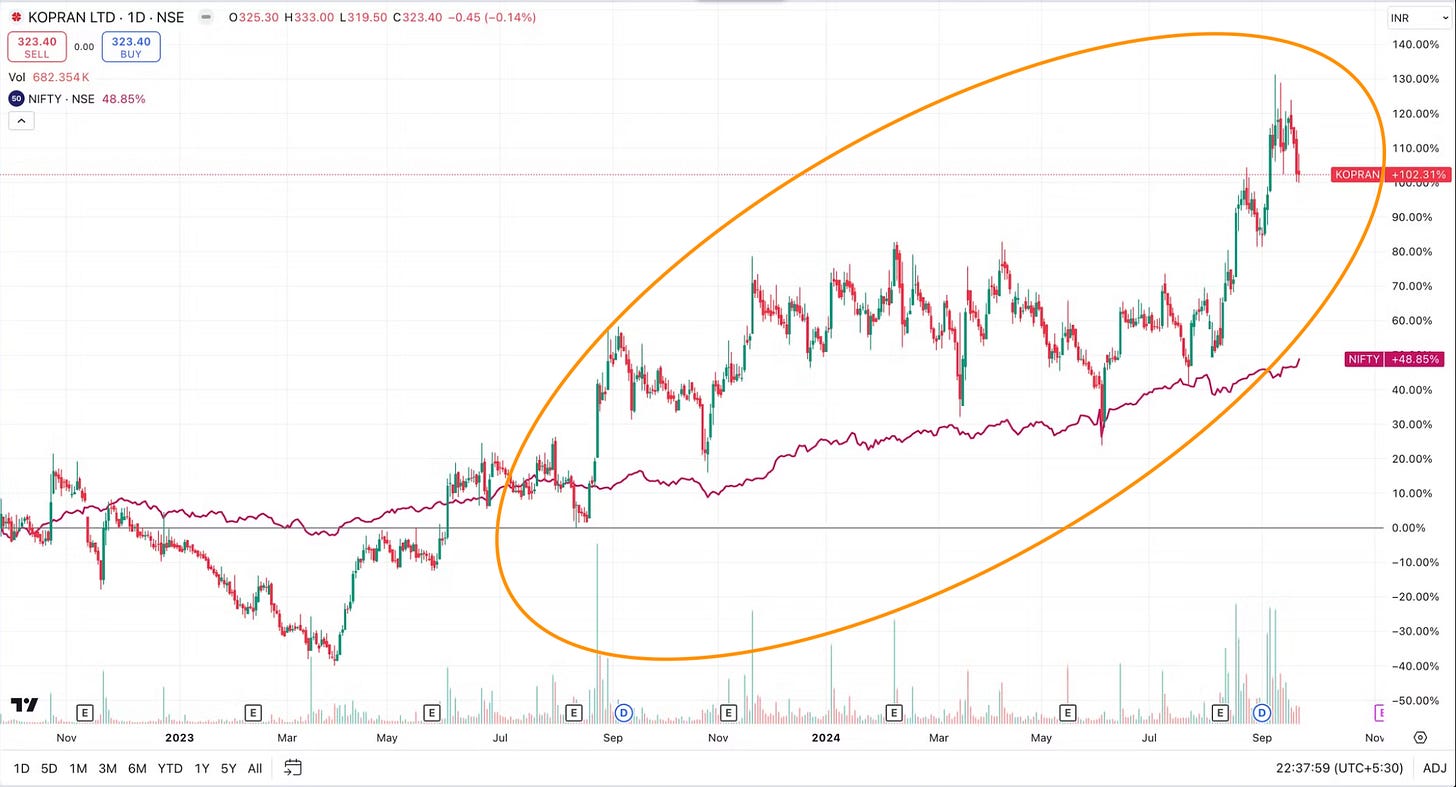
KOPRAN - Market Cap 1,656 + Cr
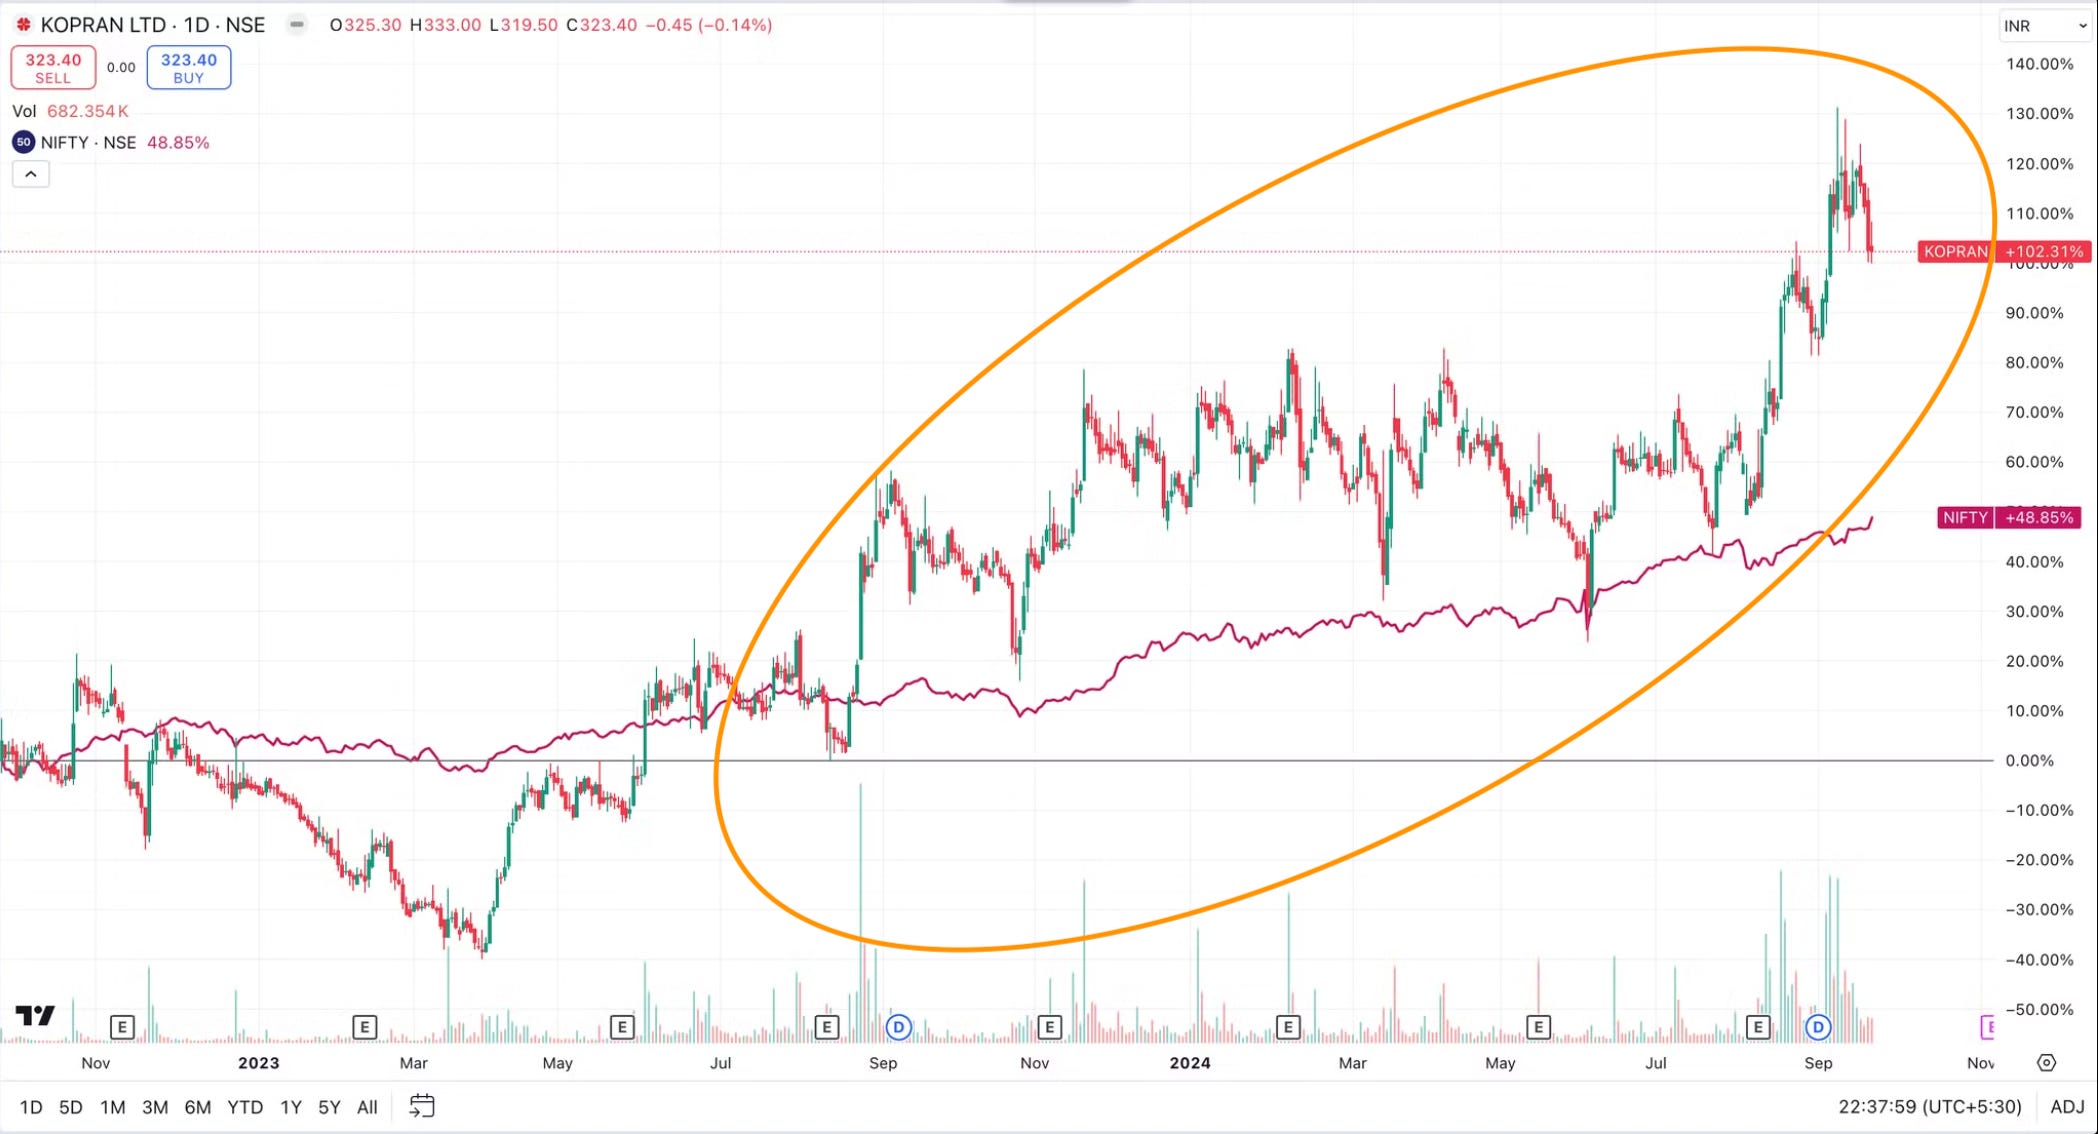
Price action - Since Sept 22, Kopran - 102%, NIFTY 48%
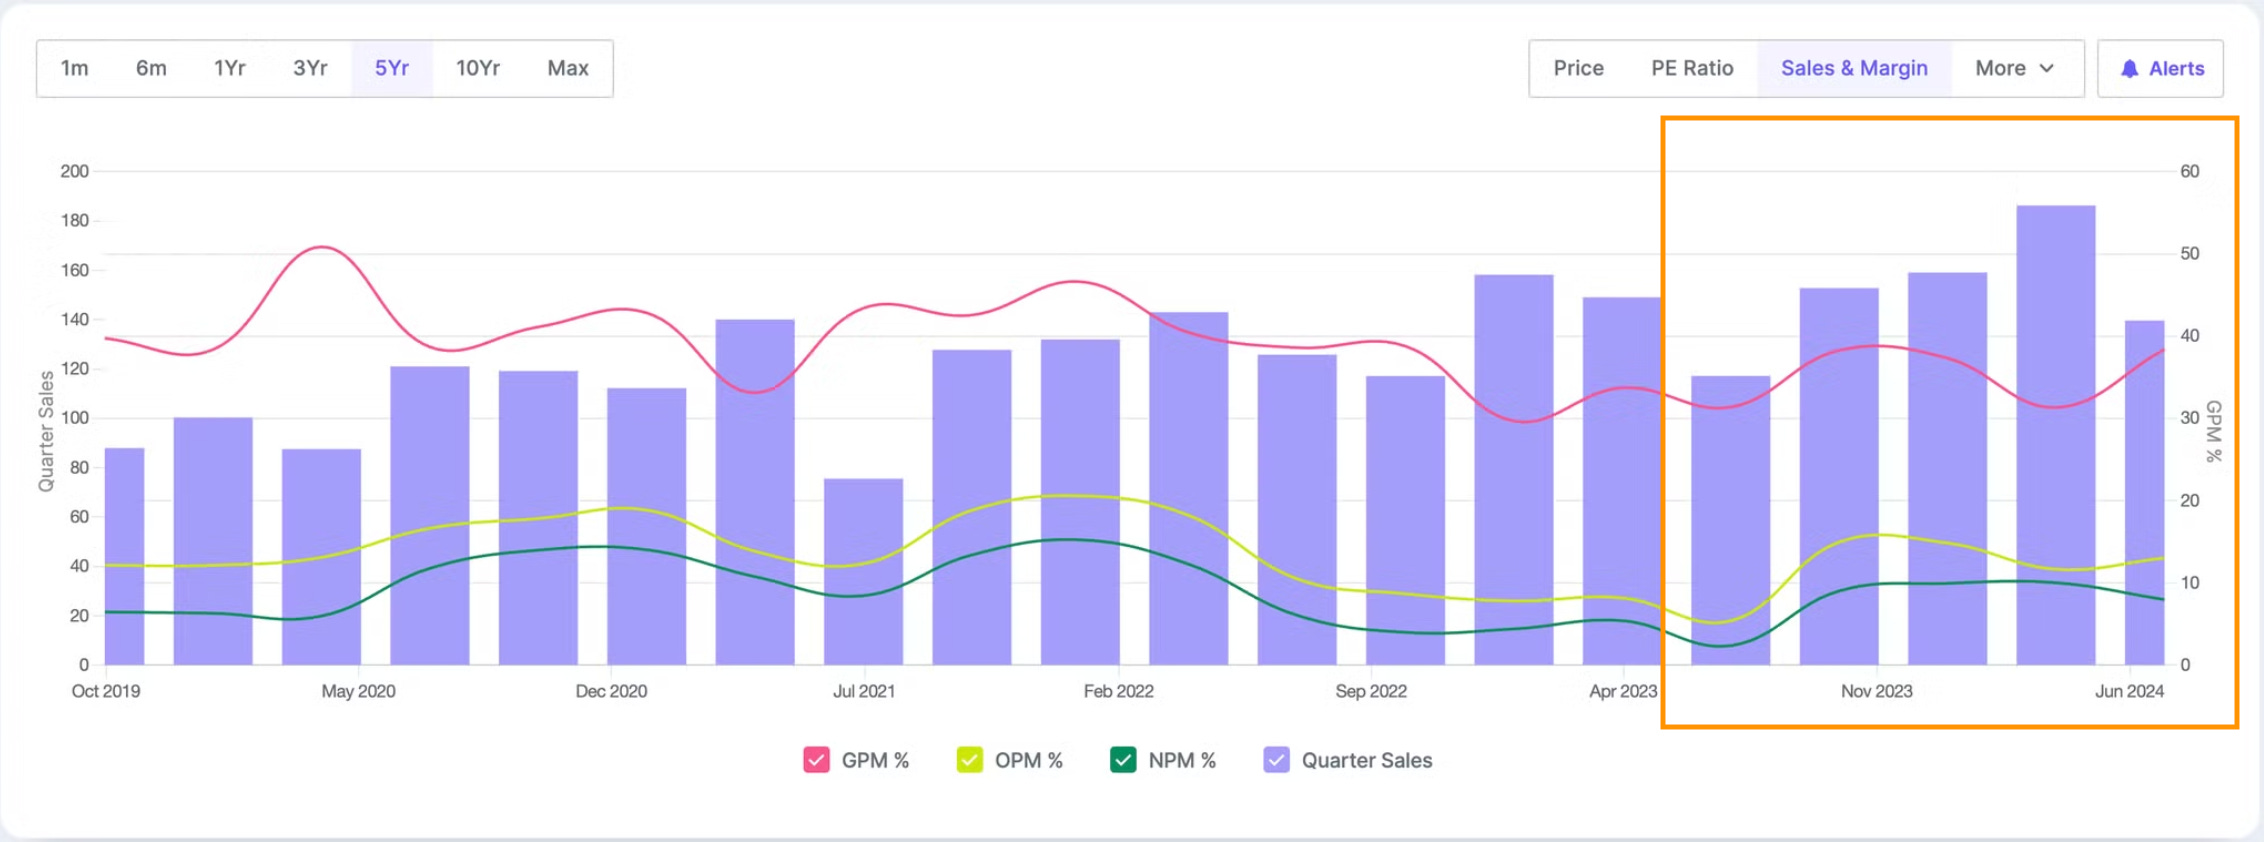
Operational metrics performance - Below chart shows Revenue, Gross, Operating and Net Profit Margin improving quarterly since July 2023
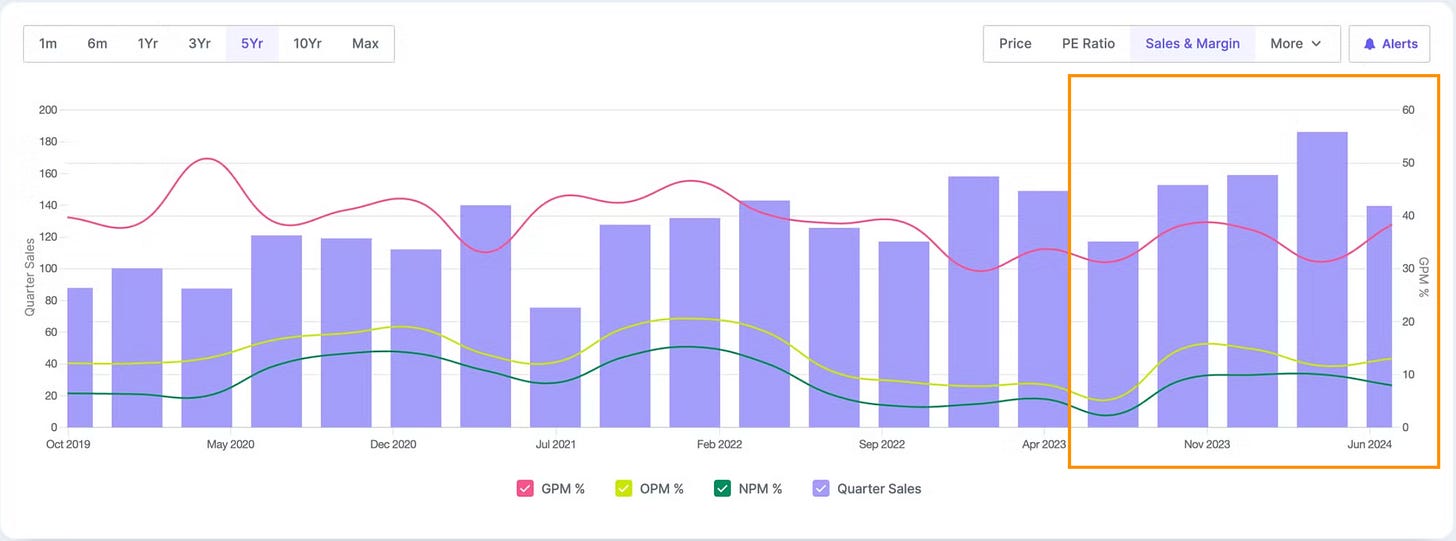
QoQ Increase - Sales down by 25% and Operating Profit Margin increase by 39%
YoY increase - Sales increase by 19% and Operating Profit Margin increase by 142%
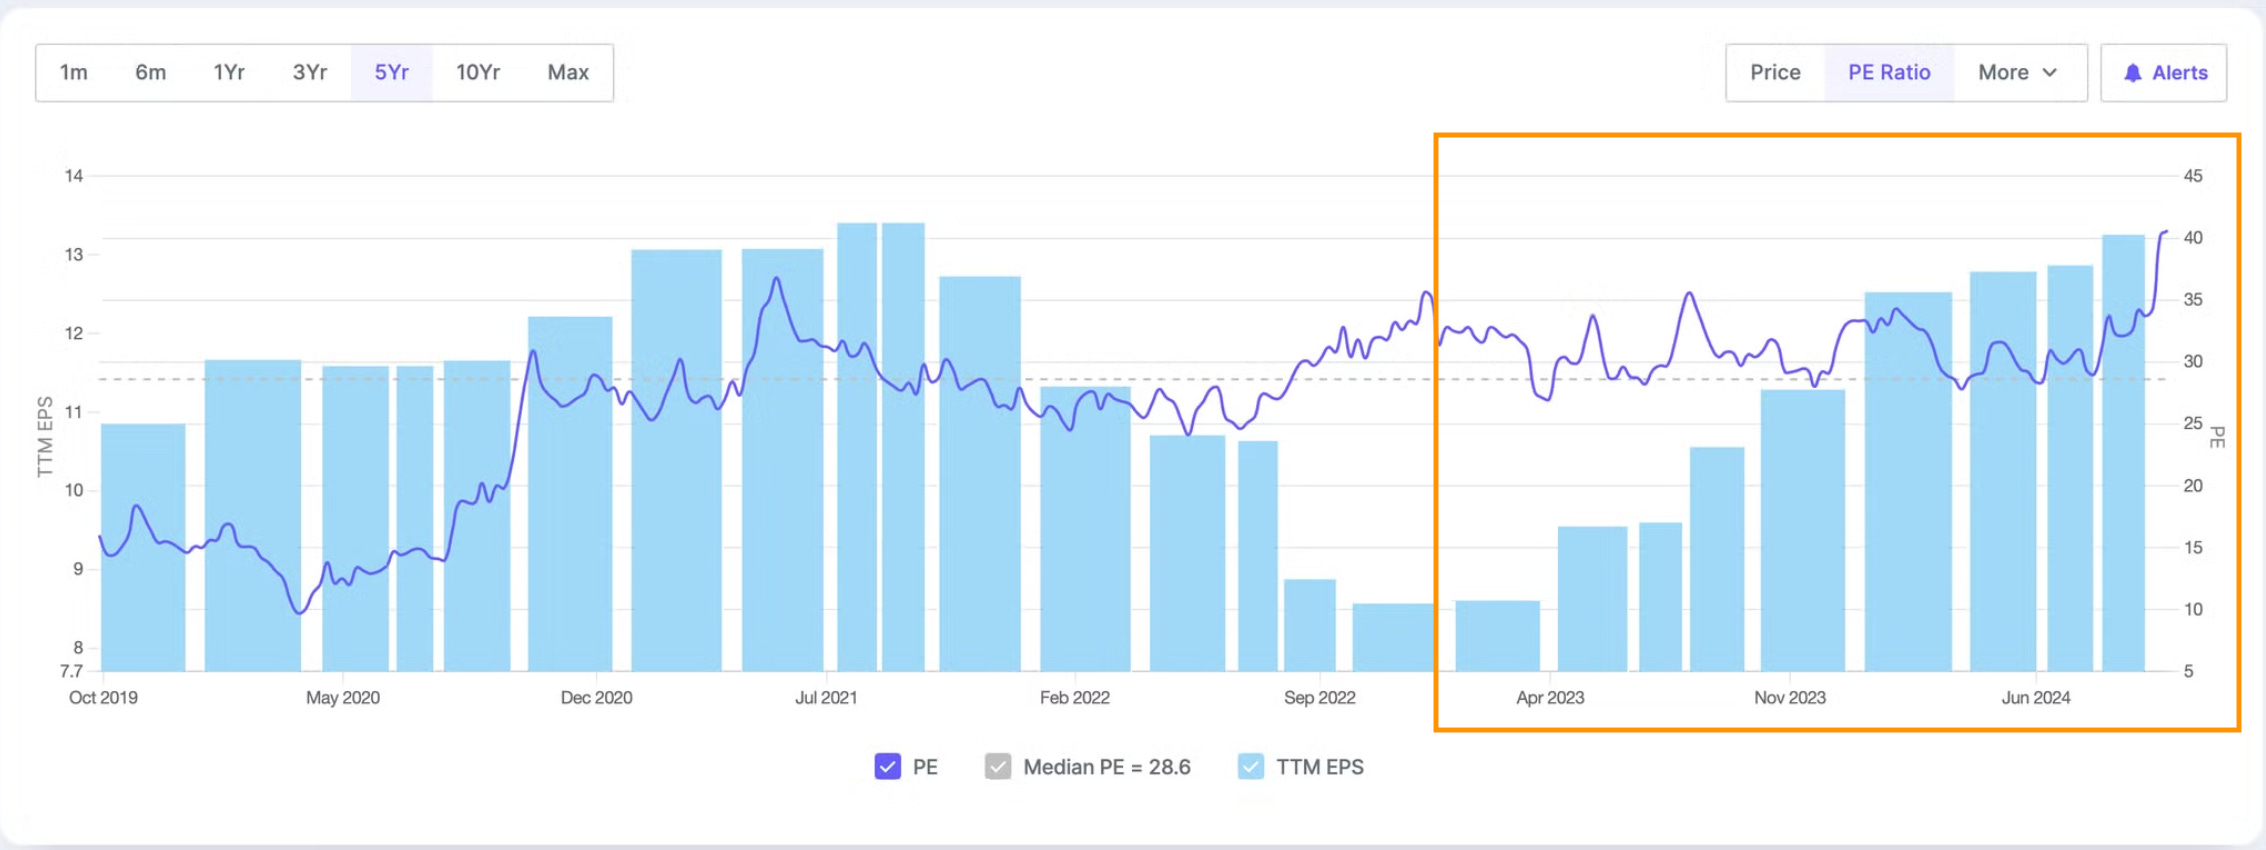
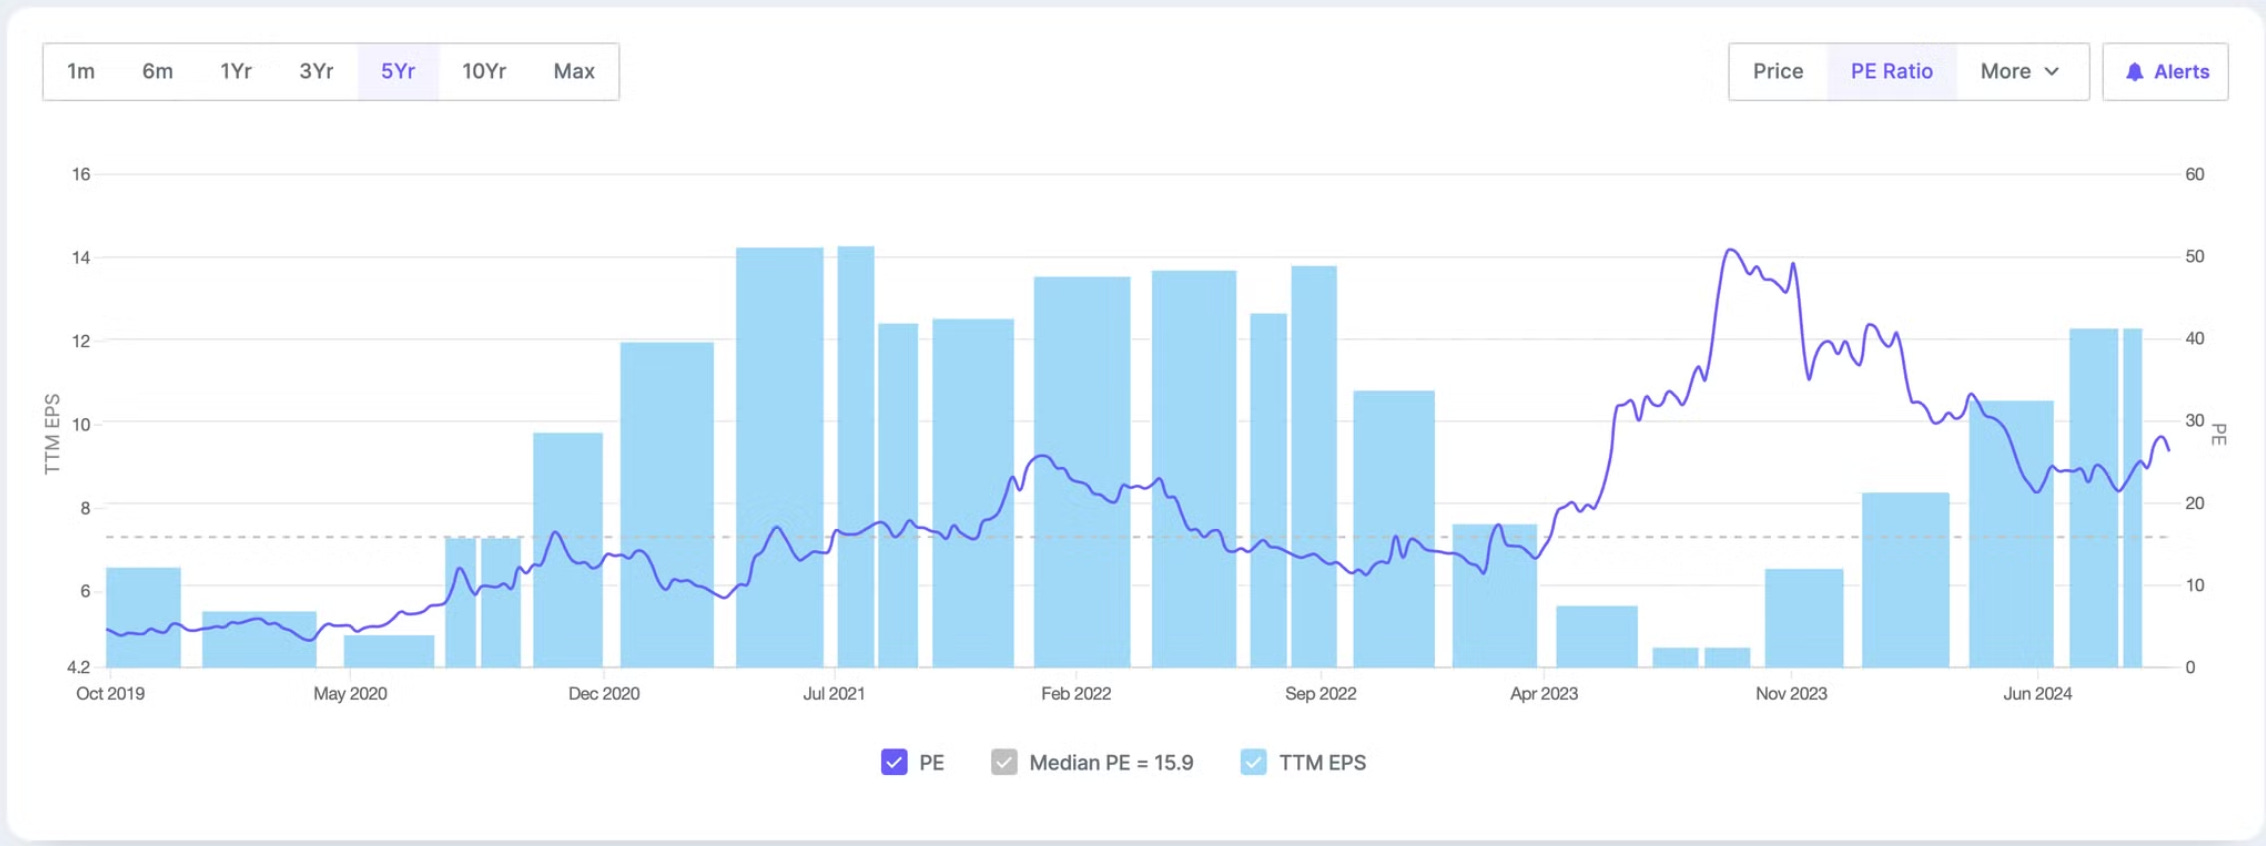
Valuations and EPS - EPS growth faster than price leading to PE stablising around 28
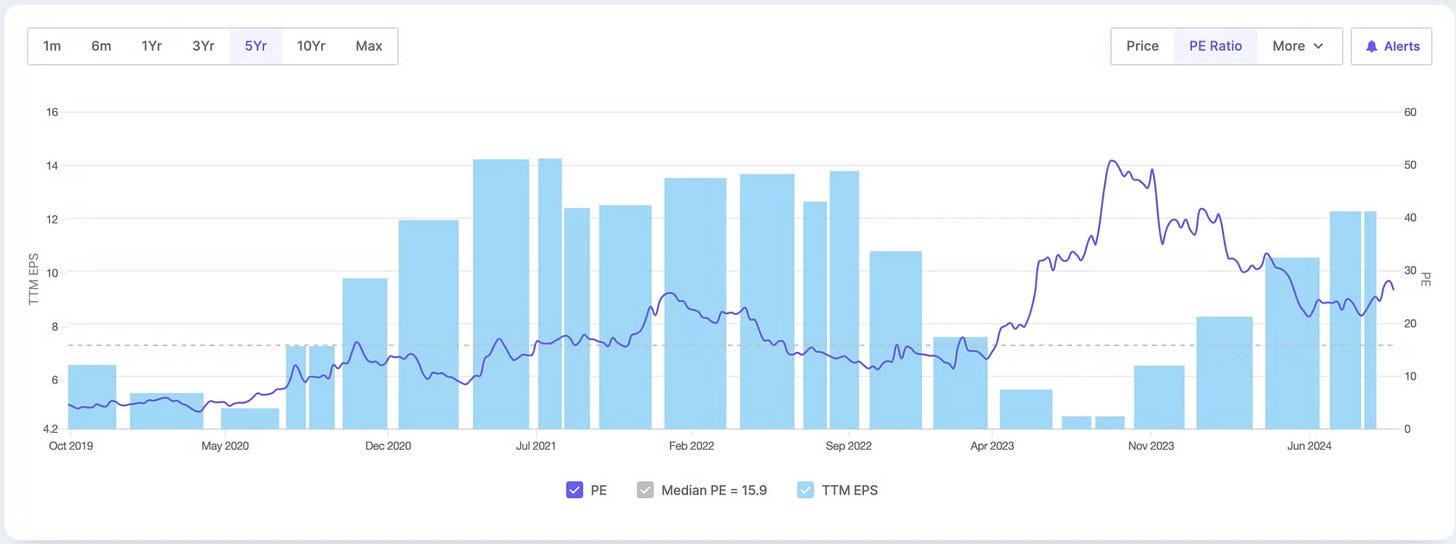
PE 28 - above historical average
TTM EPS (EPS of Last 4 quarters) - Growing consistently QoQ since Nov 2023
What led to outperformance
Revenue Growth
Consolidated turnover up 19% YoY to Rs. 139.43 crores
Profitability
Consolidated profit up significantly to Rs. 11.10 crores from Rs. 2.77 crores YoY
API Business
Turnover increased to Rs. 89.83 crores from Rs. 73.86 crores YoY
Formulations Business
Turnover increased to Rs. 49.61 crores from Rs. 43.29 crores YoY
Panoli Plant
Environmental clearance received; production to start in next few months
New Product Development
Validation batches for new formulations like Rivaroxaban, Empagliflozin, Sitagliptin
Capacity Expansion
Plans for vial filling line for Penems; forward integration
Margin Outlook
EBITDA margin improved to 13% from 12% last year; targeting 14-15% for FY25
Long-term Growth
Targeting revenue of 1,200-1,300 crores in 4-5 years
Product Concentration
Top 5 molecules contribute 50-55% of revenue
Thank you for going through these 10 ideas that you can research further to invest.
The next 2 sectors that we will be covering are
Wealth Management Sector - HDFC AMC, Nippon Life, 360One, Authum invest and more
Food Processing (Indian) - Godrej Agrovet, LT Foods, Zydus Wellness, Avanti Feeds and more