


Disclaimer - We are not SEBI registered !! Nothing that you will read below is investment advice. We are sharing “High Performing stocks that are Undervalued” based on Q1’25 performance in Wealth Management Sector with you, for you to do deeper research.
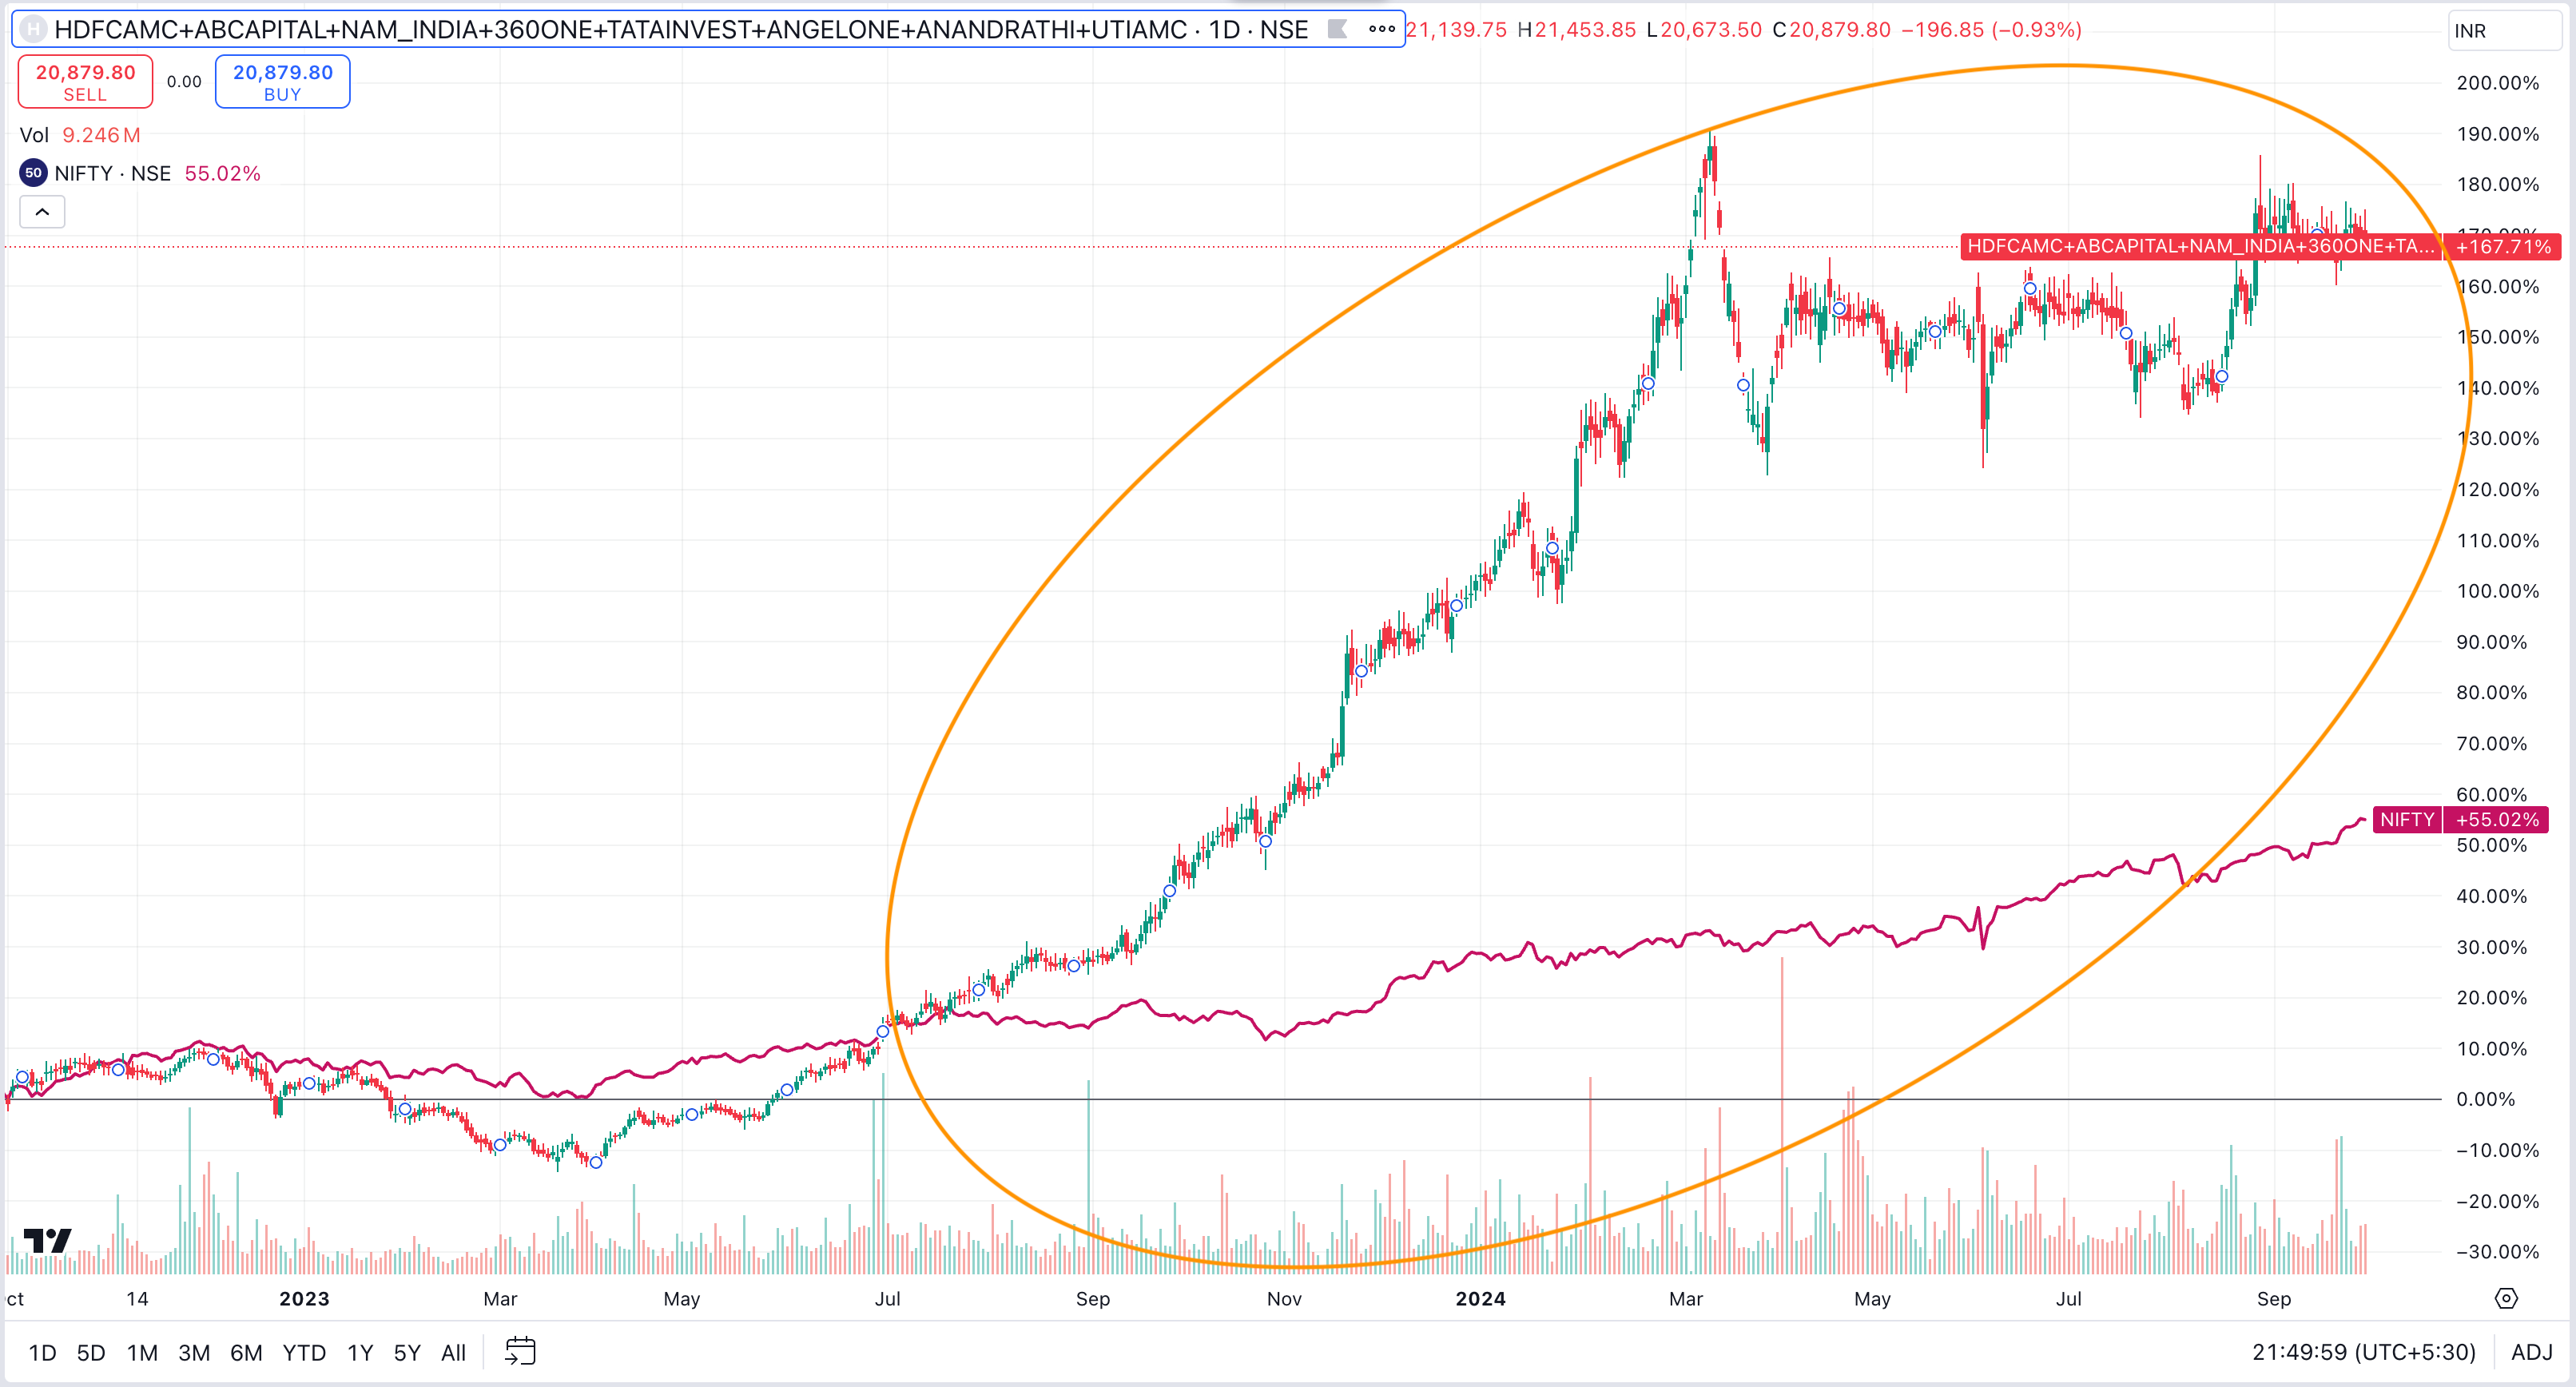
Wealth Management Custom Index Returns as compared to NIFTY
If we see returns for the last 2 years, our Wealth management custom index started outperforming NIFTY since July 23 and since Sept 22 has given returns of 167% vs NIFTY 55%
What is happening fundamentally in Wealth Management Sector in Q1 25 i.e. from April 24 to June 24
When multiple companies in a sector show Increase in Sales and OPM in a quarter… it usually indicates that there are strong tailwinds in the sector. This generally results in multiple companies in that sector out performing Fundamentally and Price wise.
For Wealth Management Sector
12 Companies grew their Sales by 28% and Operating Profit Margins by 16% Quarter on Quarter in Q1 25 i.e. compared with Q4 2024
16 Companies grew their Sales by 56% and Operating Profit Margins by 6% Year on Year i.e. compared with Q1 2024
Also you will notice that for most of the companies mentioned below (The 10 Best performing Wealth Management stocks that are undervalued) -
3 Profit metrics
Gross Profit Margin per quarter
Operating Profit Margin per quarter
Net Profit Margin per quarter
Started improving around Q3 2023 i.e. from Aug 22 to Sept 22
Revenues started to scale up massively from July 23
Prices of these companies bottomed out in March 23 and since then have been on a tear, outperforming NIFTY since July 23
The reasons for the above fundamental outperformance (sector Tailwinds) are -
Robust AUM Growth: The industry is witnessing strong growth in Assets Under Management, with most players reporting double-digit year-over-year increases, driven by both market performance and net inflows.
Rising Retail Participation: There's a significant increase in retail investor participation, evidenced by growth in SIP inflows and new demat account openings, indicating a broader base of investors entering the market.
Shift to Financial Assets: Indian households are gradually shifting from traditional assets like real estate and gold to financial assets, creating a long-term structural growth opportunity for wealth management firms.
Digital Transformation: Companies are heavily investing in digital platforms and technologies, enhancing customer experience and expanding reach, particularly in Tier 2 and Tier 3 cities.
Product Diversification: Firms are expanding their product offerings beyond traditional mutual funds, venturing into areas like AIFs, PMS, and offshore investments to cater to evolving client needs.
Regulatory Support: Favorable regulatory environment and initiatives aimed at increasing financial inclusion and literacy are supporting industry growth.
Increasing HNI/UHNI Segment: The growing number of High Net Worth and Ultra High Net Worth Individuals in India is creating a lucrative market for personalized wealth management services.
Check out the last section of the newsletter to see which sectors will we cover next…
10 Undervalued Wealth Management Stocks that were the Best Performers listed by Decreasing Market Cap
HDFC AMC - Market Cap 94,000+ Cr
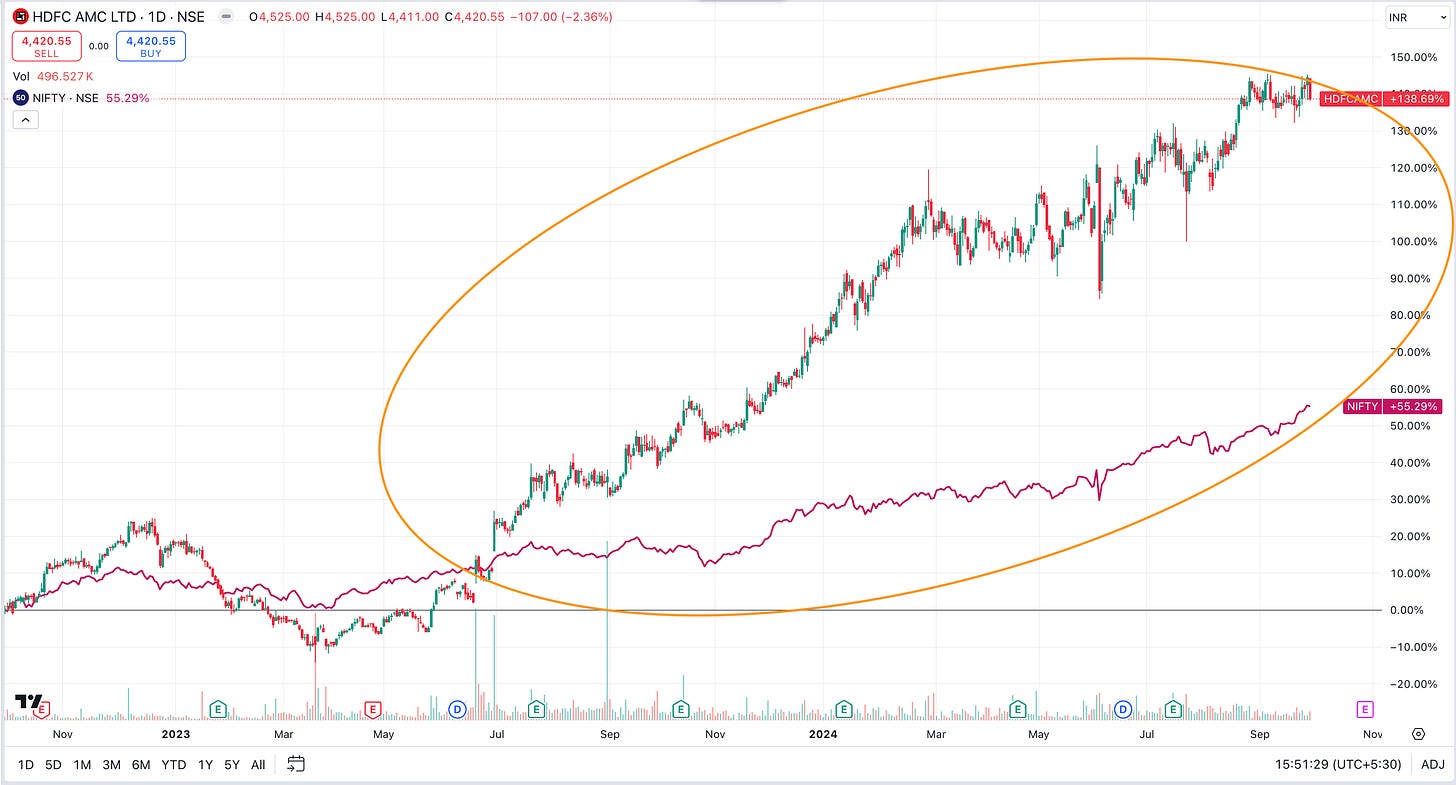
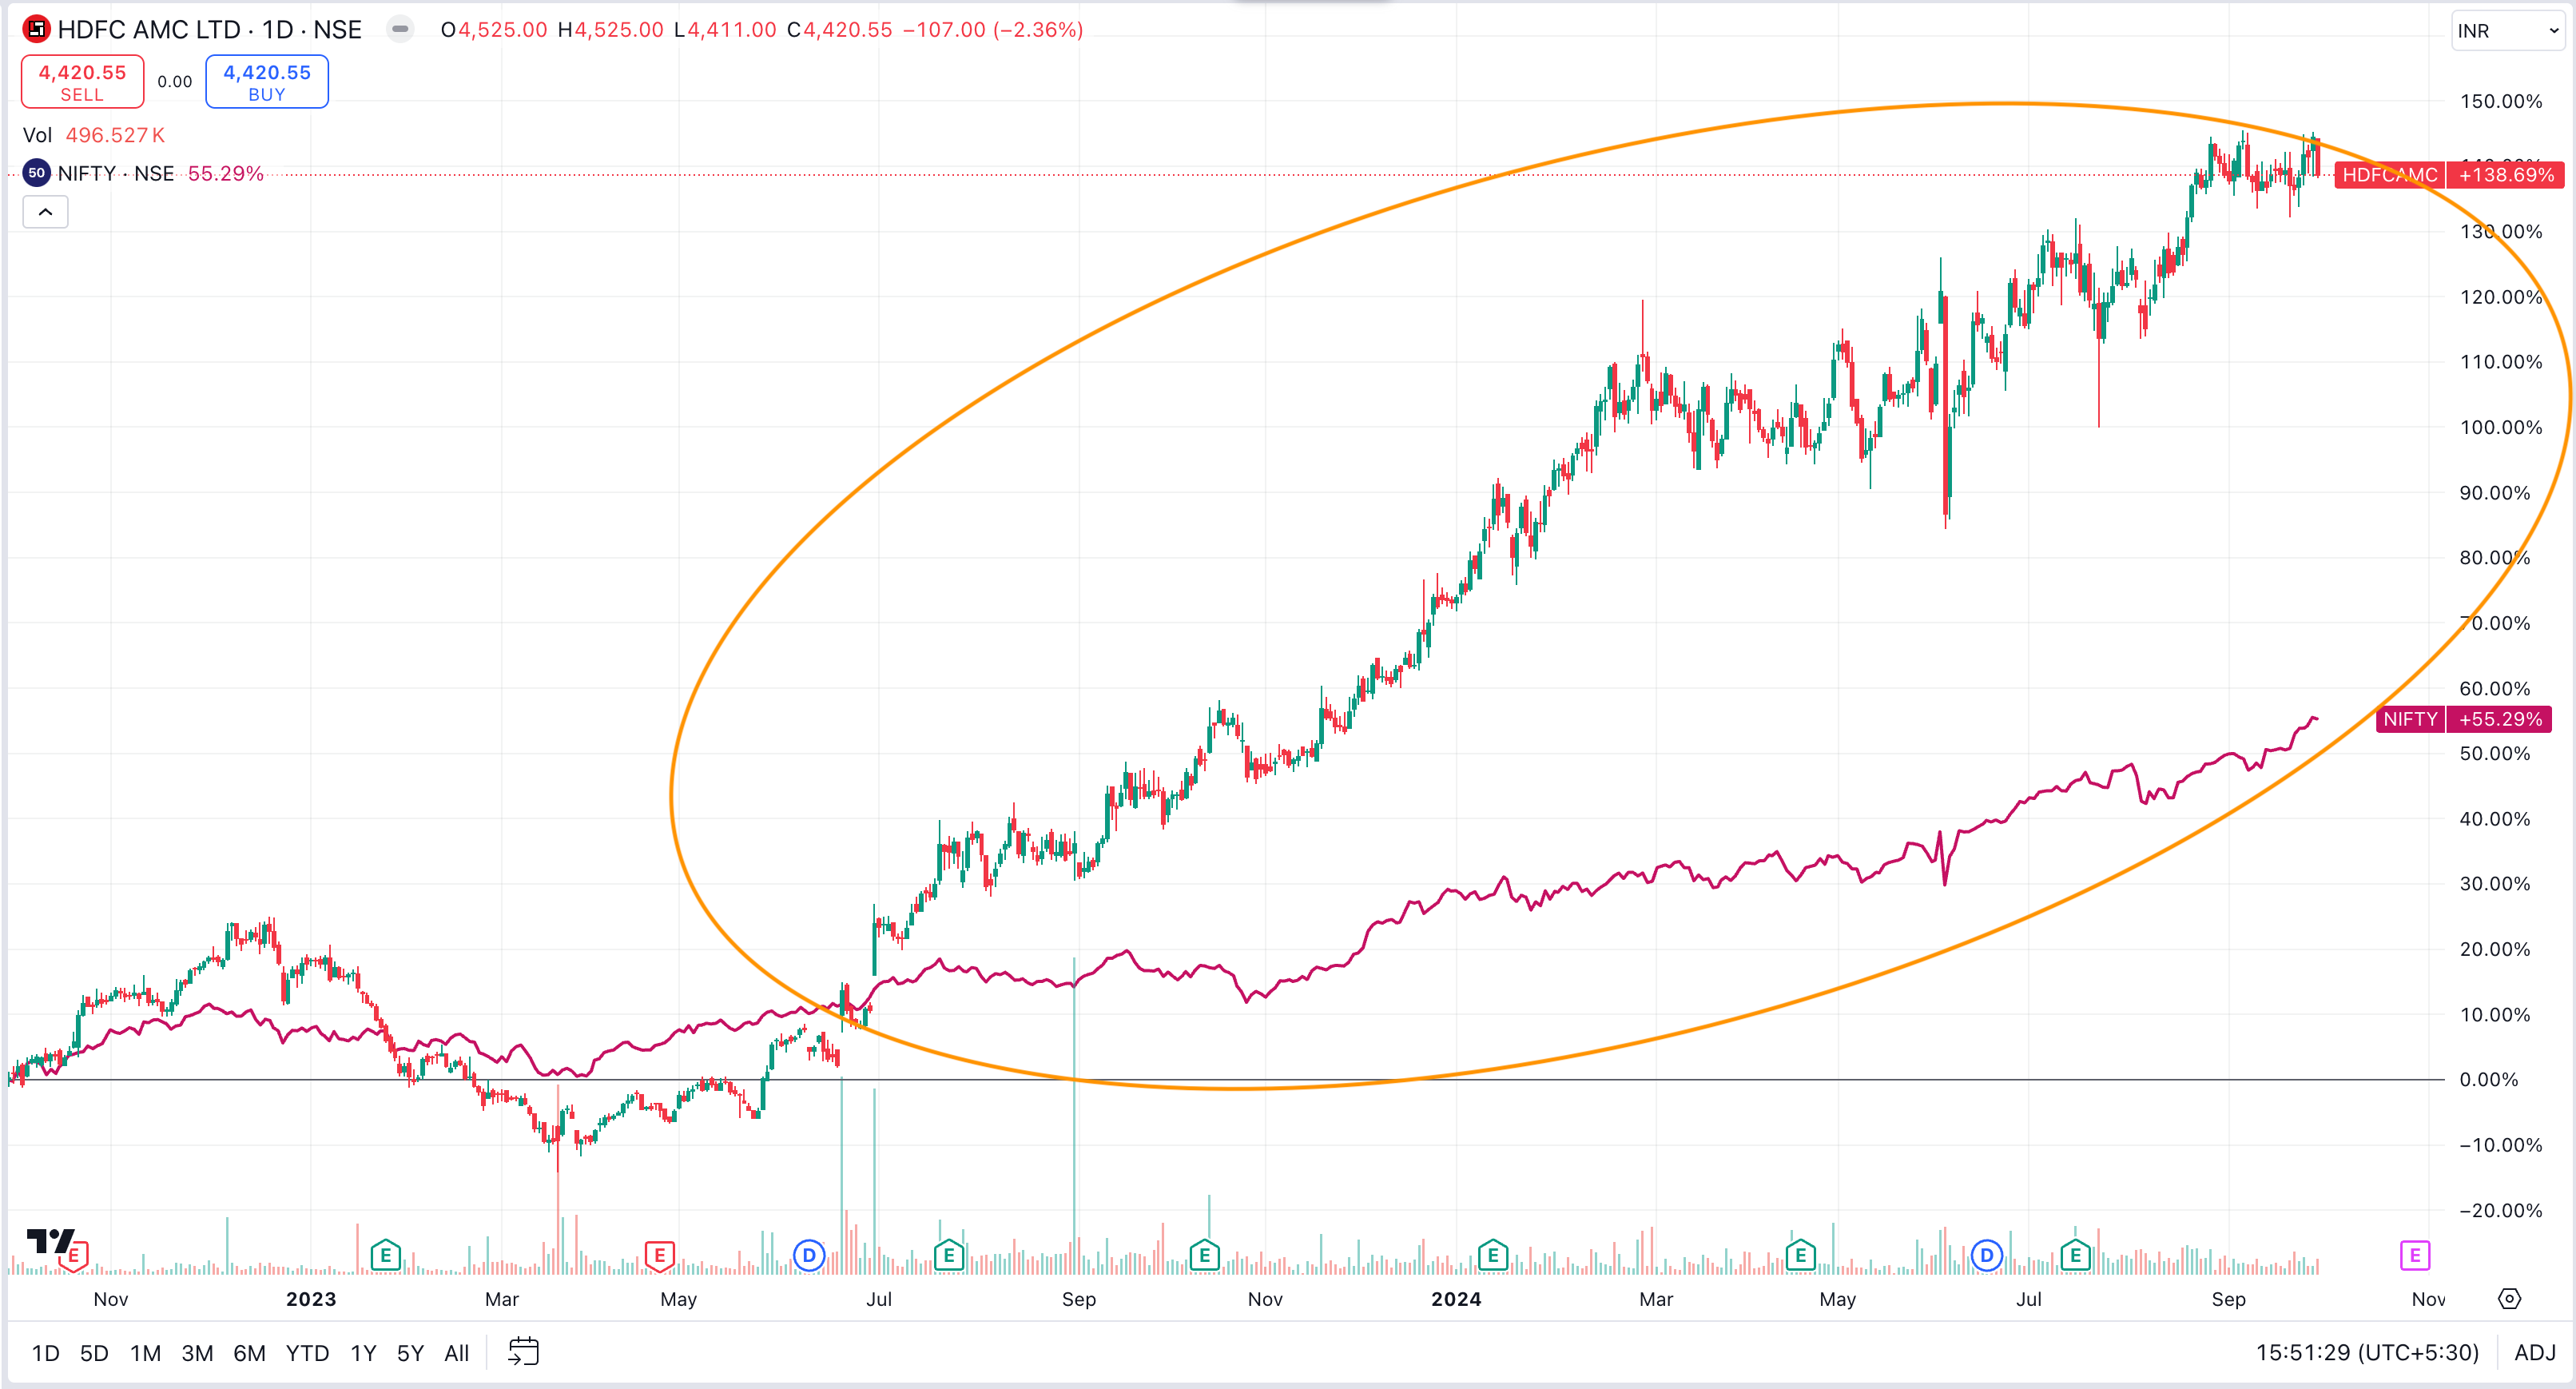
Price Action - Since Oct 22, HDFC AMC - 138%, NIFTY 55%
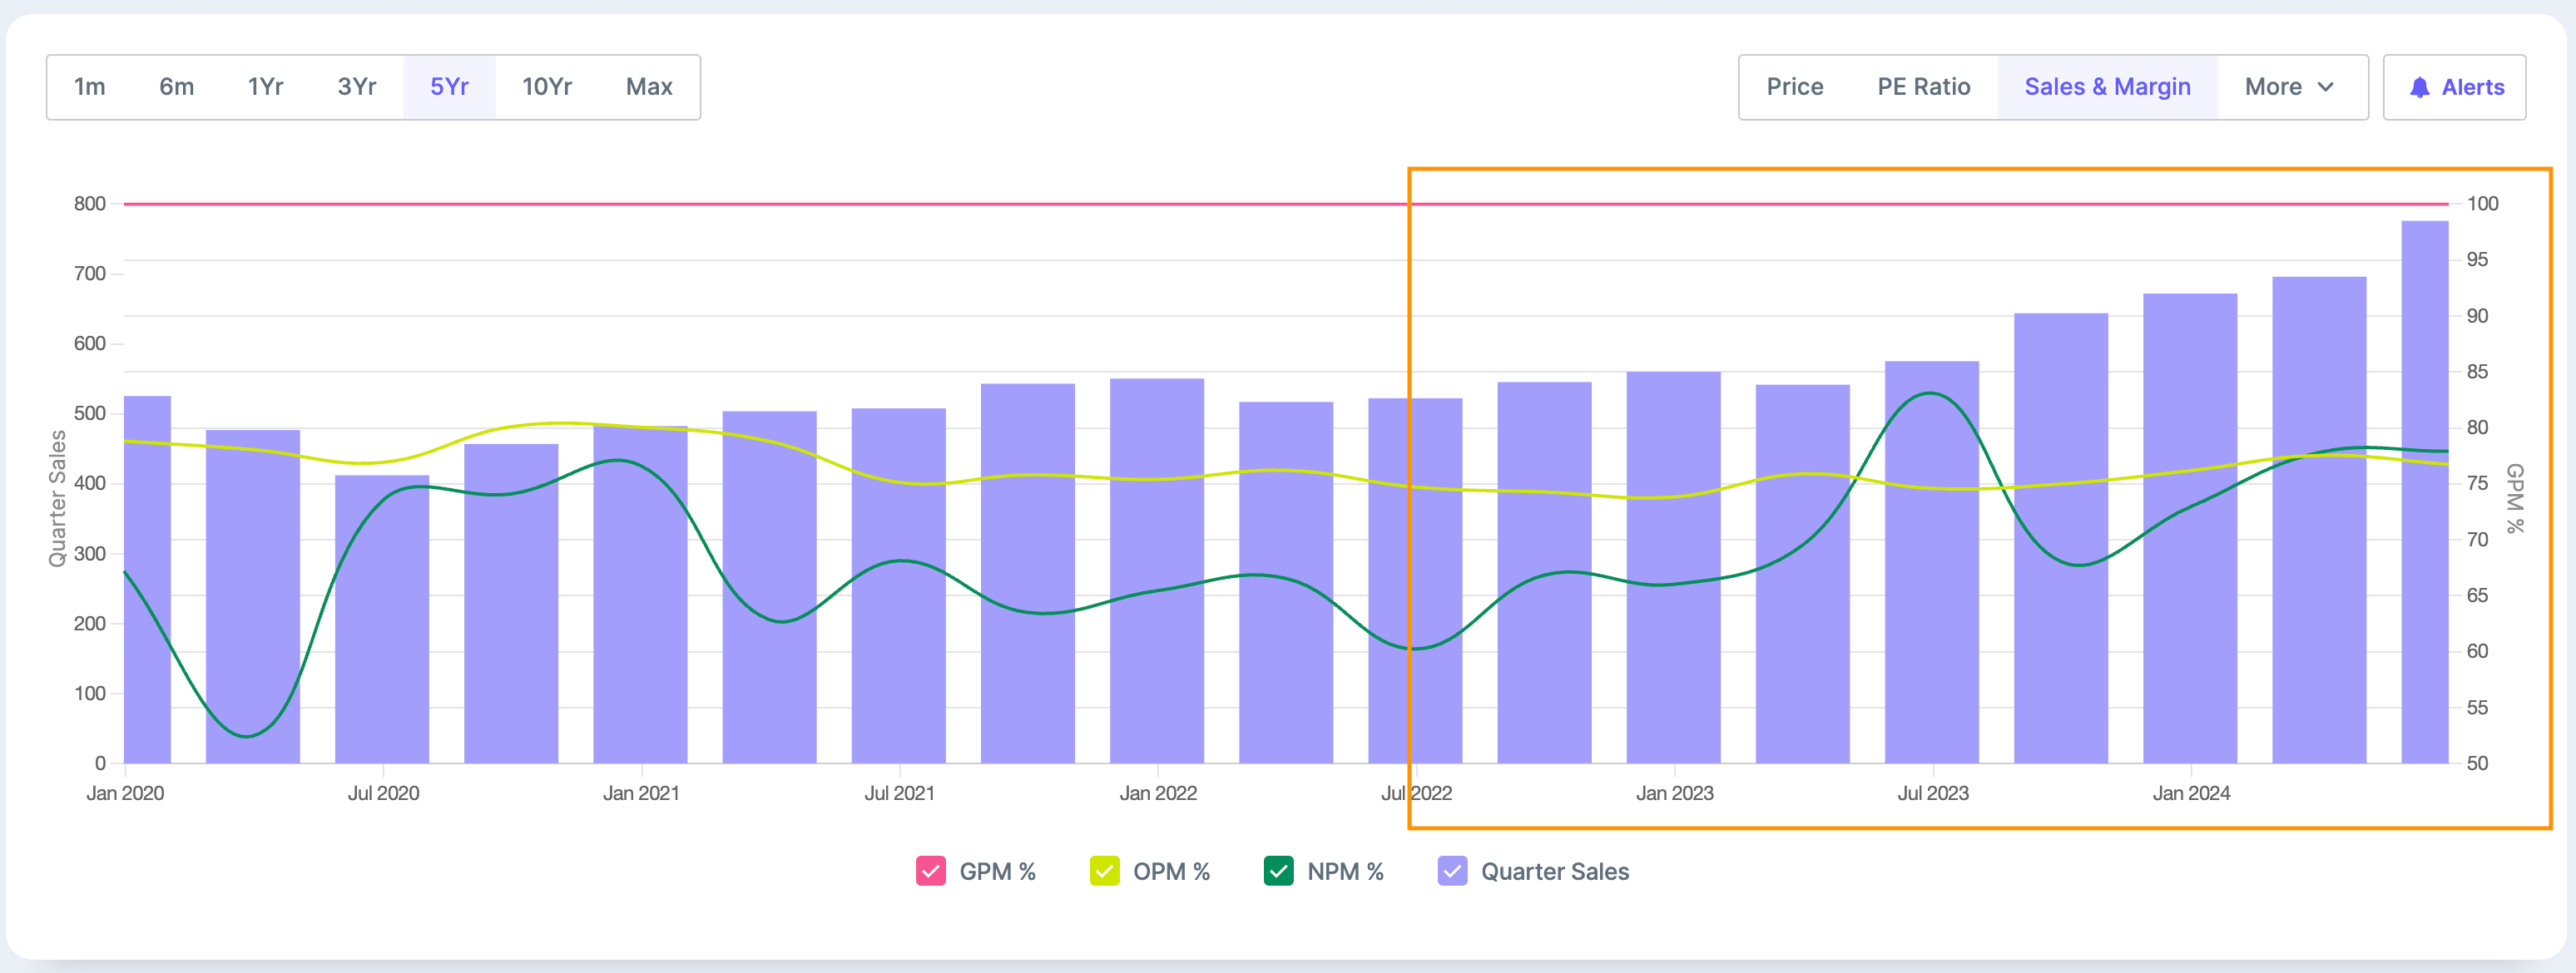
Operational metrics performance - Below chart shows Gross, Operating and Net Profit Margin improving quarterly since July 2022 but revenue scaling up from July 2023
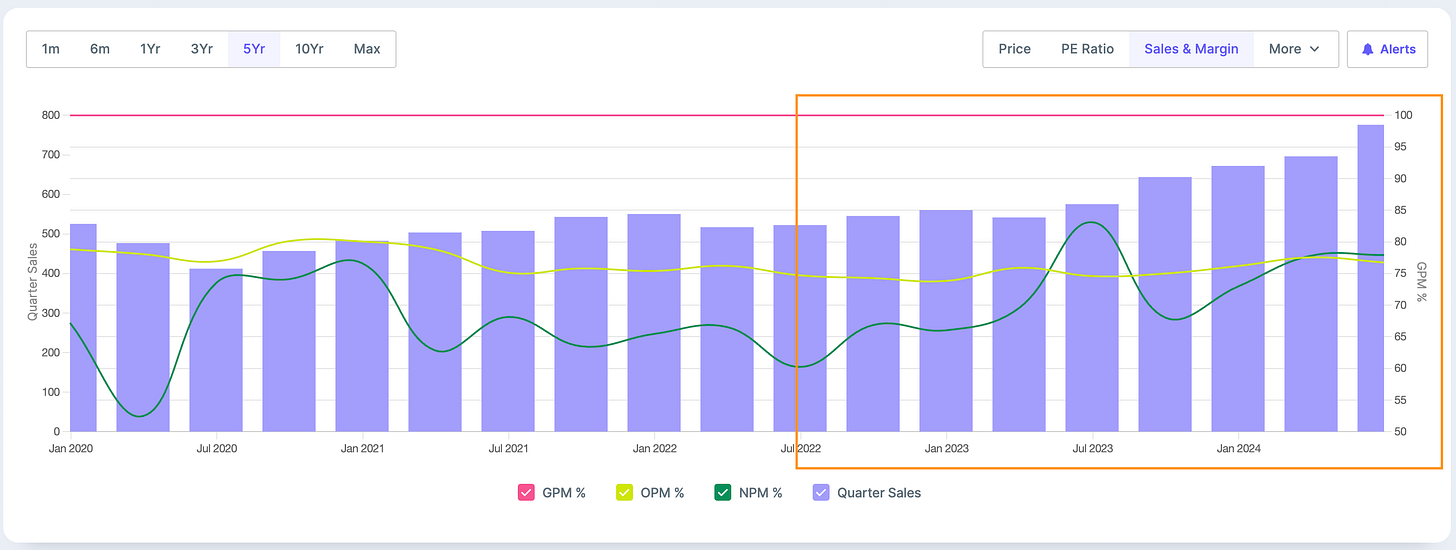
Q1 25 results (QoQ Increase) - Sales increased by 11% and Profits decreased by 1%
Q1 25 results (YoY increase) - Sales increased by 35% and Profits increased by 3%
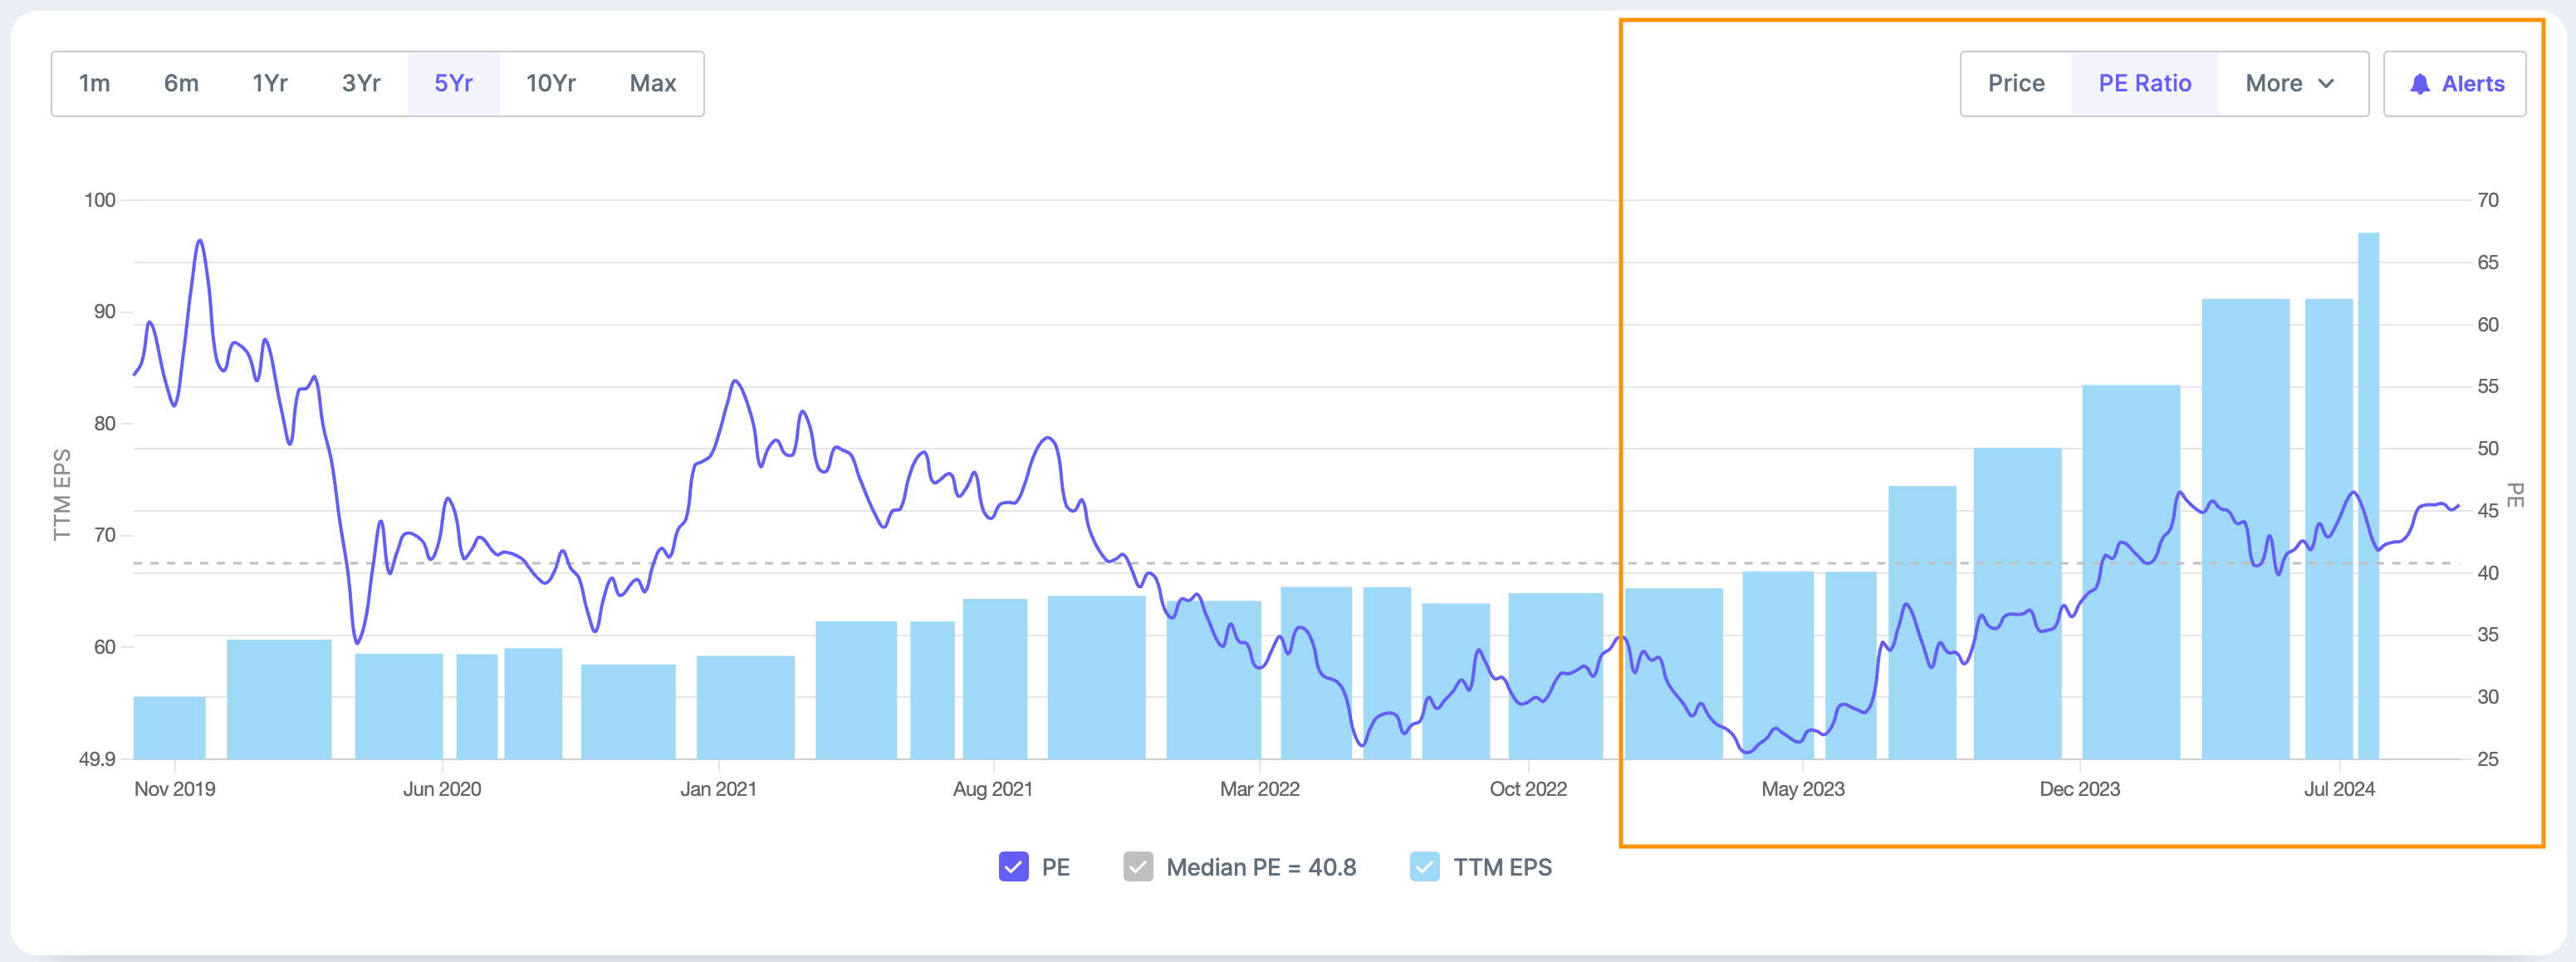
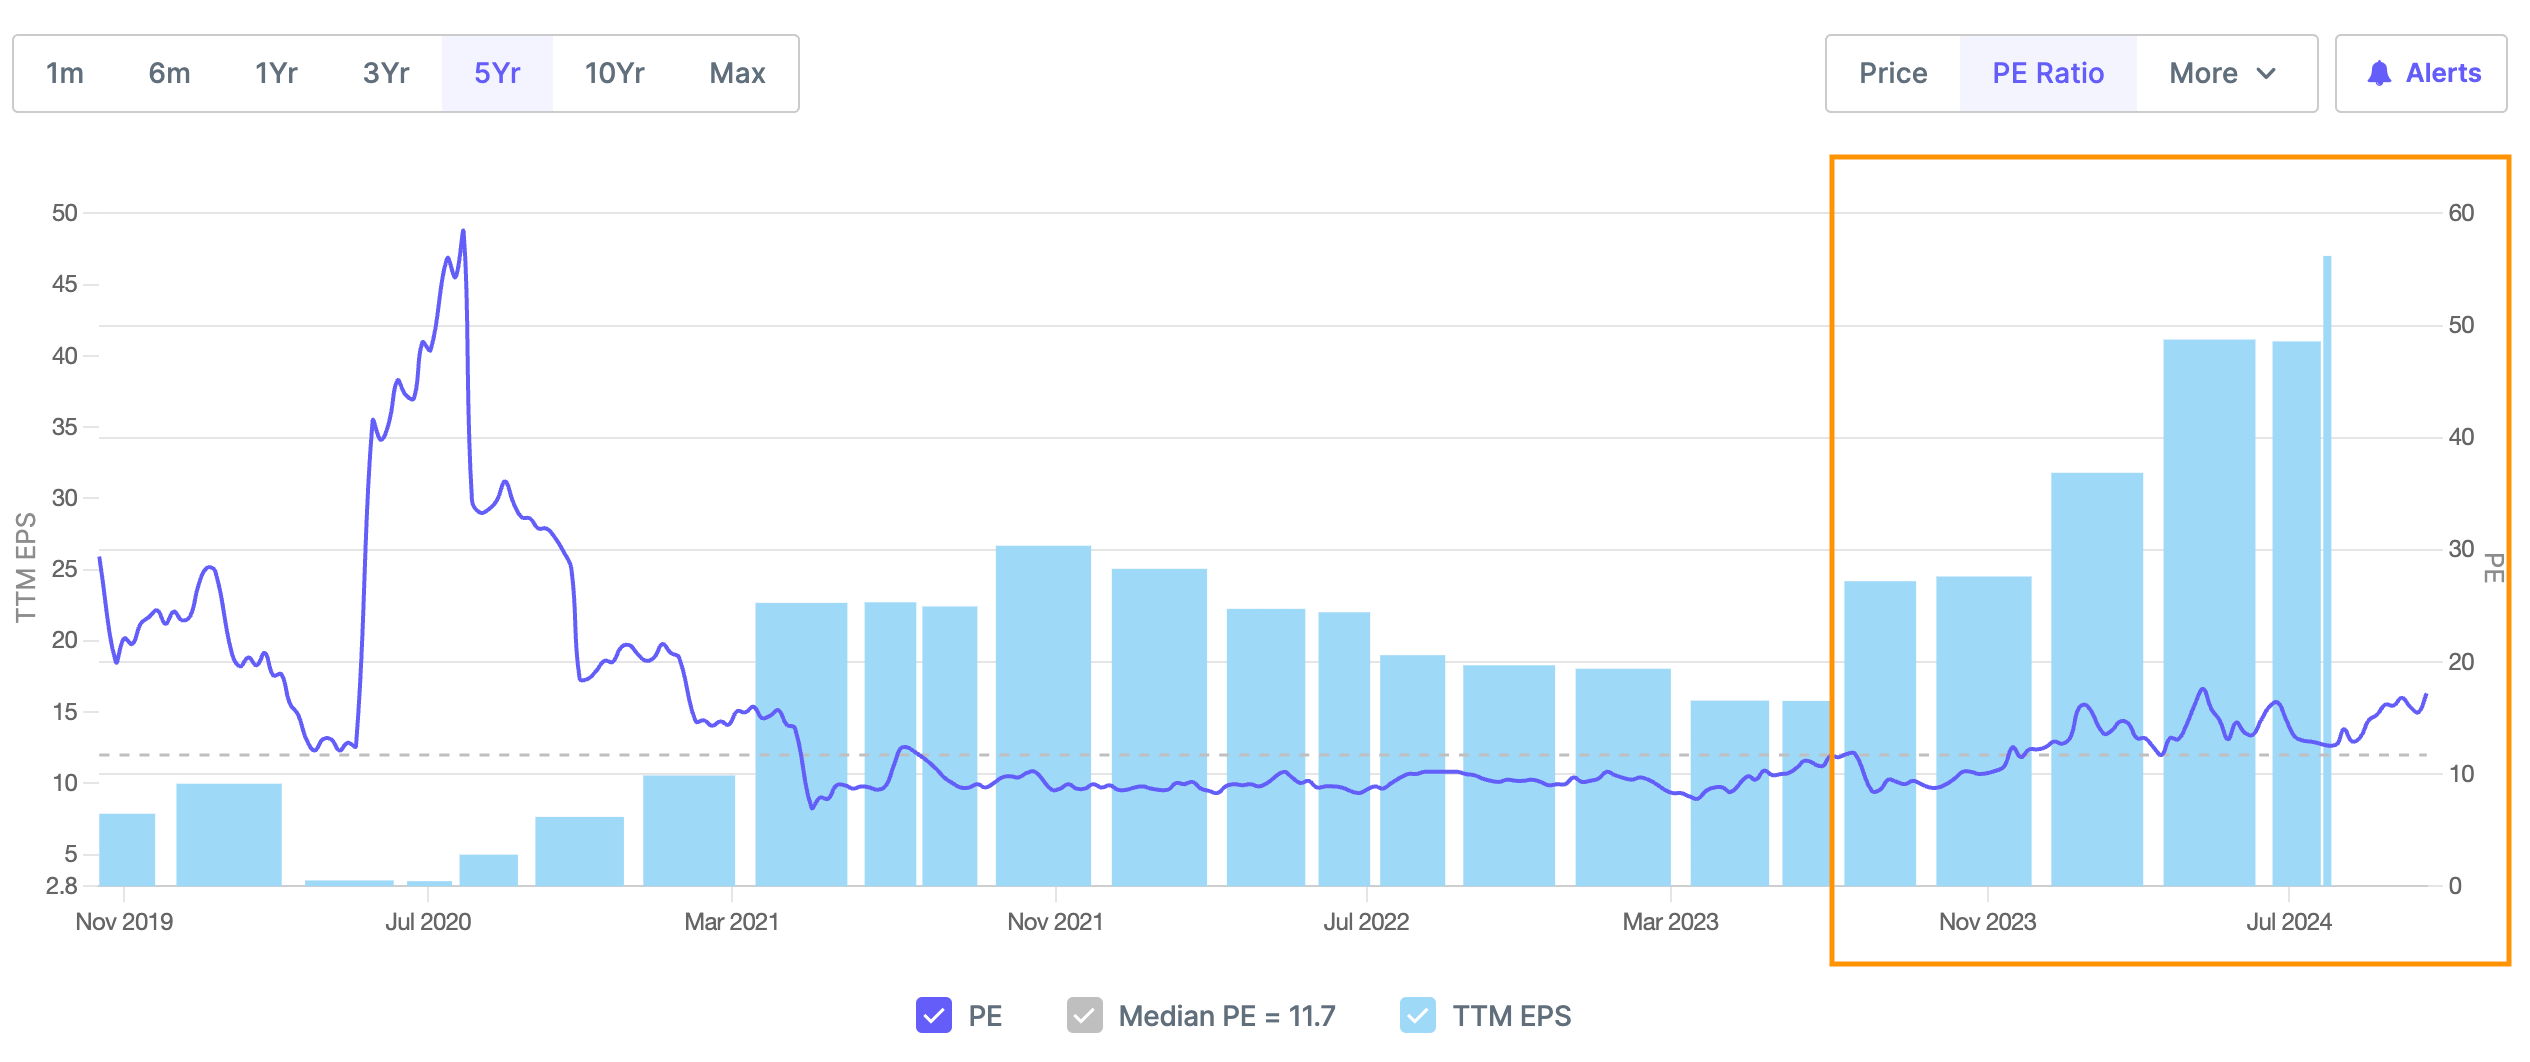
Valuations and EPS - Below chart shows Price has grown faster than TTM EPS (EPS of last 4 quarters) from April 2023 to Jan 2024 and from Jan 2024 both have grown at the same pace leading to PE stablizing at 45
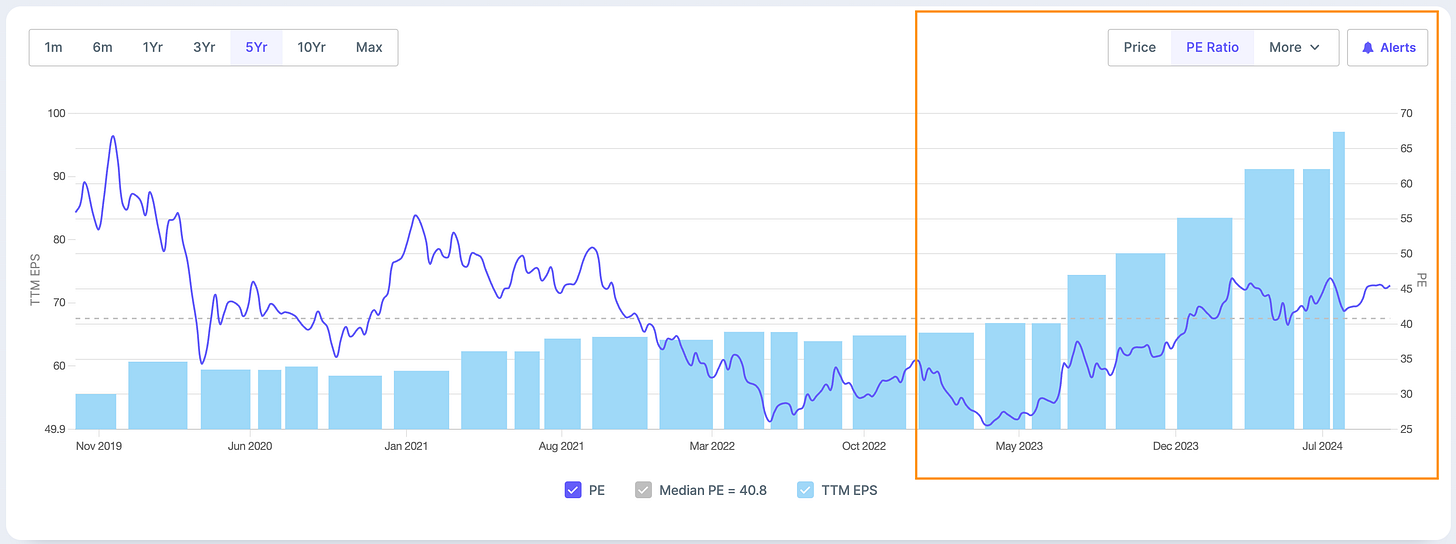
PE consistent at 45 i.e. above historical average
TTM EPS (EPS of Last 4 quarters) - Growing consistently QoQ since April 2023
What led to outperformance
AUM Growth
i. Total AUM surpassed INR 7 trillion, with equity-oriented assets increasing to 64.3% of total AUM
Market Share Gains
Overall market share increased 24 bps QoQ and 93 bps YoY to 8.20%
Revenue Growth
Revenue from operations increased by 35% YoY to INR 7,752 million, while operating profit grew by 40% YoY
Client Acquisition
Unique investor count reached 10.7 million, with 23% penetration in unique investor base
Systematic Investments
Systematic transactions for June 2024 stood at INR 32.1 billion, showing strong recurring inflows
Product Portfolio
Total number of products increased to 100, up from 43 in March 2021, expanding offerings across active and passive strategies
Distribution Channels
Strengthening relationship with HDFC Bank, capturing 30% of their mutual fund book, and growing presence in fintech channels
Cost Management
Maintaining cost discipline while investing in growth opportunities, with controlled expense growth of 12-15% annually
Motilal Oswal Financial Services Ltd- Market Cap 48,351 Cr
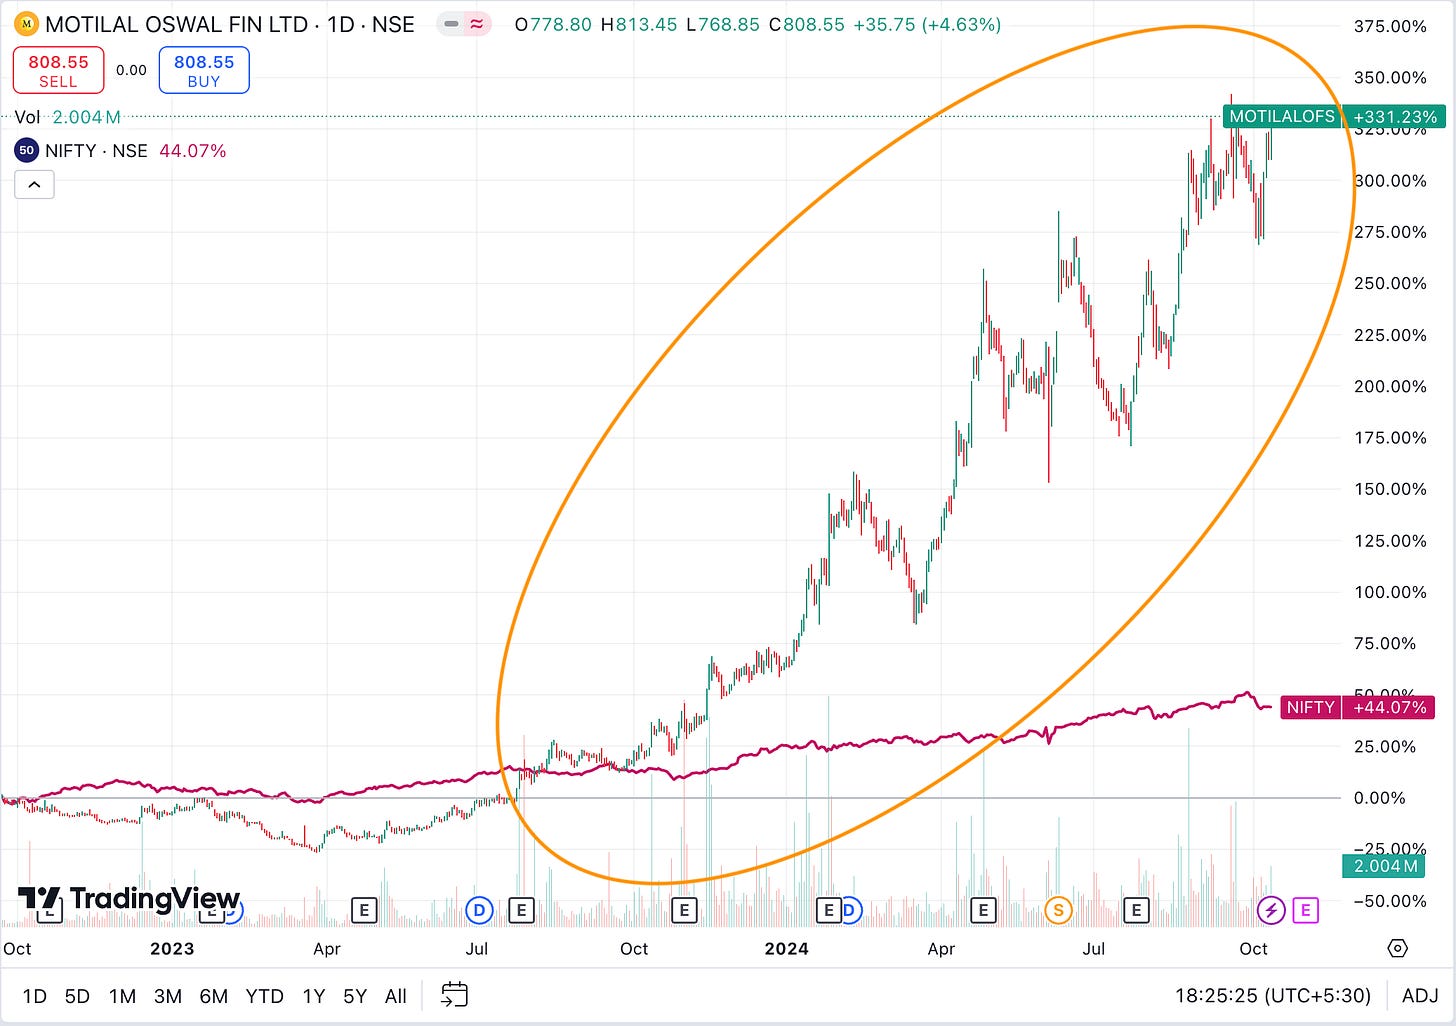
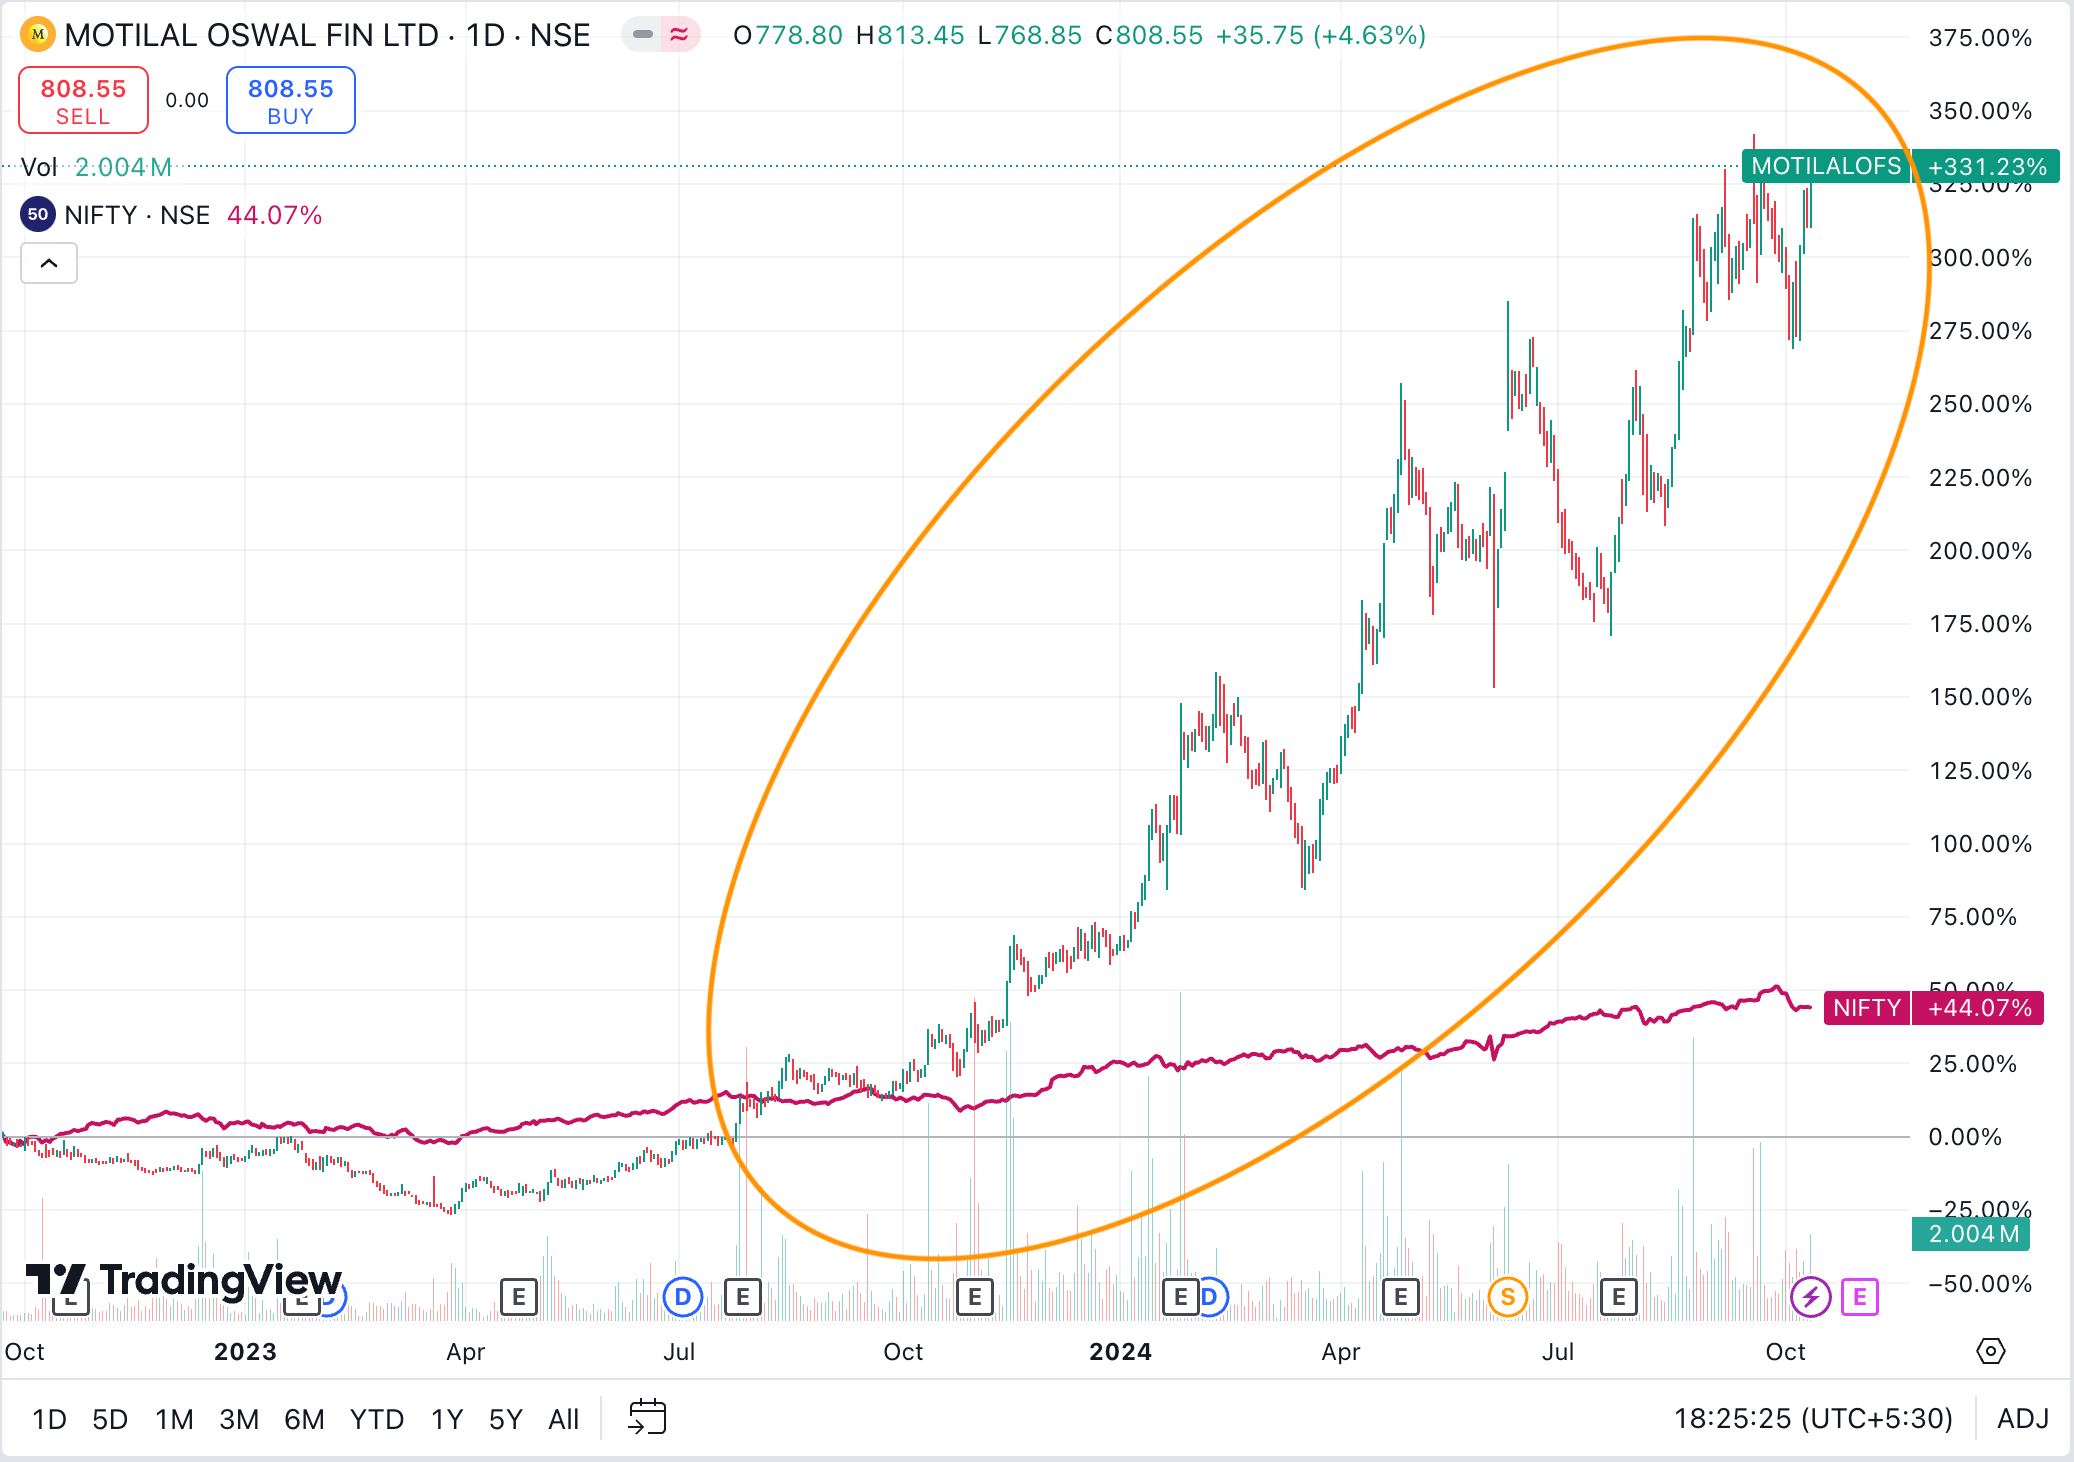
Price Action - Since Oct 22, Motilal Oswal- 331%, NIFTY 44%
Operational metrics performance - Below chart shows Gross, Operating and Net Profit Margin improving quarterly since July 2022 but revenue scaling up from July 2023
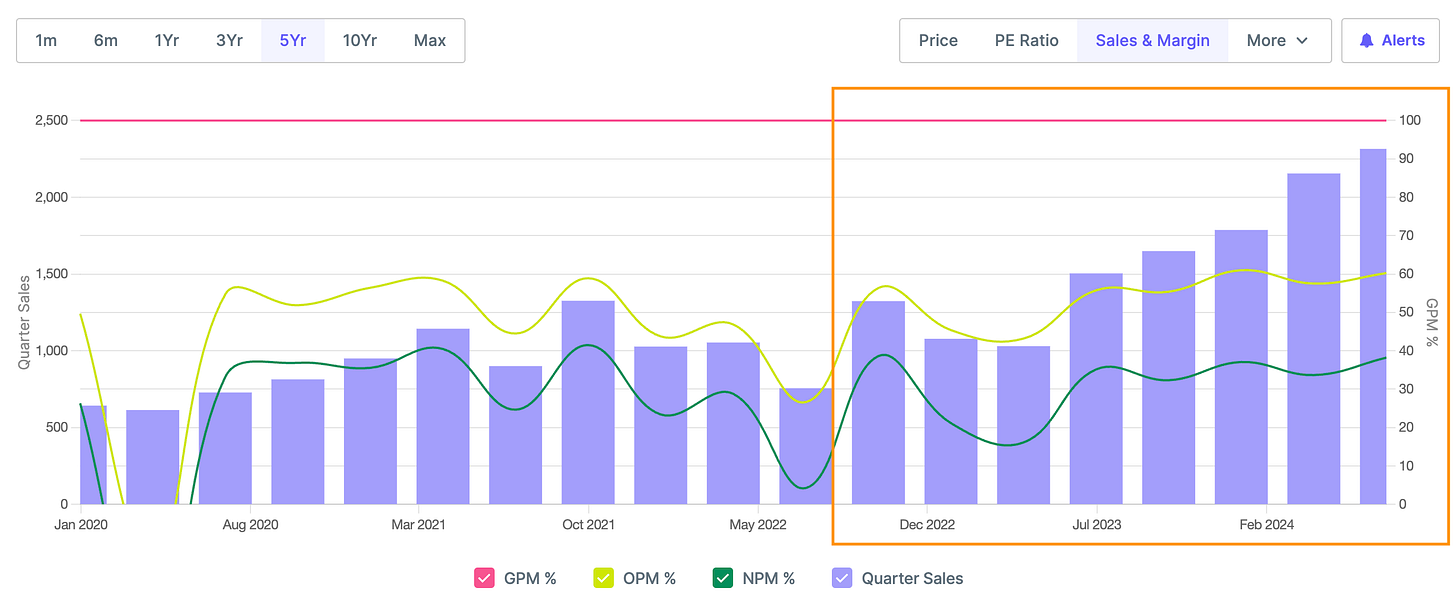
Q1 25 results (QoQ Increase) - Sales increased by 7% and Profits increased by 34%
Q1 25 results (YoY increase) - Sales increased by 54% and Profits increased by 8%
Valuations and EPS - Below chart shows TTM EPS has increased massively and Price has grown almost at the same rate. In the last few months price increase has been faster than EPS leading to EPS stabilising at 17.
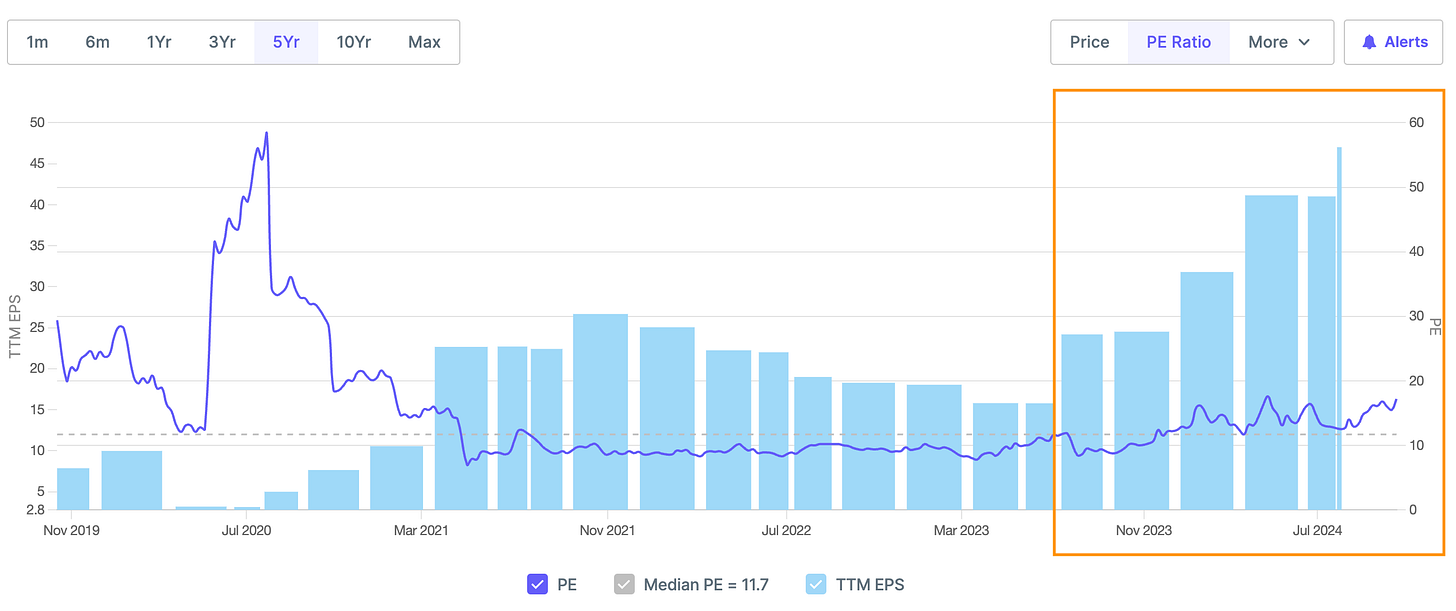
PE consistent at 17 i.e. above historical average
TTM EPS (EPS of Last 4 quarters) - Growing consistently QoQ since July 2023
What led to outperformance
AUM Growth
Total Assets under Advice (AUA) crossed Rs. 5 lakh crores, with Wealth Management AUA growing 105% YoY to Rs. 265,000 crore
Market Share Gains
Cash market share increased by 186 basis points YoY to 8.0%, and Futures & Options premium market share grew by 225 basis points YoY to 9.5%
Revenue Growth
Consolidated operating net revenue up 32% YoY to Rs. 1,133 crore, with consolidated profit after tax growing 52% YoY
Client Acquisition
Acquired around 150,000 new clients in Q1, with coverage expanding to 2,500+ business locations encompassing 98% of India's PIN codes
Systematic Investments
SIP AUM stood at Rs. 14,606 crore, with 5.7 lakh new SIPs added in Q1FY25 and SIP flows of Rs. 1,198 crore for the quarter
Product Portfolio
Expanded offerings with new products in asset management, including growth in AIF AUM crossing Rs. 12,000 crore mark
Distribution Channels
Robust network of 2,000 internal relationship managers and over 8,800 external wealth managers, with Private Wealth RM count growing 37% YoY to 576
Nippon Life India Asset Management - Market Cap 41,000+ Cr
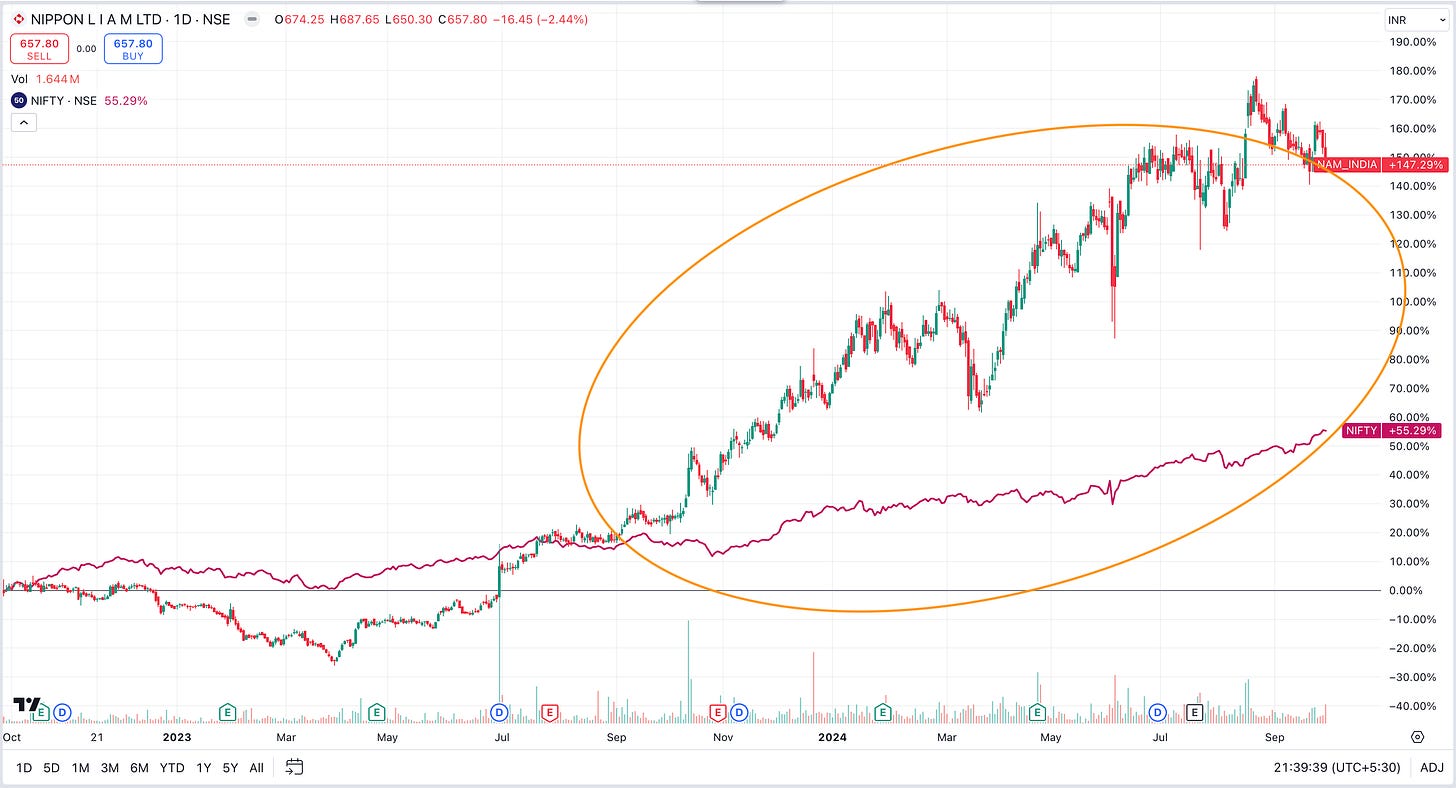
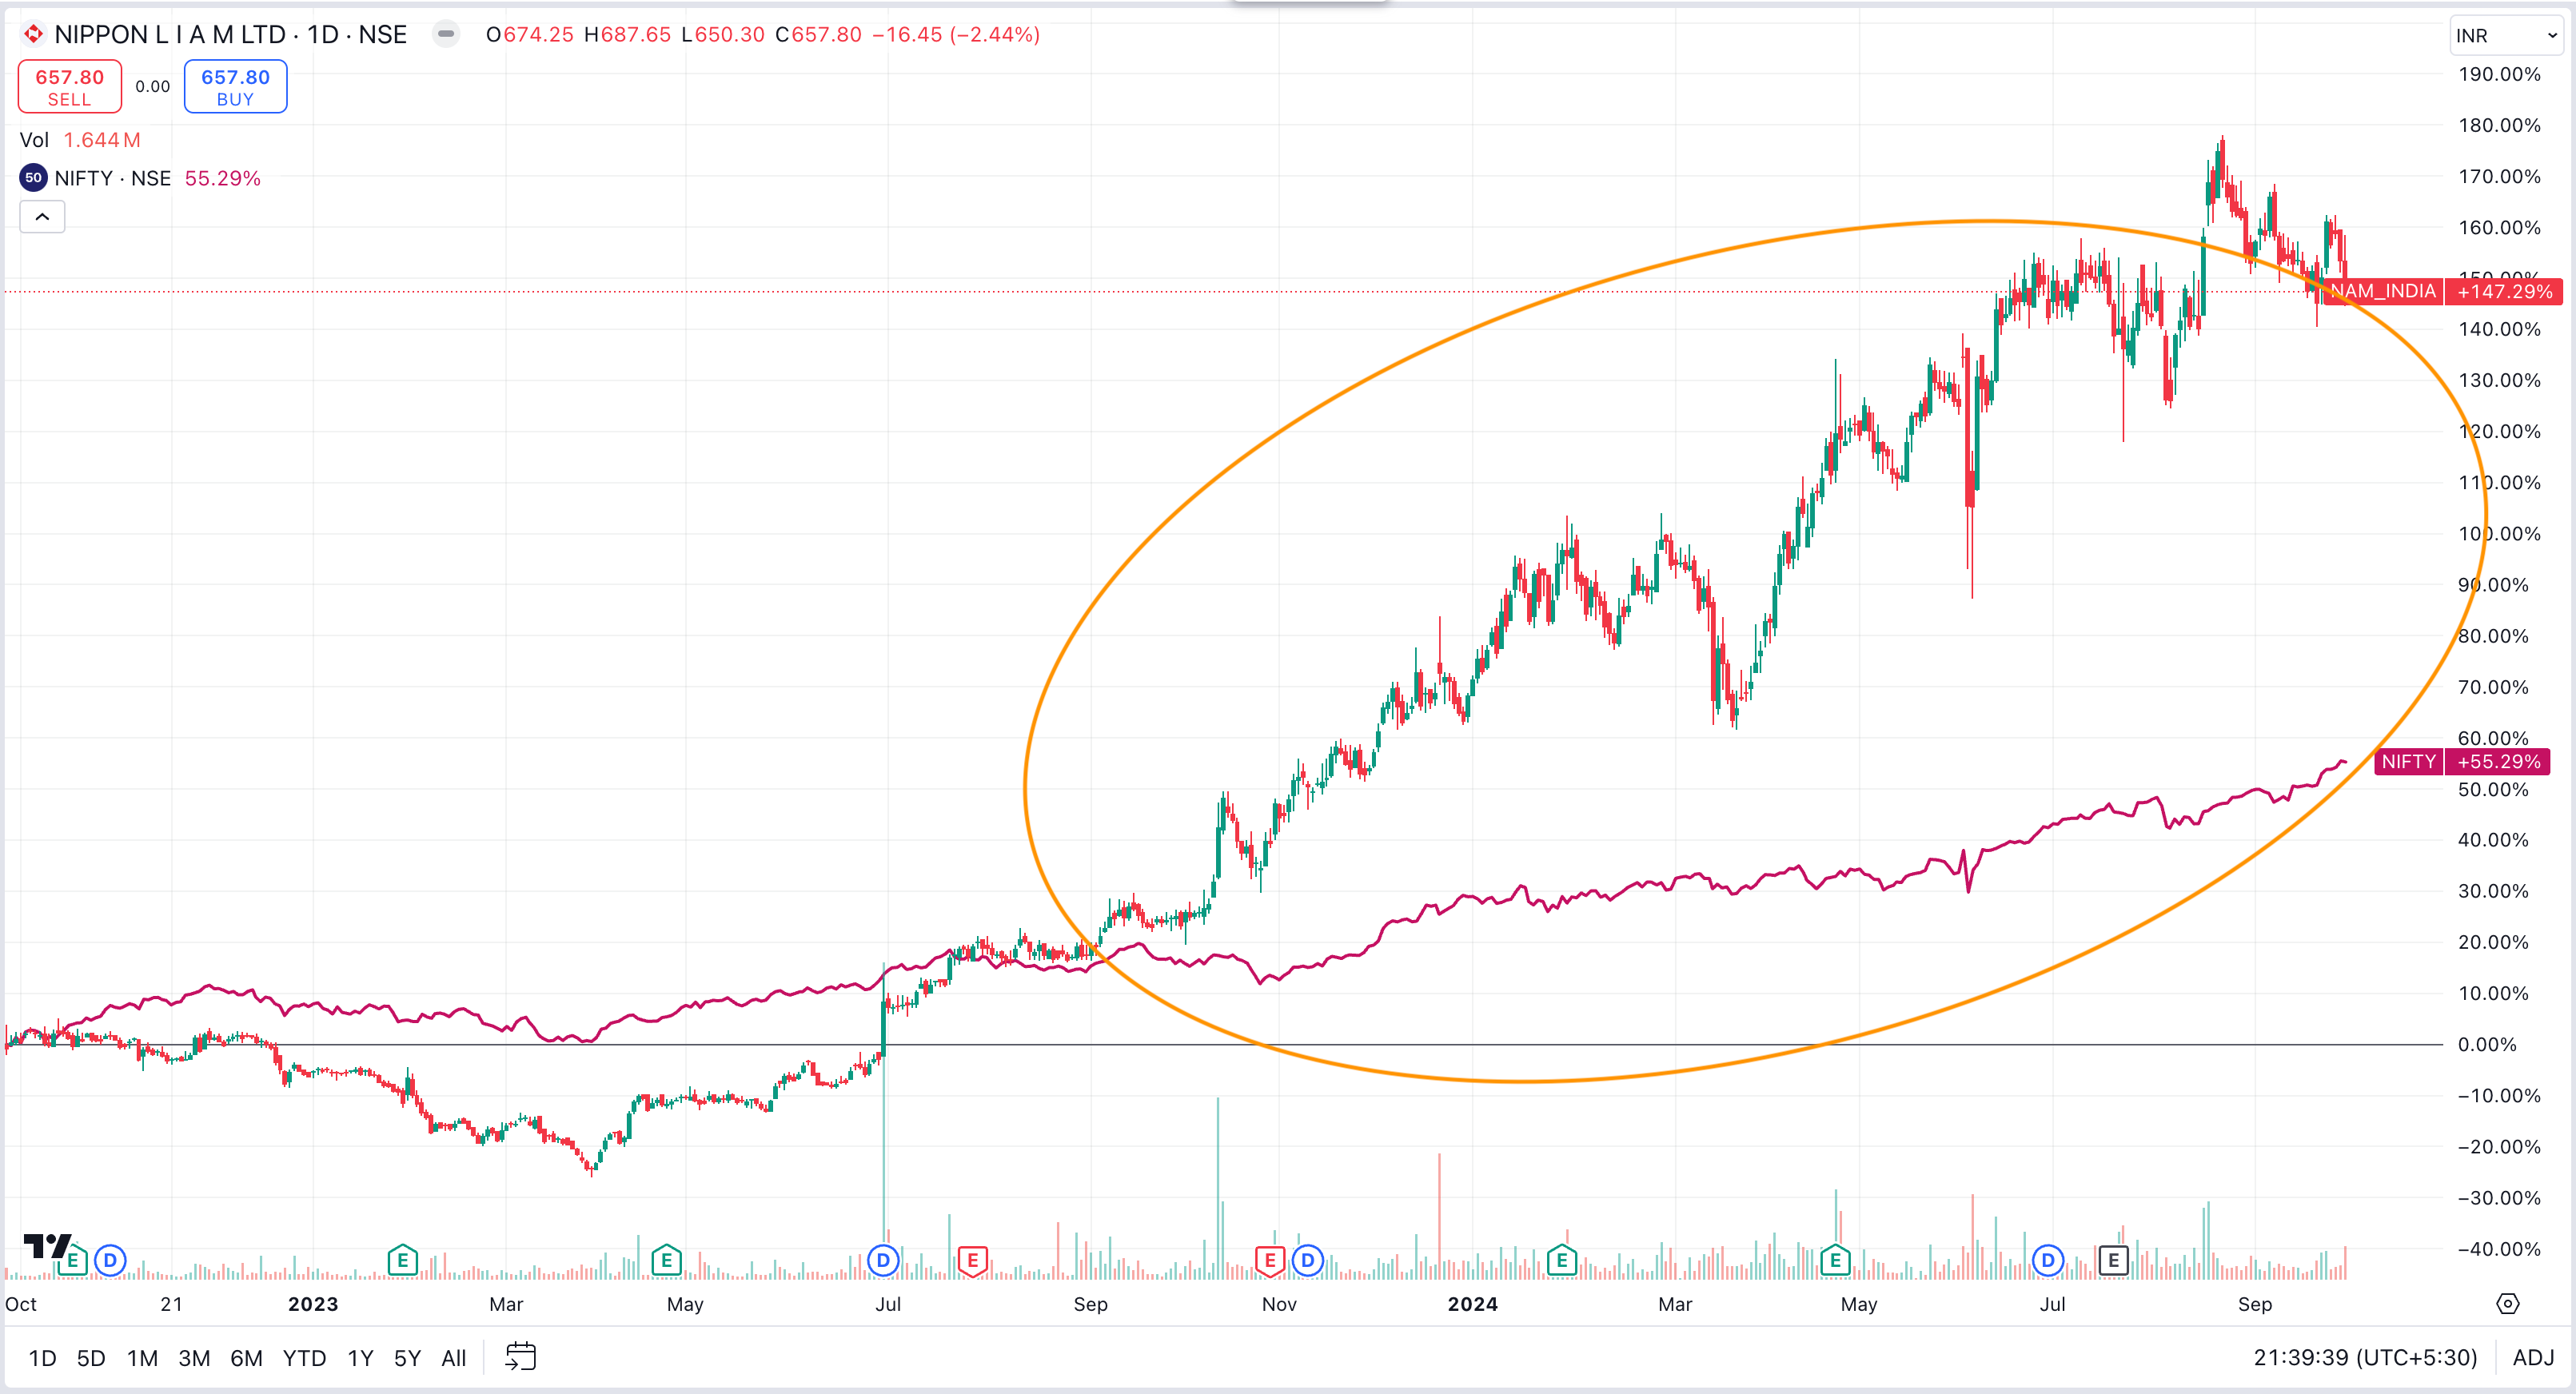
Price Action - Since Oct 22, NAM - 147%, NIFTY 55%
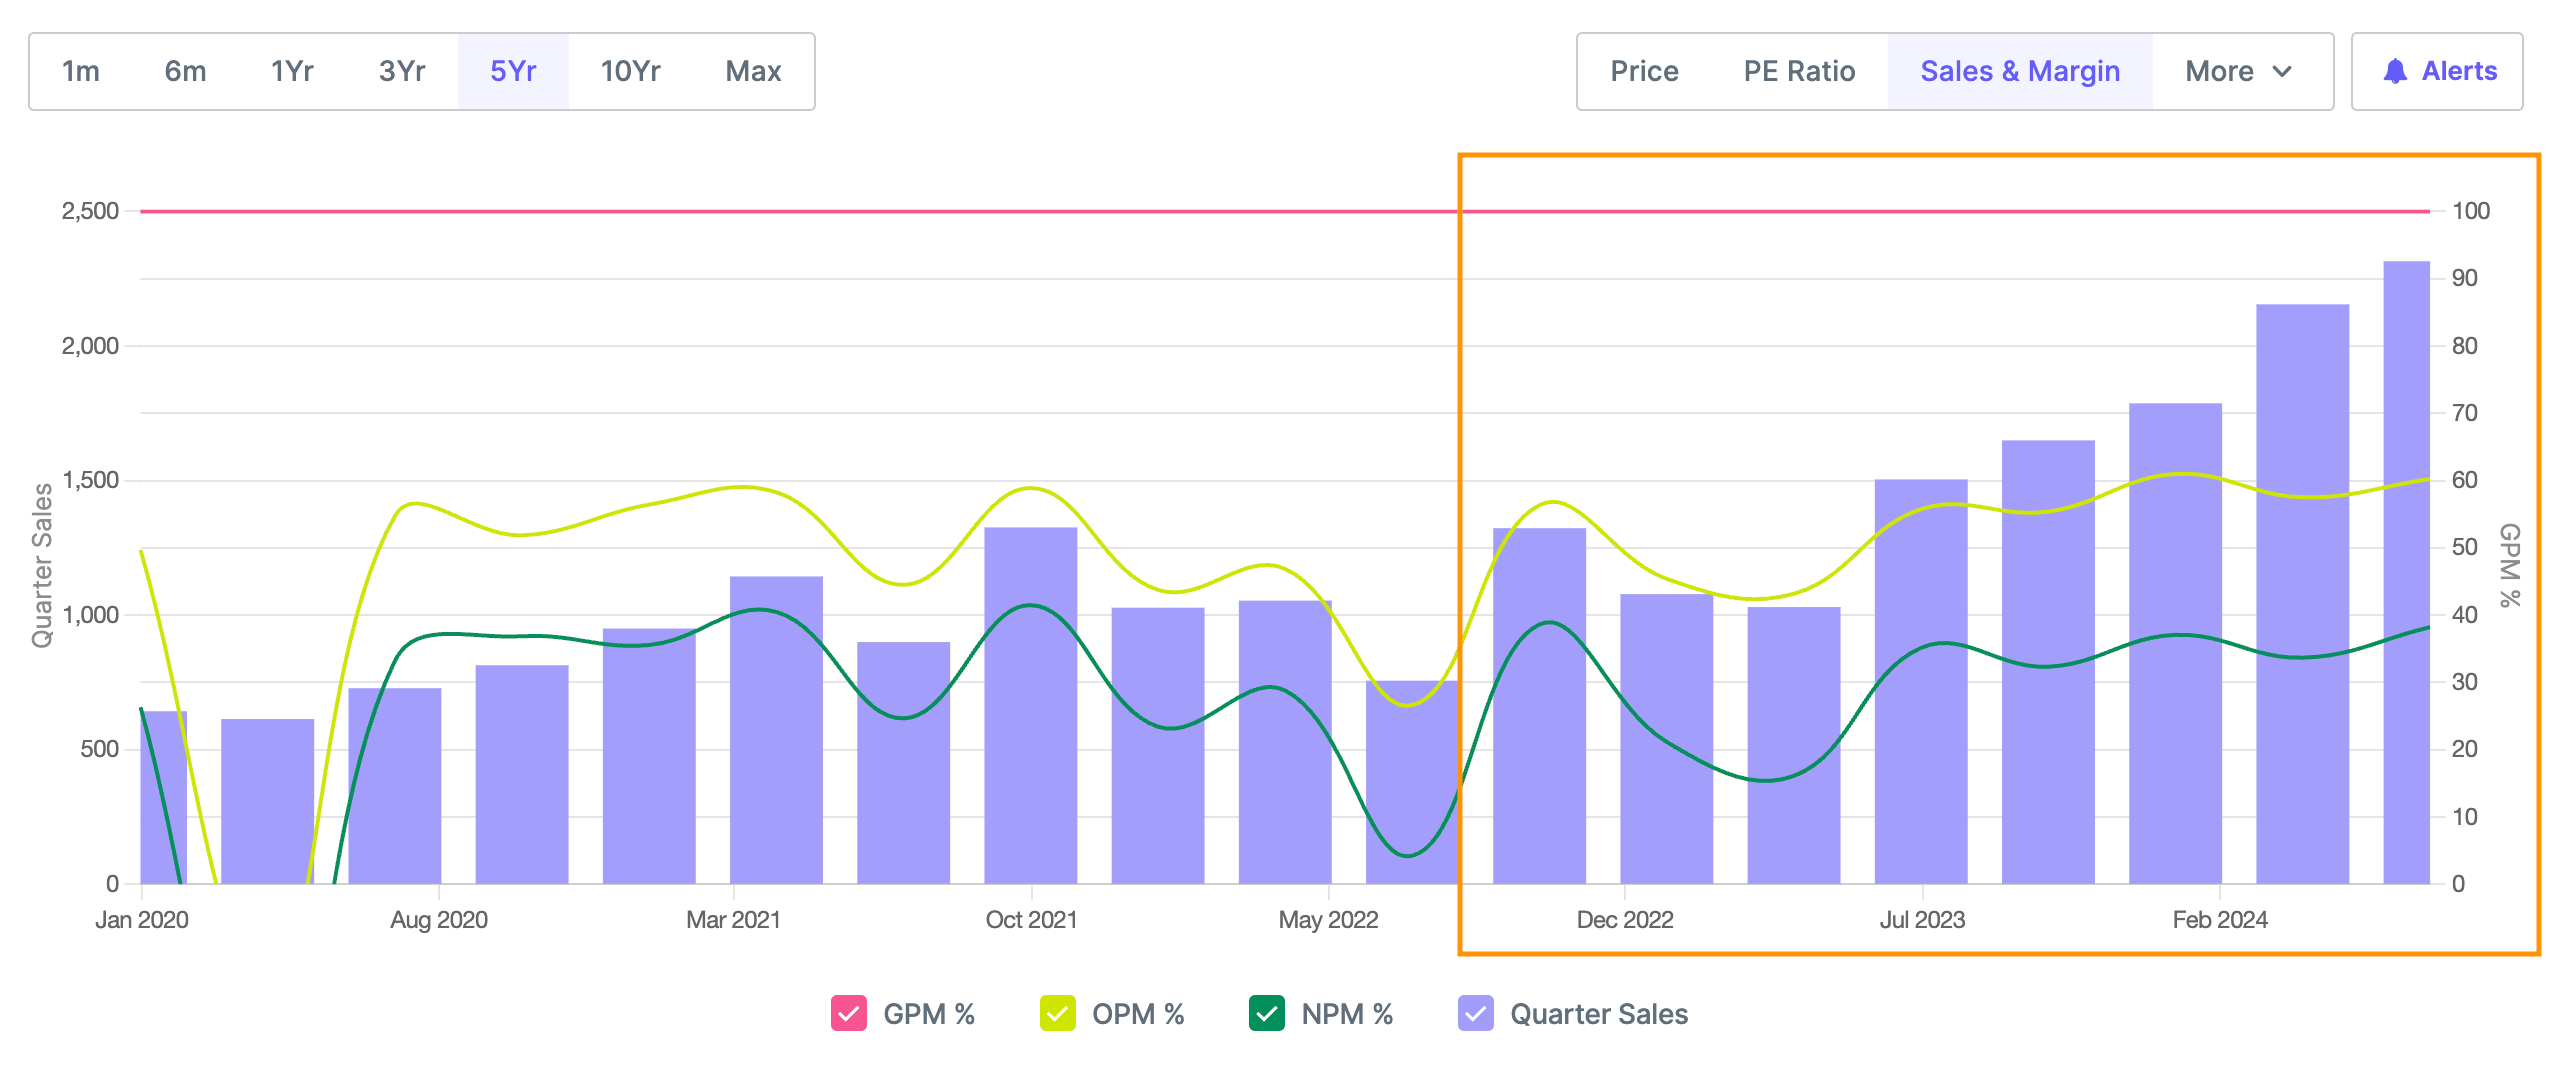
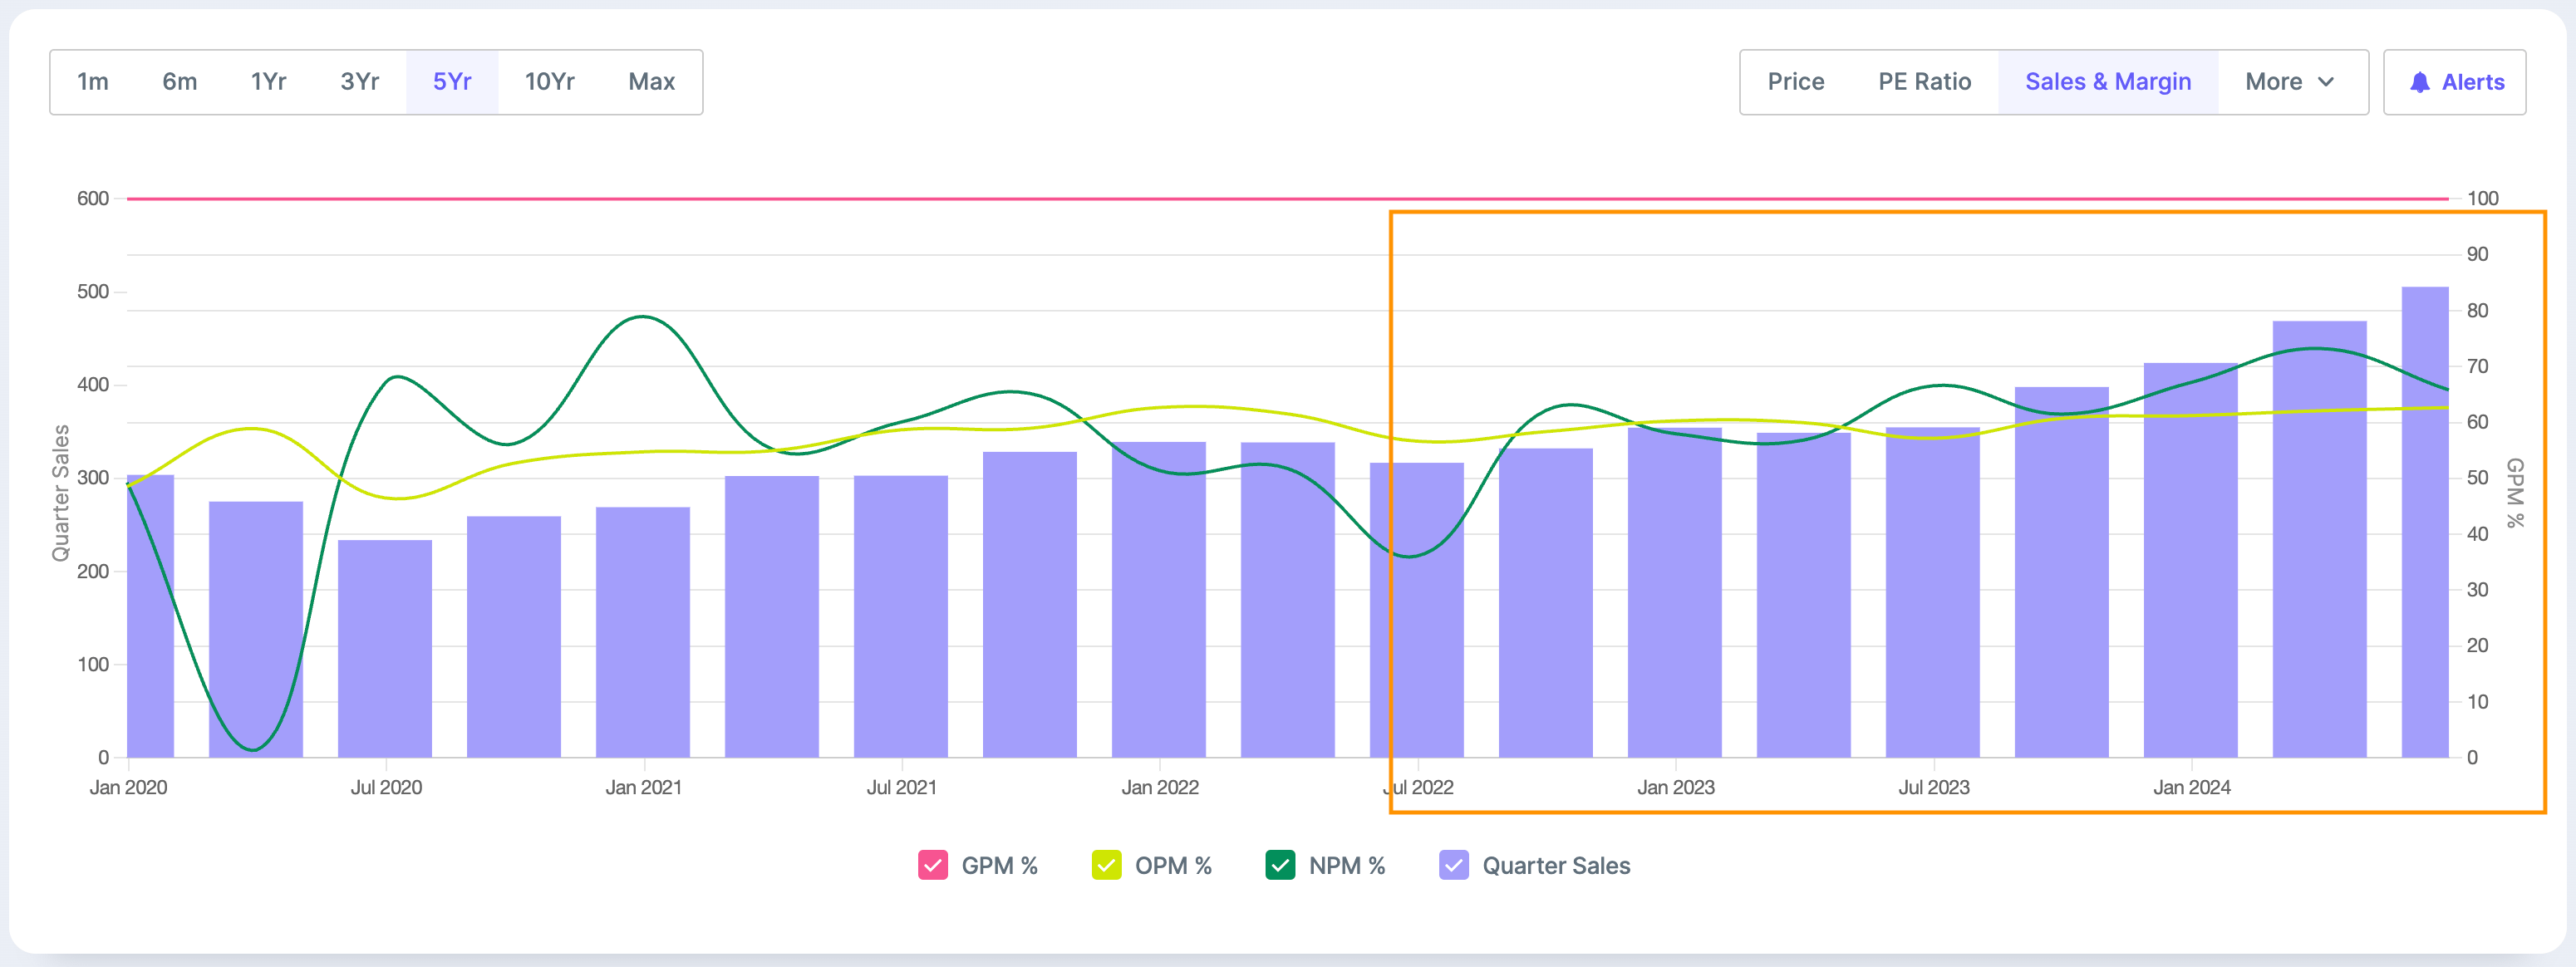
Operational metrics performance - Below chart shows Gross, Operating and Net Profit Margin improving quarterly since July 2022 but revenue scaling up massively from July 2023
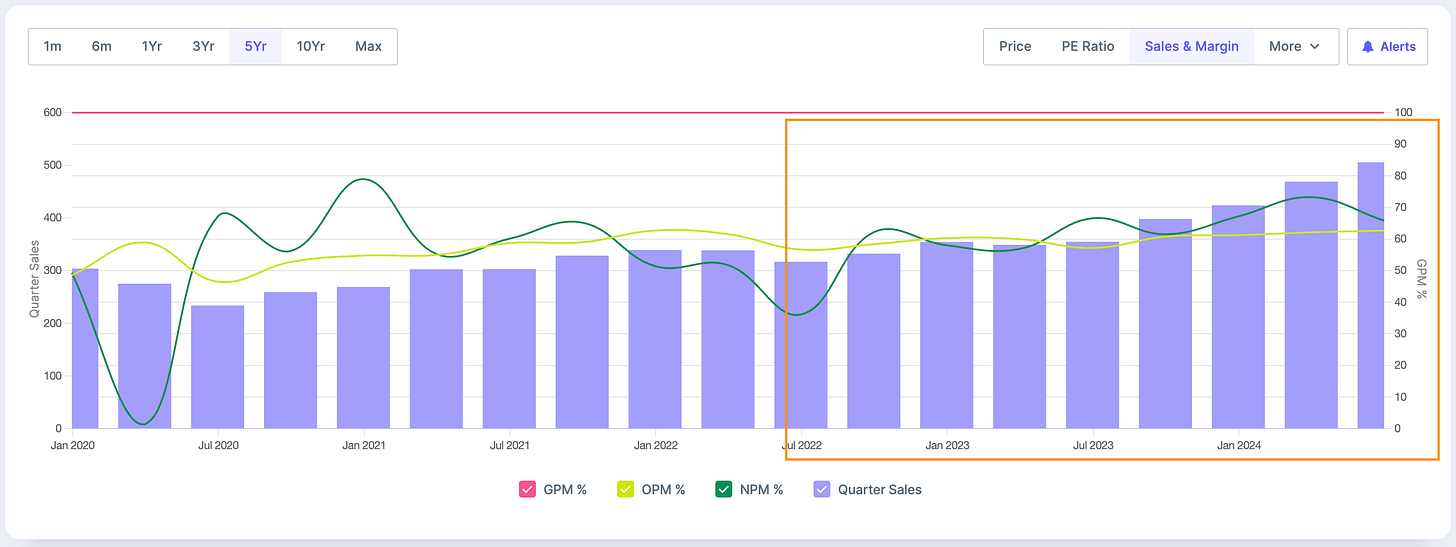
Q1 25 results (QoQ Increase) - Sales increased by 8% and Profits decreased by 1%
Q1 25 results (YoY increase) - Sales increased by 43% and Profits increased by 10%
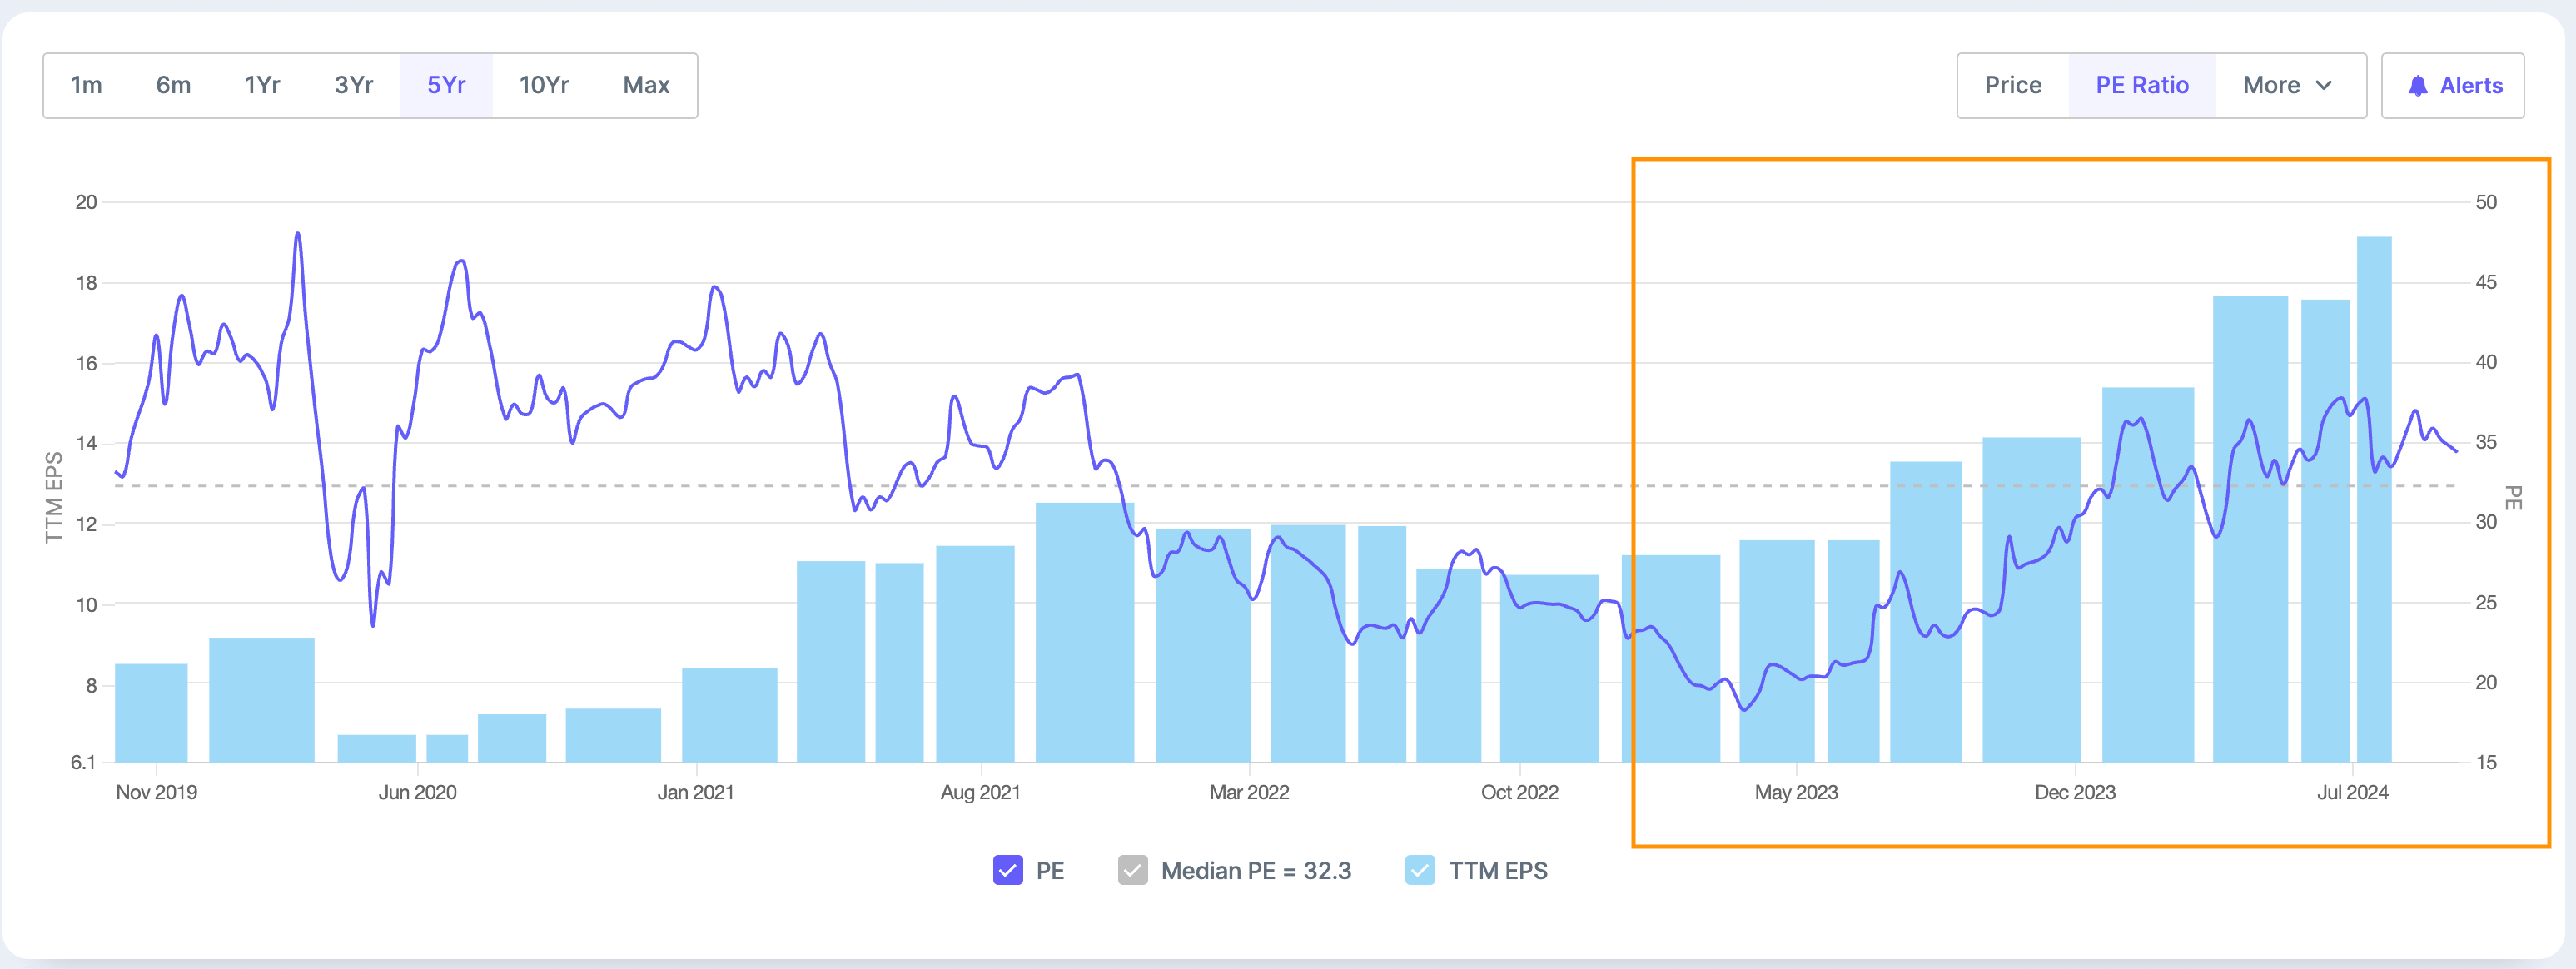
Valuations and EPS - Below chart shows Price has grown faster than TTM EPS (EPS of last 4 quarters) from April 2023 to Jan 2024 and from Jan 2024 both have grown at the same pace leading to PE stablizing at 35
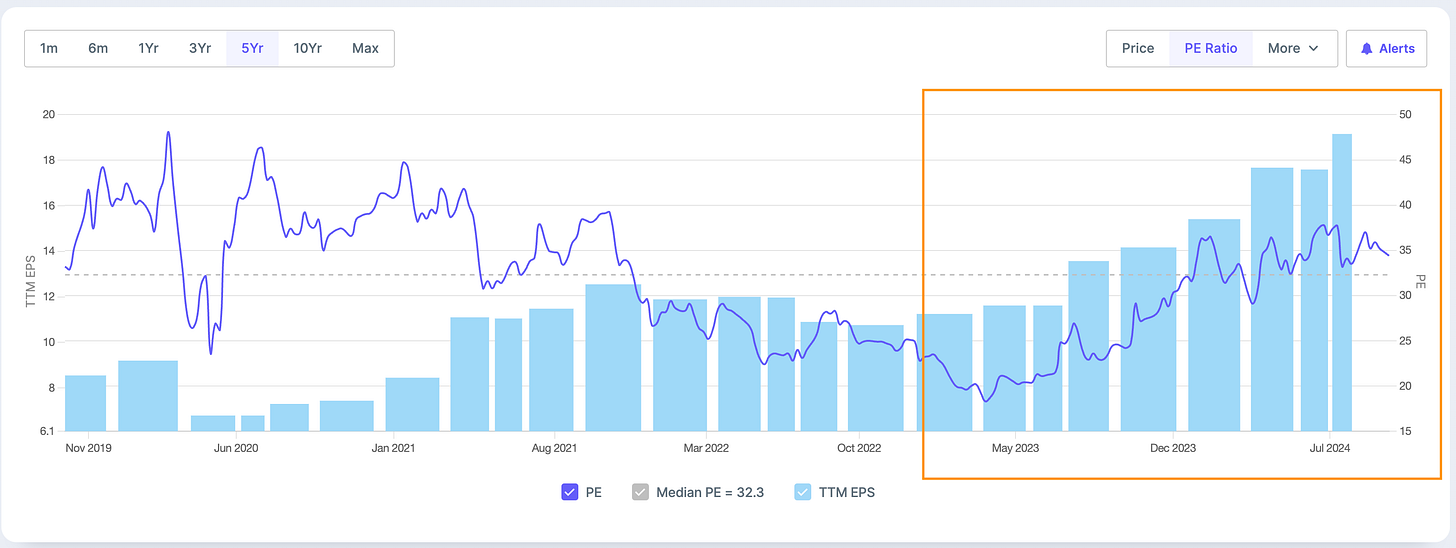
PE consistent at 35 i.e. around historical average
TTM EPS (EPS of Last 4 quarters) - Growing consistently QoQ since April 2023
What led to outperformance
AUM Growth
Mutual Fund QAAUM grew 12% QoQ & 54% YoY to reach INR 4.84 trillion
Market Share Gains
Overall market share increased 24 bps QoQ and 93 bps YoY to 8.20%, with increases across all asset categories
Revenue Growth
Revenue stood at INR 5.05 bn, up 43% YoY and 8% QoQ
Client Acquisition
Largest base in the Mutual Fund industry with 17.5 mn unique investors, over 1 in 3 mutual fund investors
Systematic Investments
Monthly systematic book rose by 11% QoQ to INR 25.8 bn for June 2024
Product Portfolio
Passive AUM, including ETFs and Index Funds, crossed INR 1.5 trillion
Distribution Channels
Digital purchase transactions rose to 2.82 million in Q1 FY25, up 170% YoY
Cost Management
Maintaining cost discipline while investing in growth opportunities, with controlled expense growth of 12-13% annually
360One - Market cap 34,000 Cr+
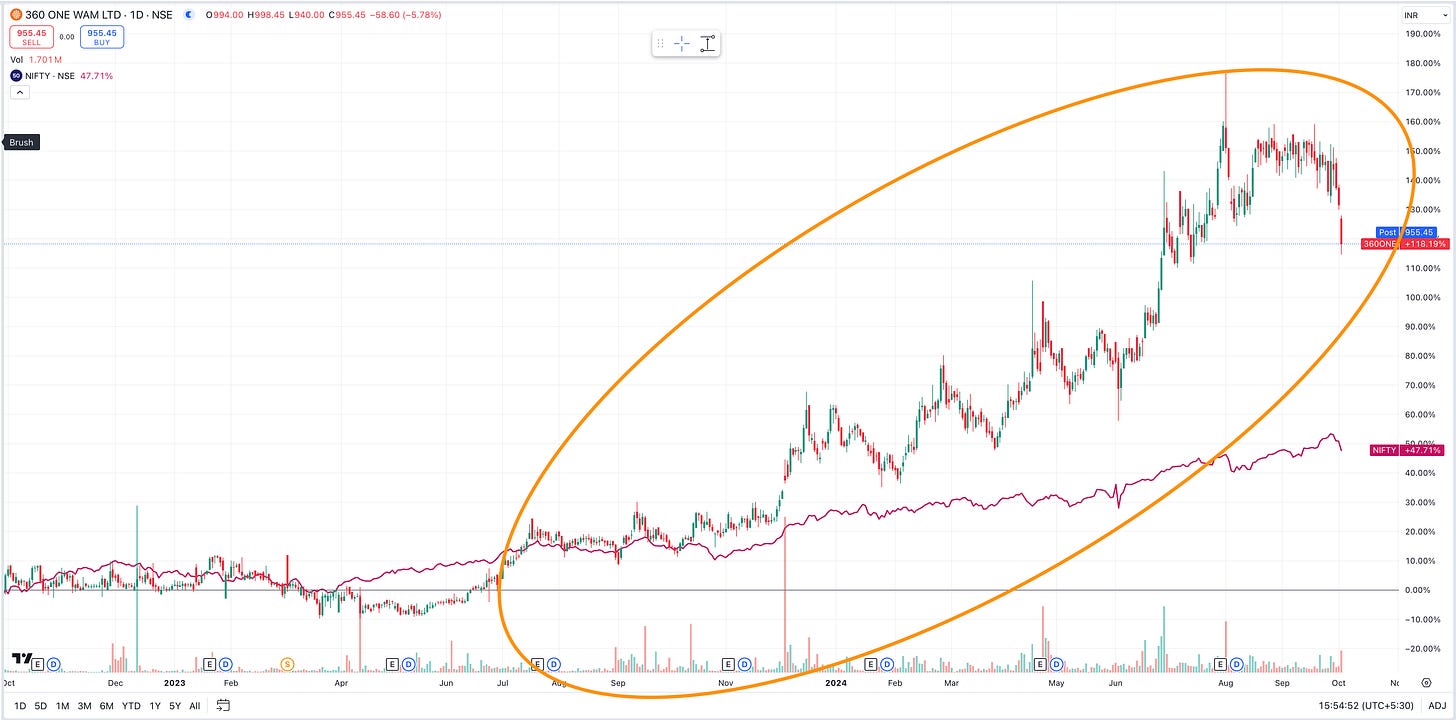
Price Action - Since Oct 22, 360One - 118%, NIFTY 47%
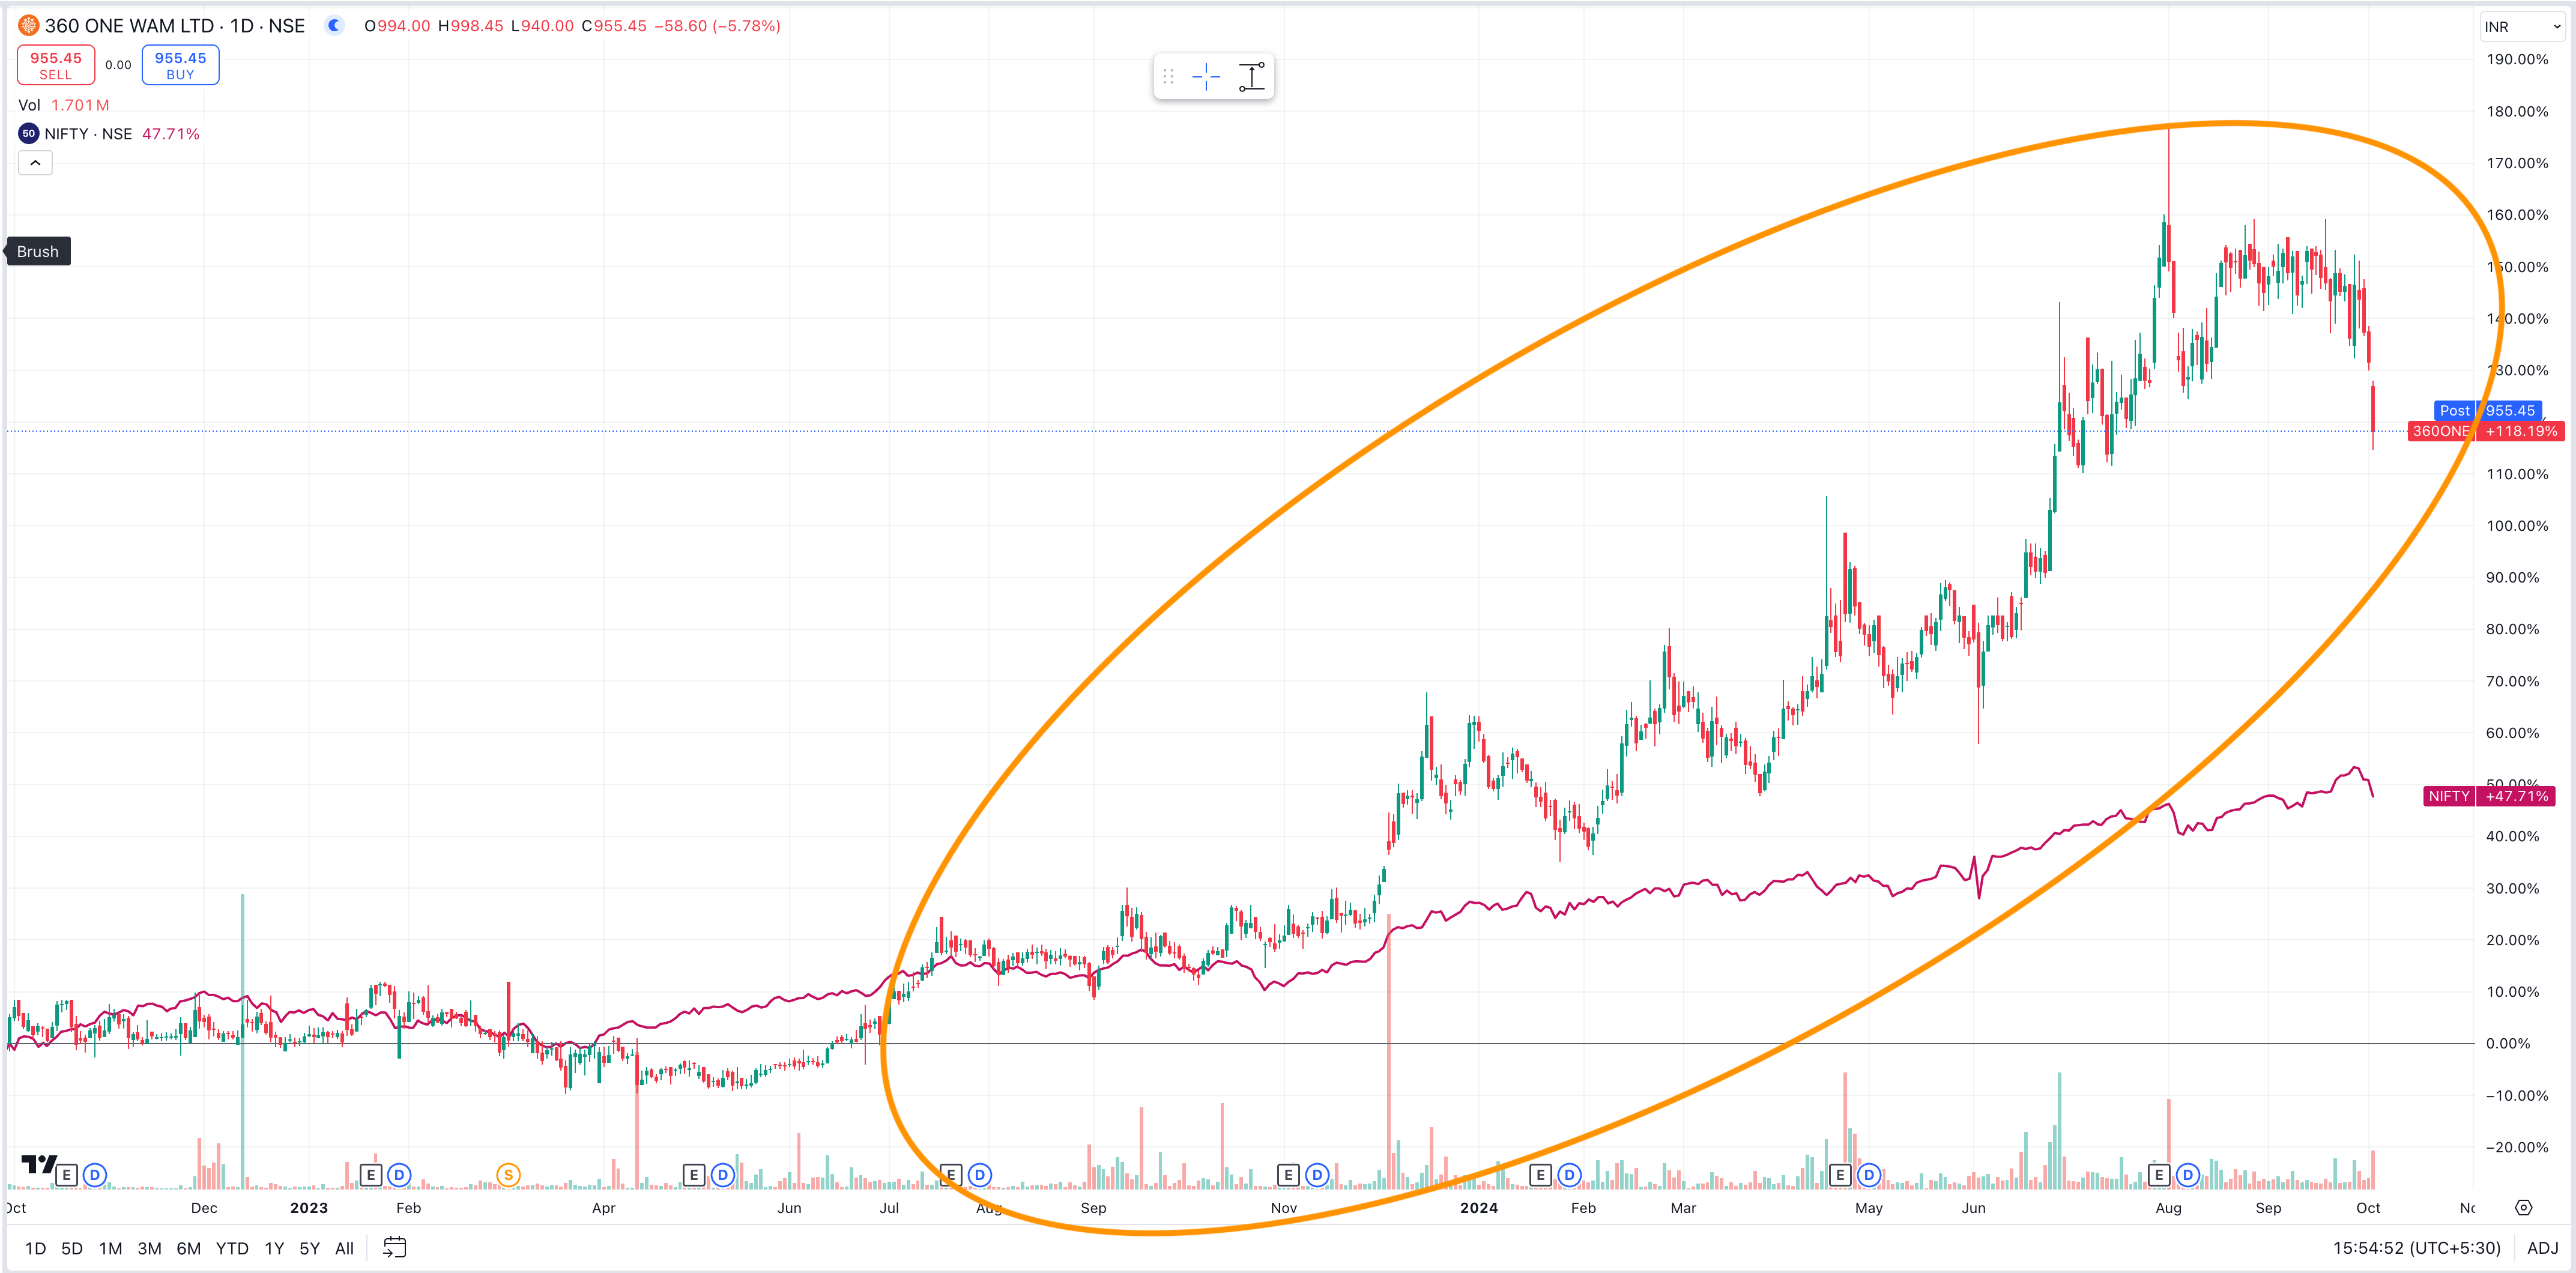
Operational metrics performance - Below chart shows Operating and Net Profit Margin improving quarterly since July 2022 but revenue scaling up massively from July 2023
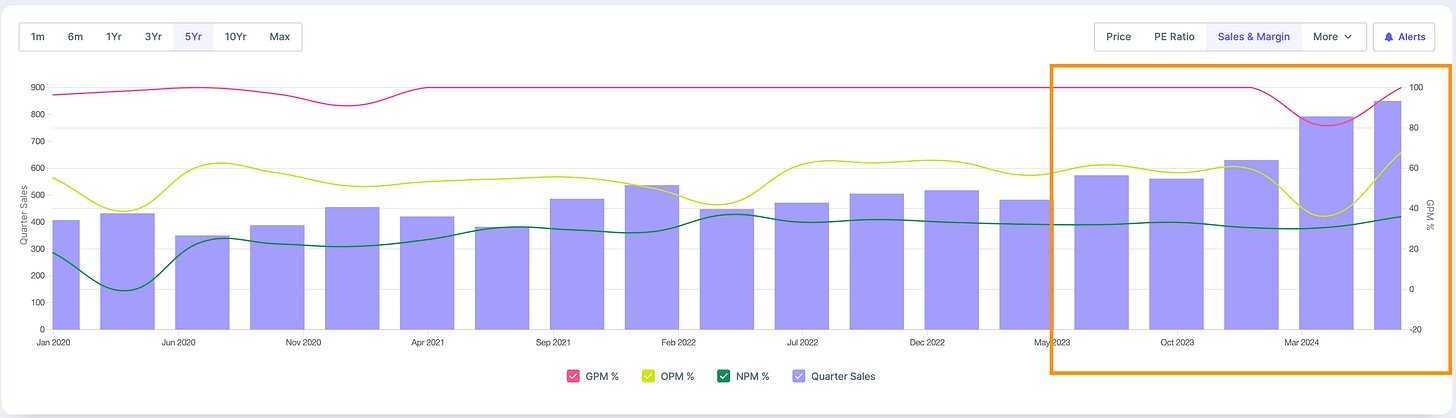
Q1 25 results (QoQ Increase) - Sales increased by 7% and Profits increased by 8%
Q1 25 results (YoY increase) - Sales increased by 48% and Profits increased by 10%
Valuations and EPS - Below chart shows Price has grown faster than TTM EPS (EPS of last 4 quarters) from April 2023 and is currently at 40 higher than historical average
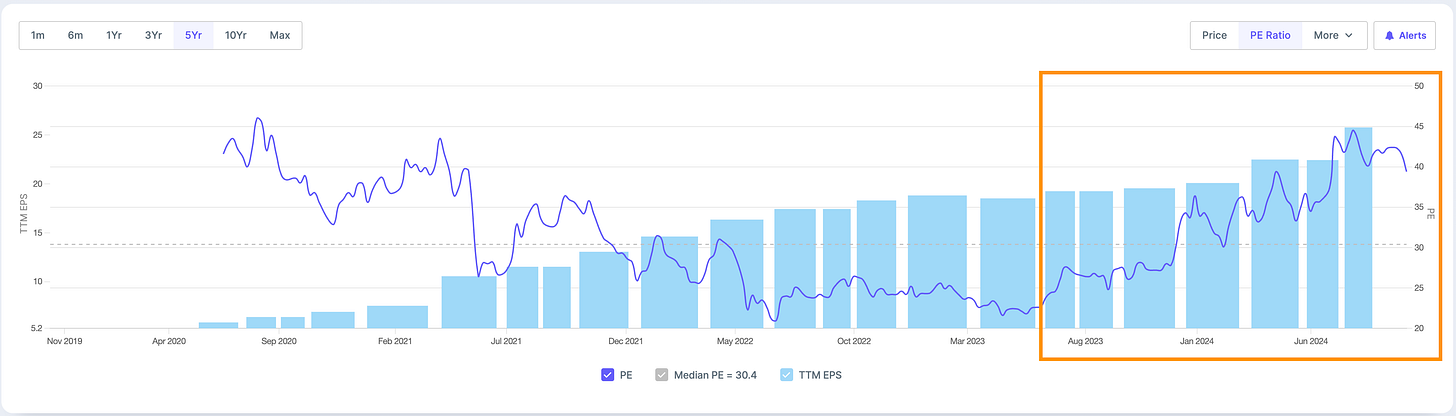
PE at 40 i.e. above historical average
TTM EPS (EPS of Last 4 quarters) - Growing consistently QoQ since April 2023
What led to outperformance
AUM Growth
Total ARR AUM increased to Rs 2,21,287 Crs, up 34% YoY, with strong growth across Wealth and Asset Management segments
Revenue Growth
Total Revenues up 60.6% YoY at Rs 697 Crs, driven by ARR growth and strong transactional income
Cost Management
Total Costs up 25.9% YoY to Rs 265 Crs, growing at a slower pace than revenue
Improved Efficiency
Cost-to-income ratio declined to 38% from 48.2% in Q4 FY24, leading to 71.8% YoY growth in operating profit
Client Acquisition
Onboarded 150+ new clients with Rs 10 Crs+ ARR AUM, expanding total client base to 7,400+
Net Flows
Strong overall net flows of Rs 5,549 Crs, with significant contributions from both Wealth and Asset Management
Retention and Yields
Overall ARR retentions remained strong at 72 basis points, indicating client stickiness and pricing power
Diversified Revenue Streams
Focus on increasing ARR revenue share while capitalizing on transactional opportunities in private markets
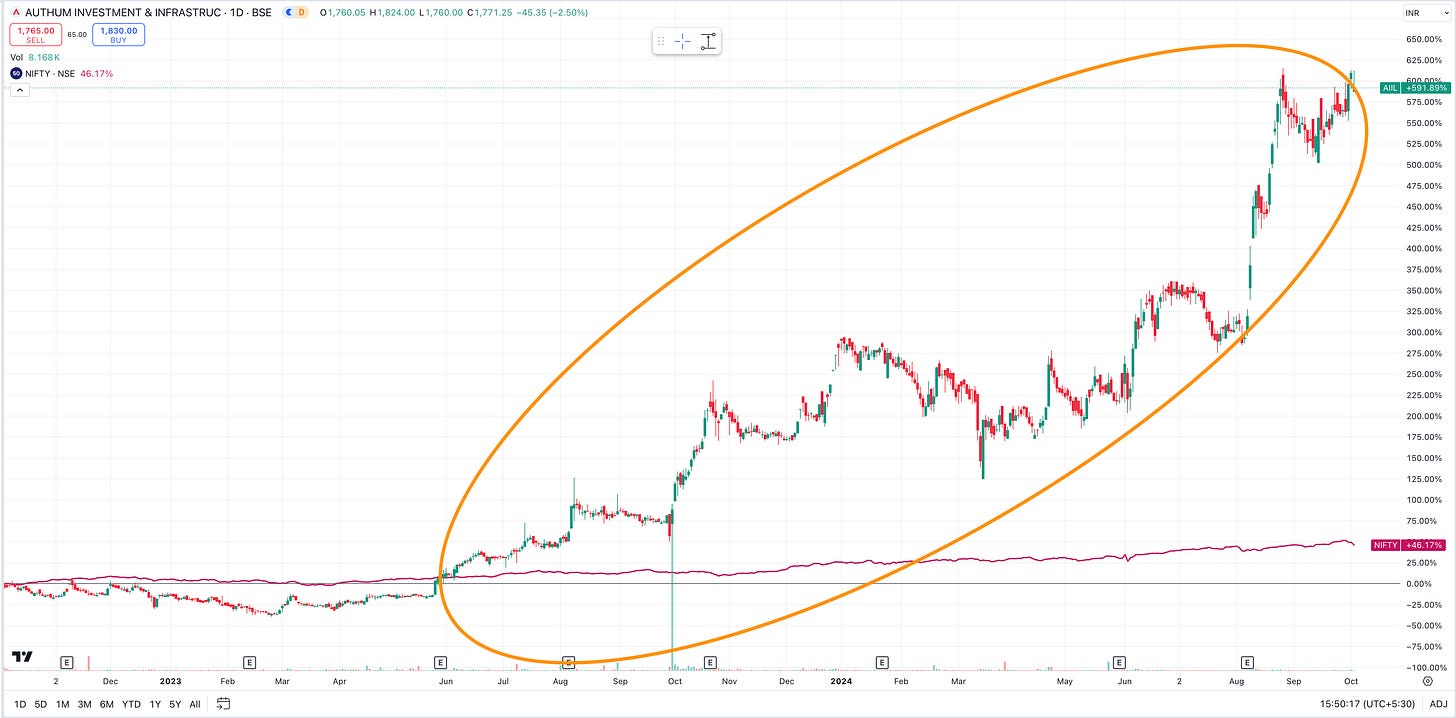
Authum Investment and Infra - Market cap 30,000 Cr+
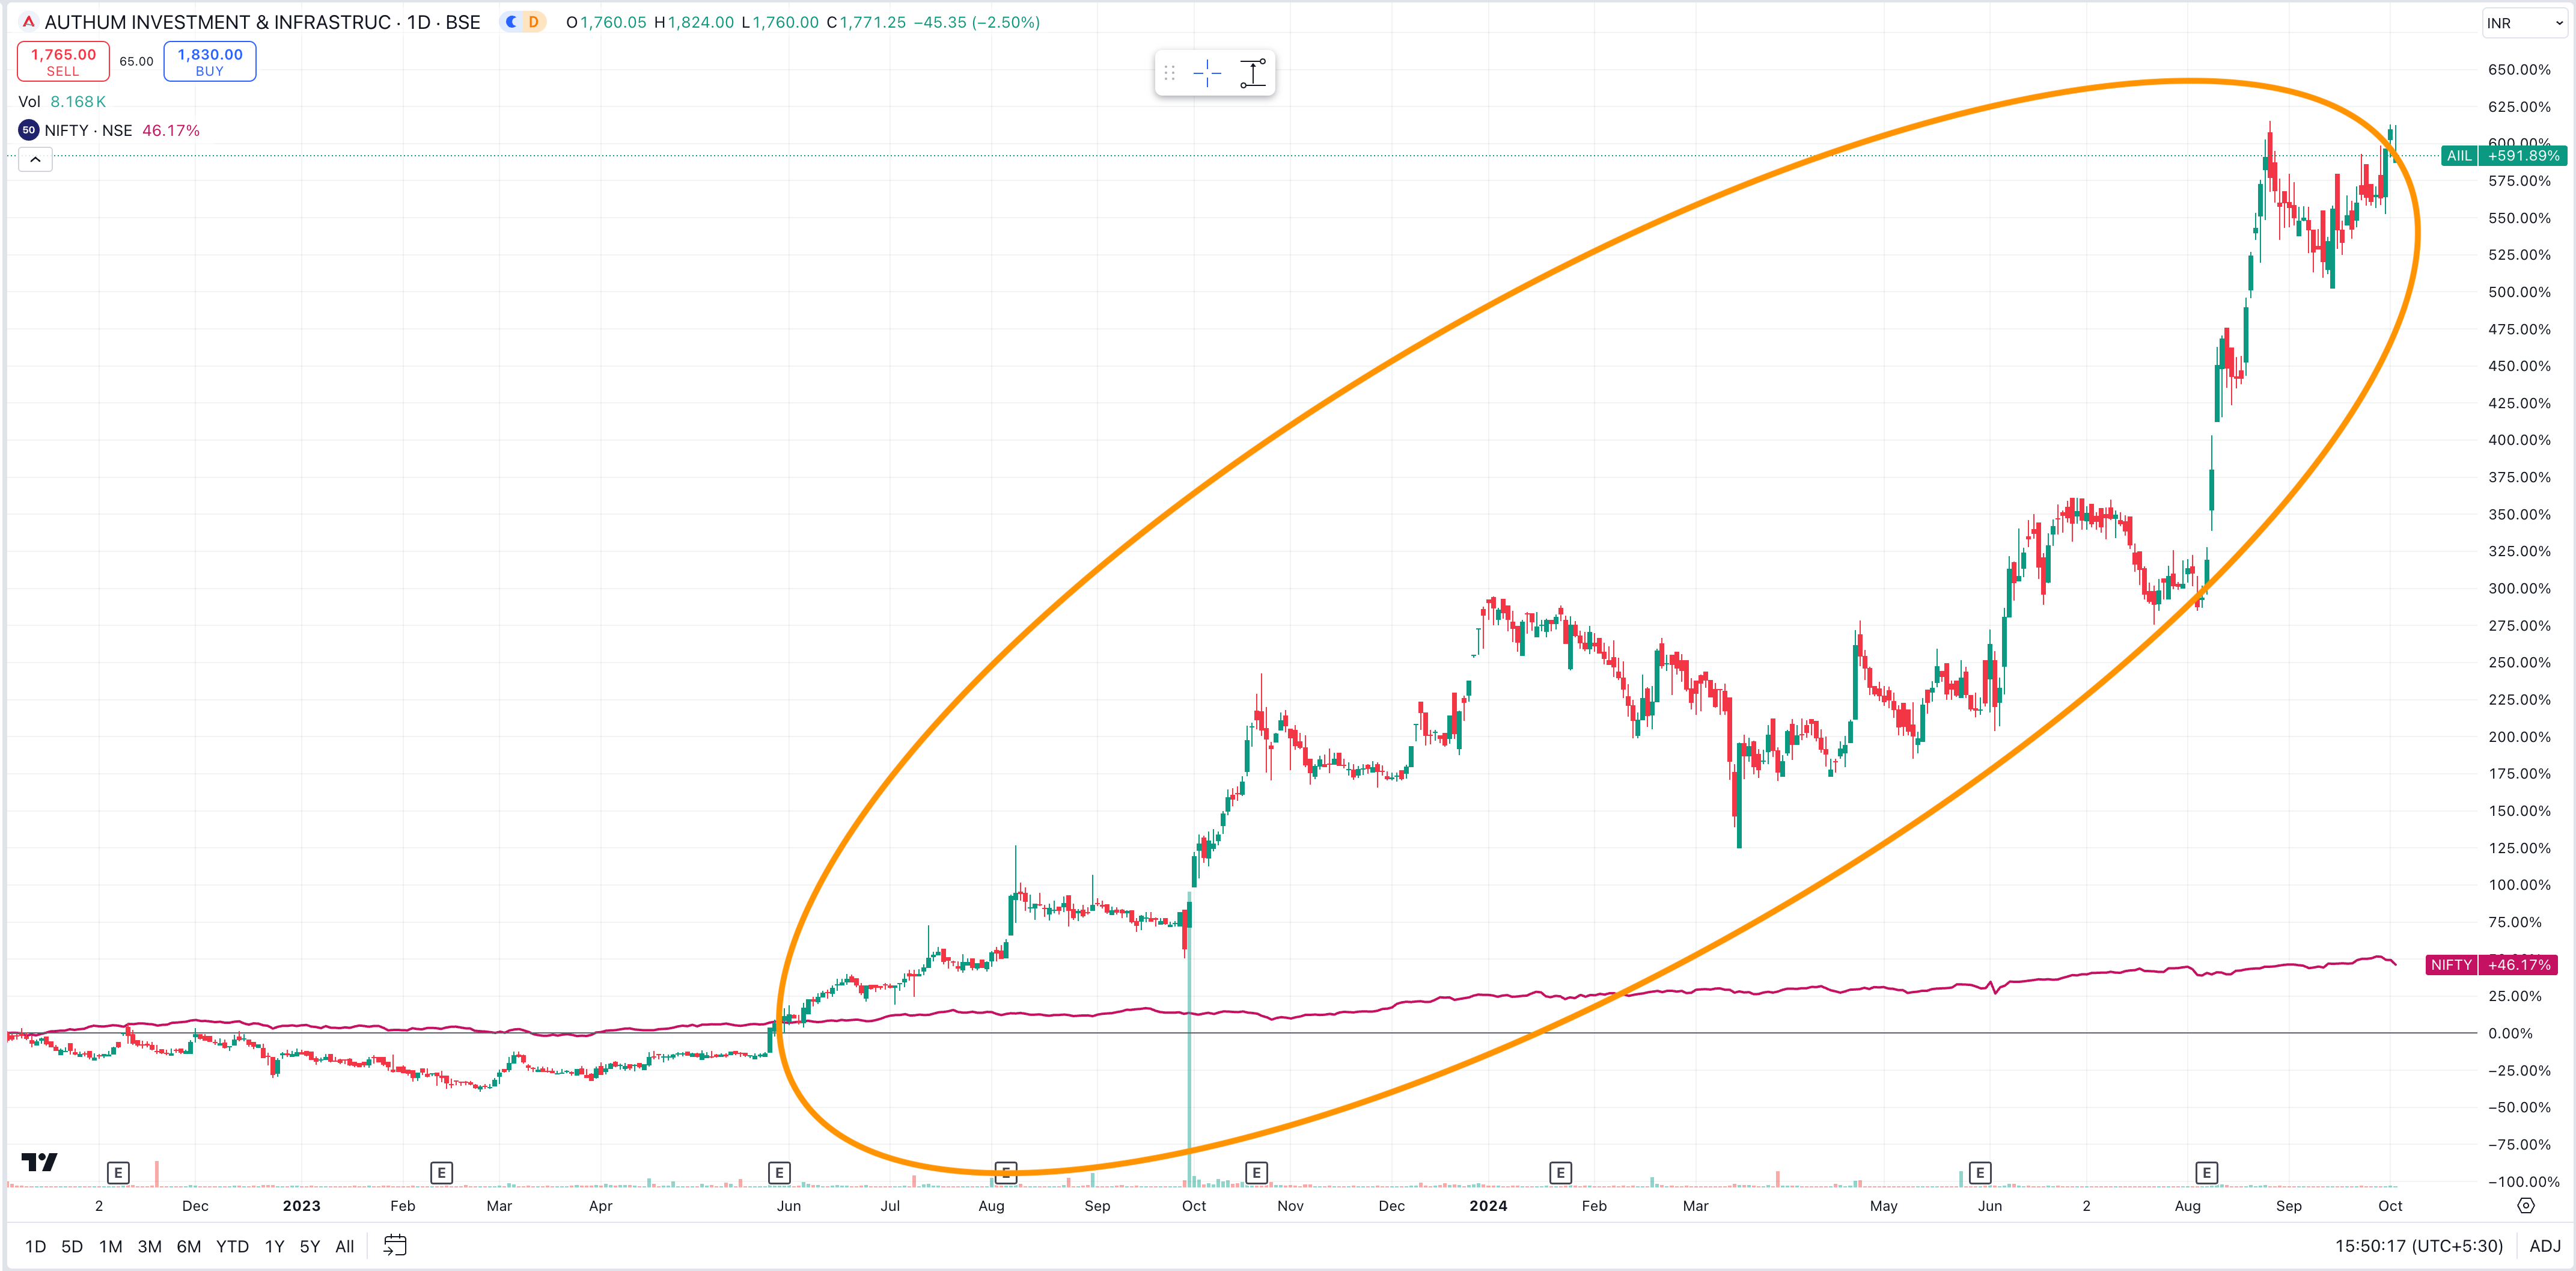
Price Action - Since Oct 22, Authum - 591%, NIFTY 46%
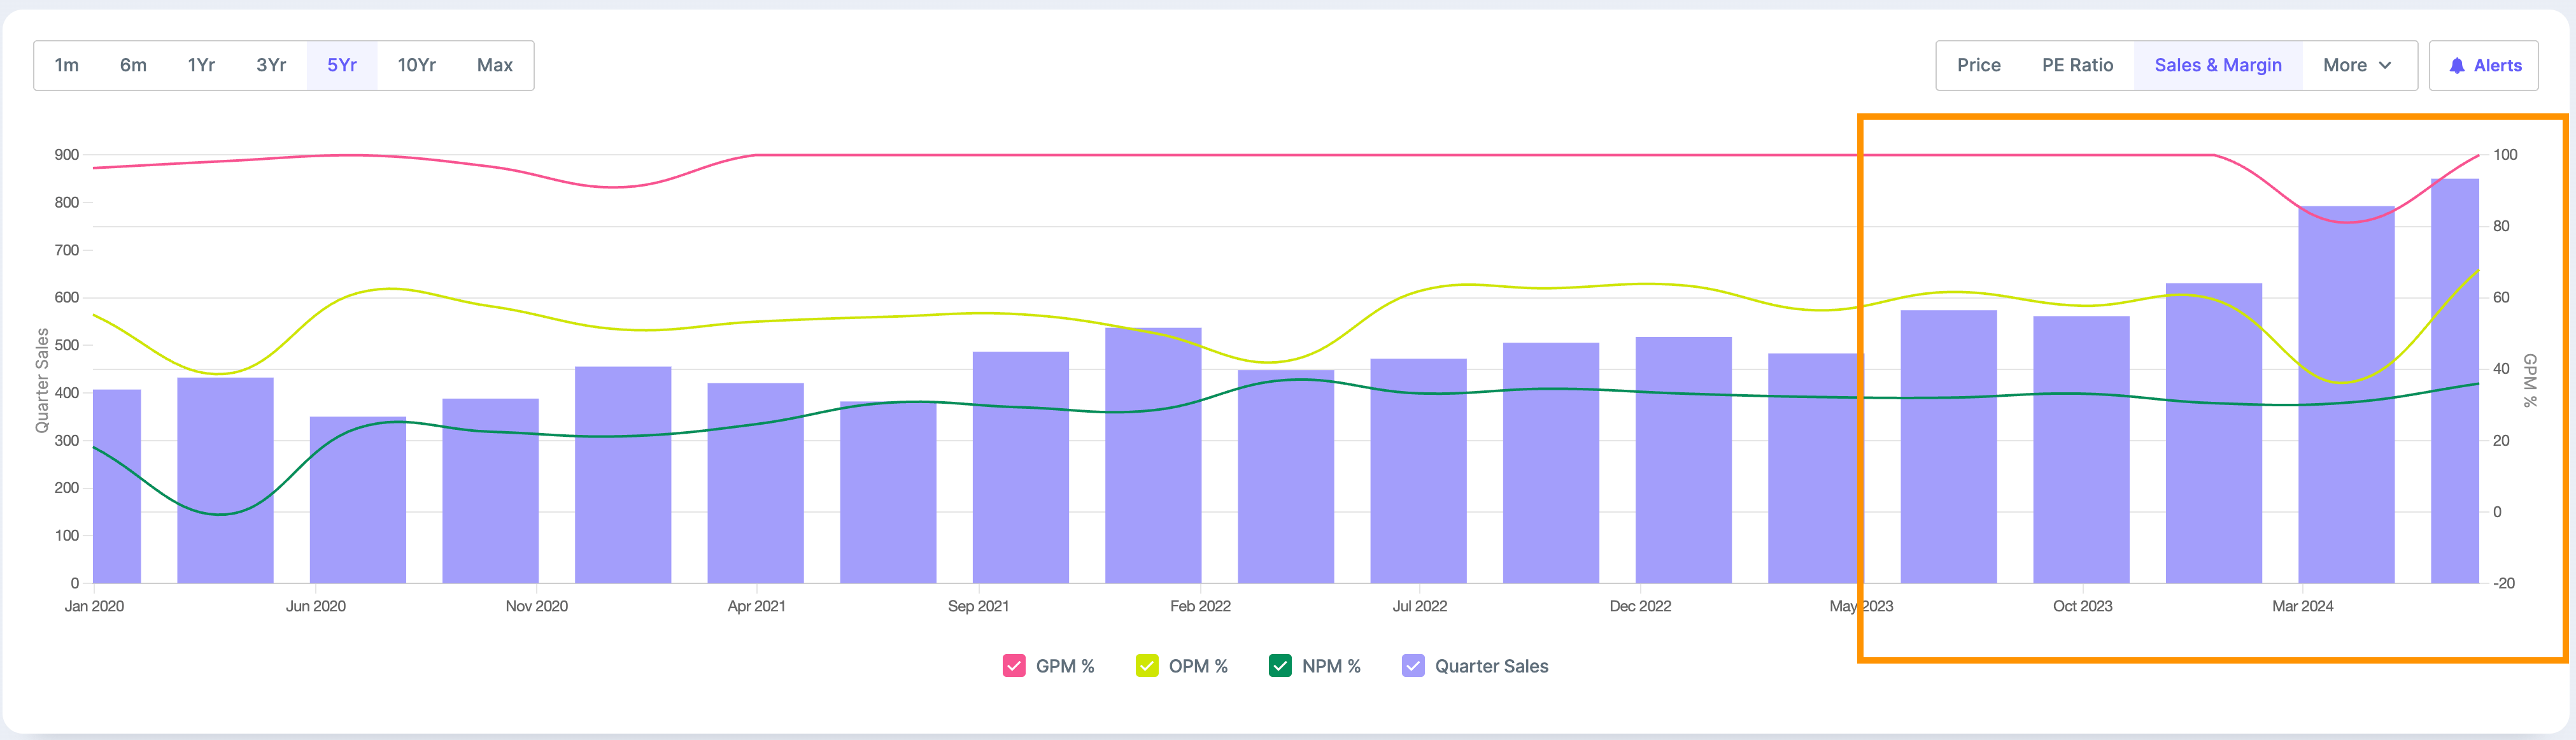
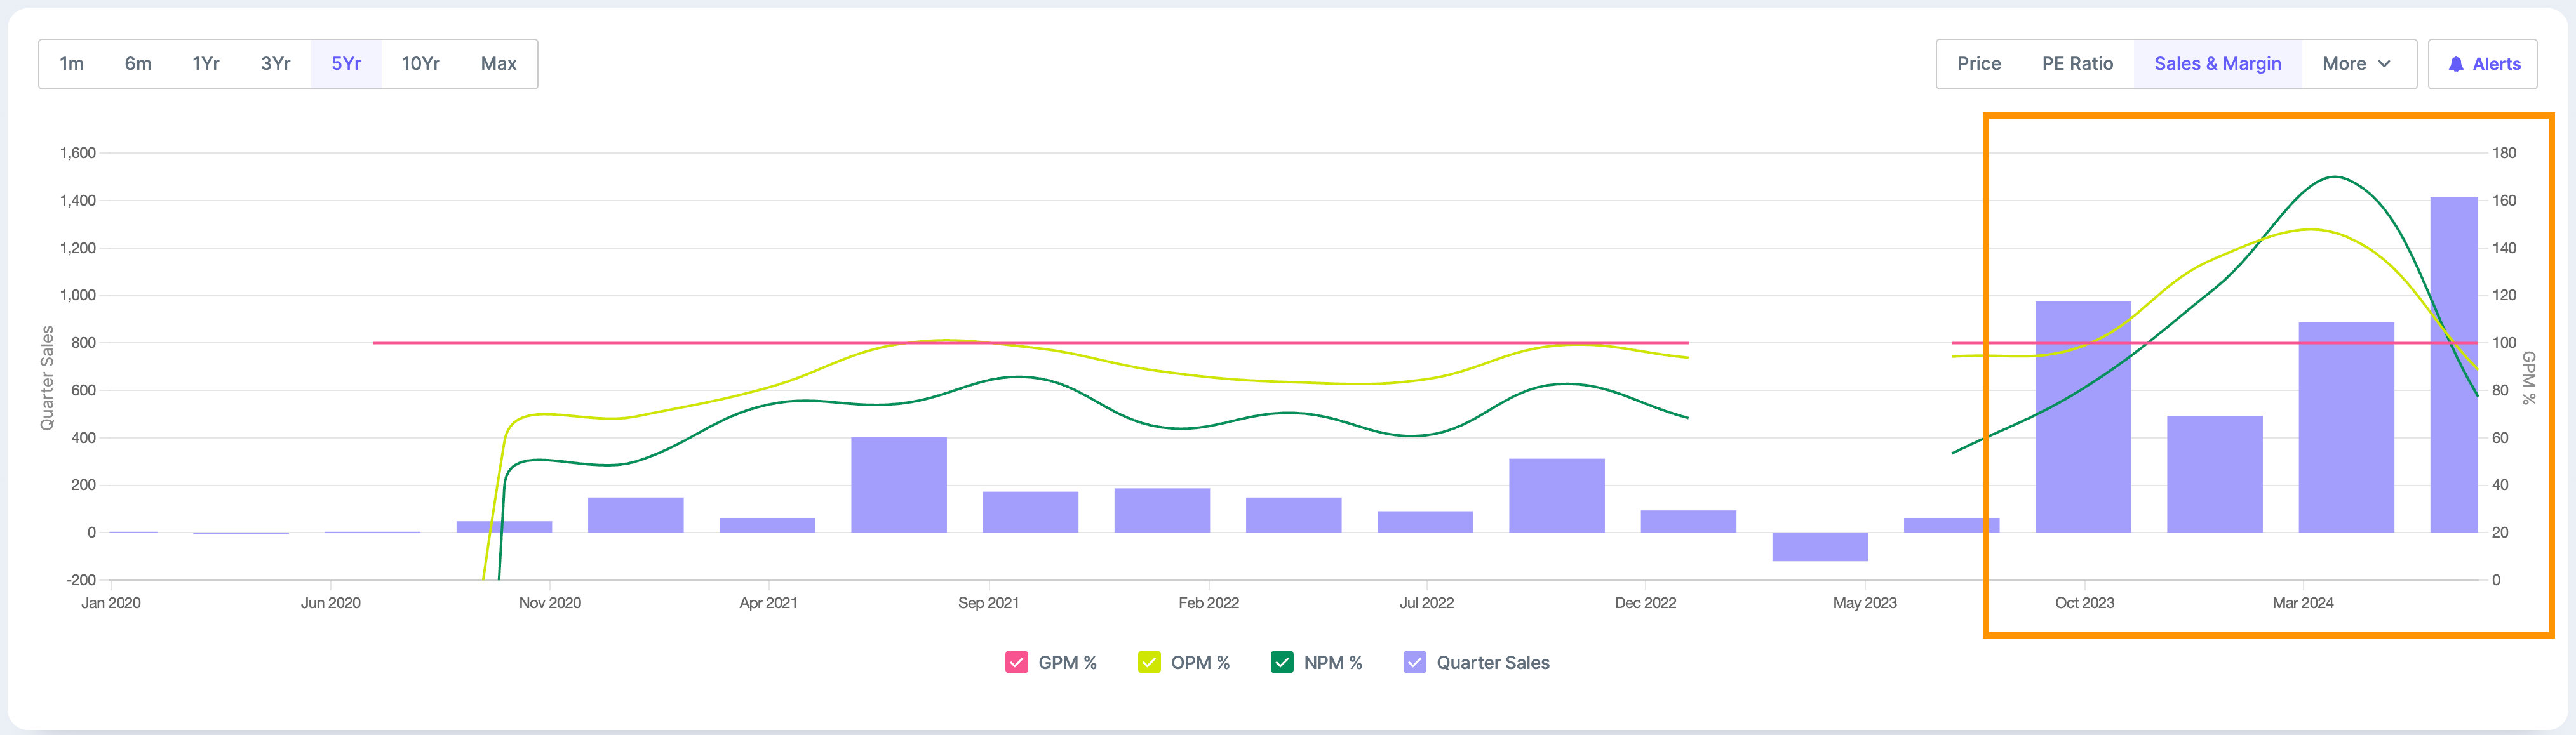
Operational metrics performance - Below chart shows massive increase in Revenue, Operating and Net Profit Margin from Oct 2023 but it is not stable margins came down in latest quarter
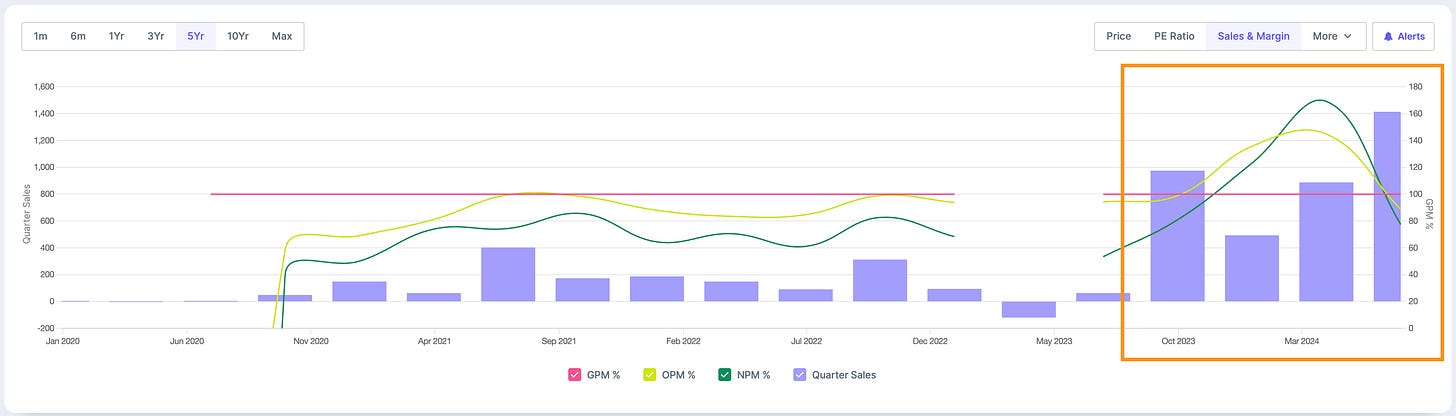
Q1 25 results (QoQ Increase) - Sales increased by 60% and Profits remained the same
Q1 25 results (YoY increase) - Sales increased by 2300% and Profits decreased by 6%
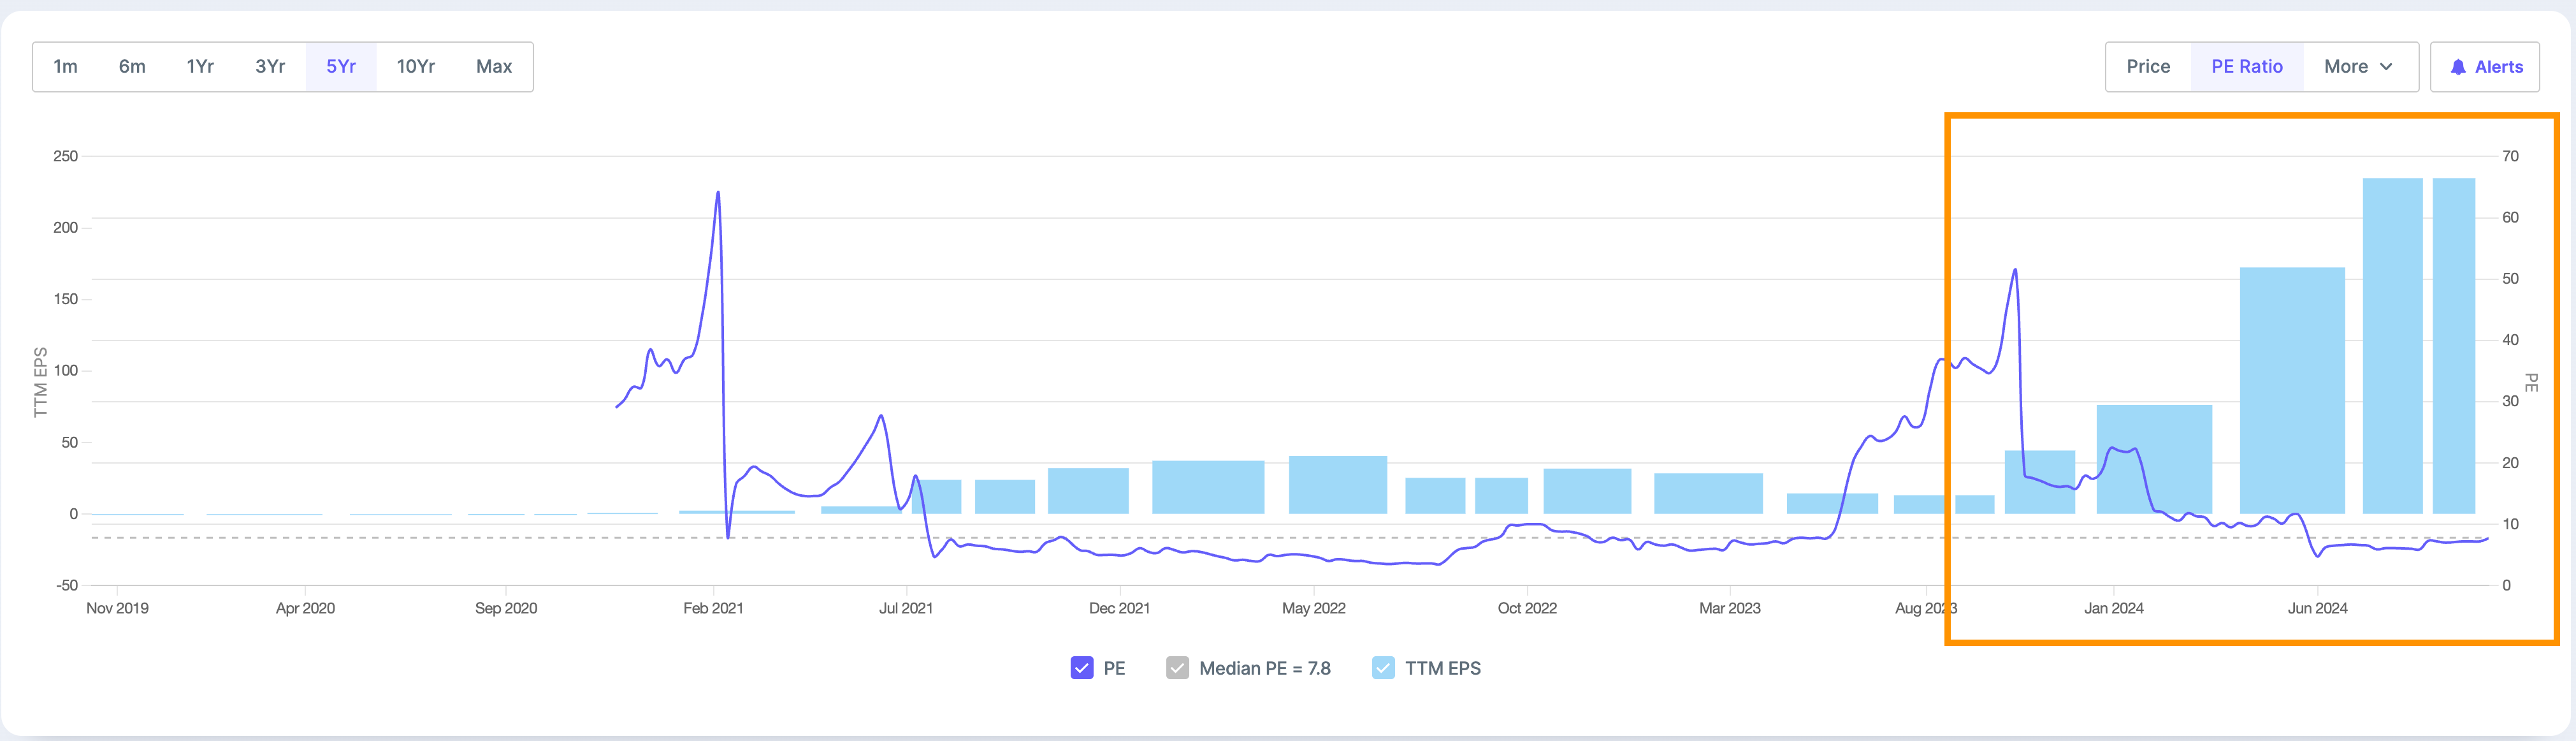
Valuations and EPS - Below chart shows TTM EPS (EPS of last 4 quarters) has grown much faster than price leading to a PE derating and current PE being 7.2. This is good thing only if this growth in EPS sustains.
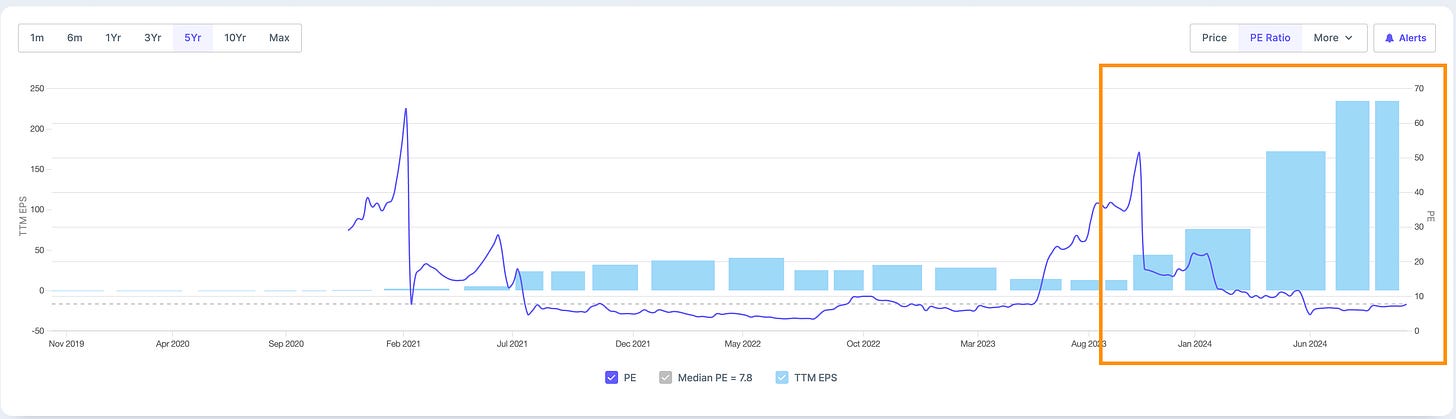
PE derated to 7.2 i.e. below historical average
TTM EPS (EPS of Last 4 quarters) - Growing massively QoQ since Dec 2023
What led to outperformance - No concalls published
Nuvama Wealth Management - Market cap 21,000 Cr+
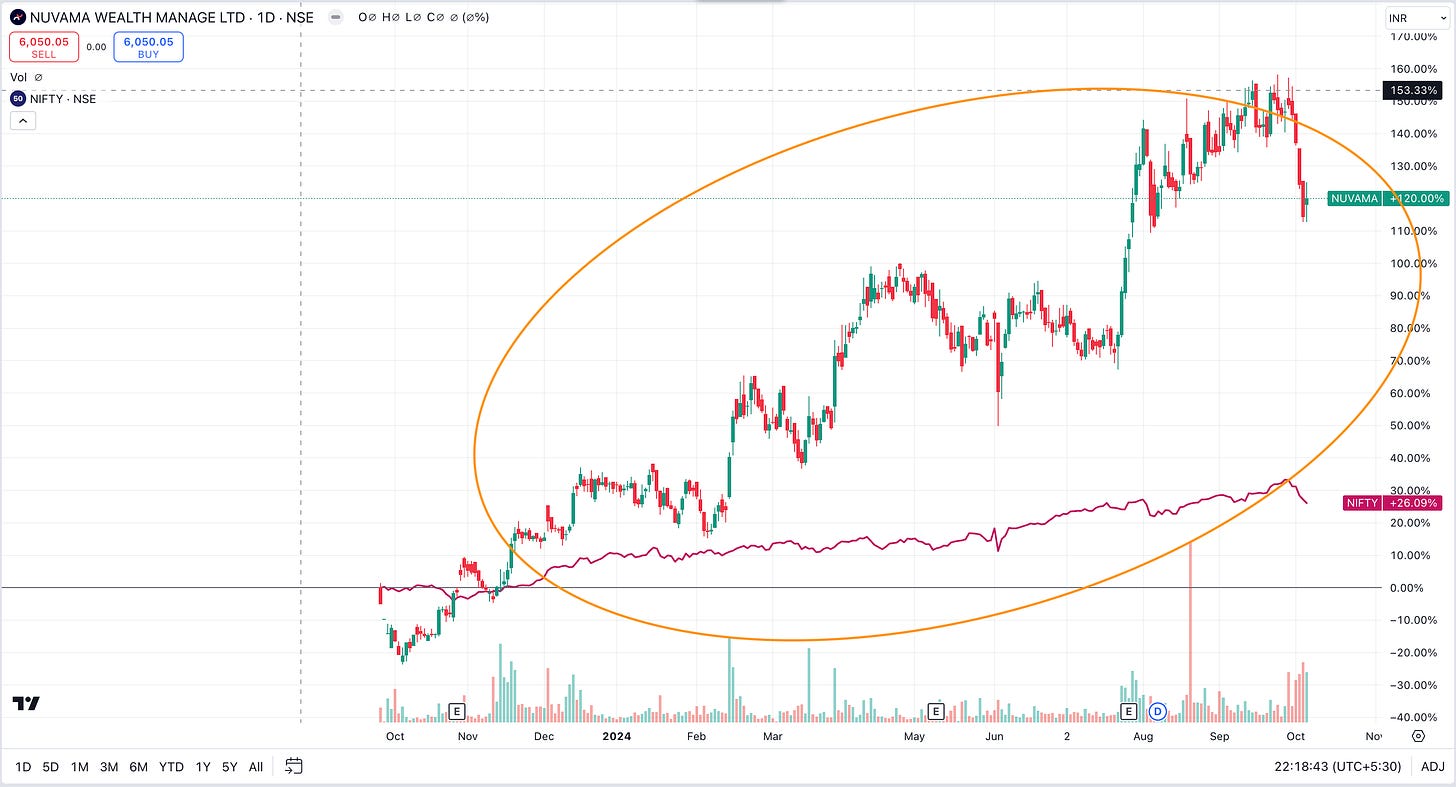
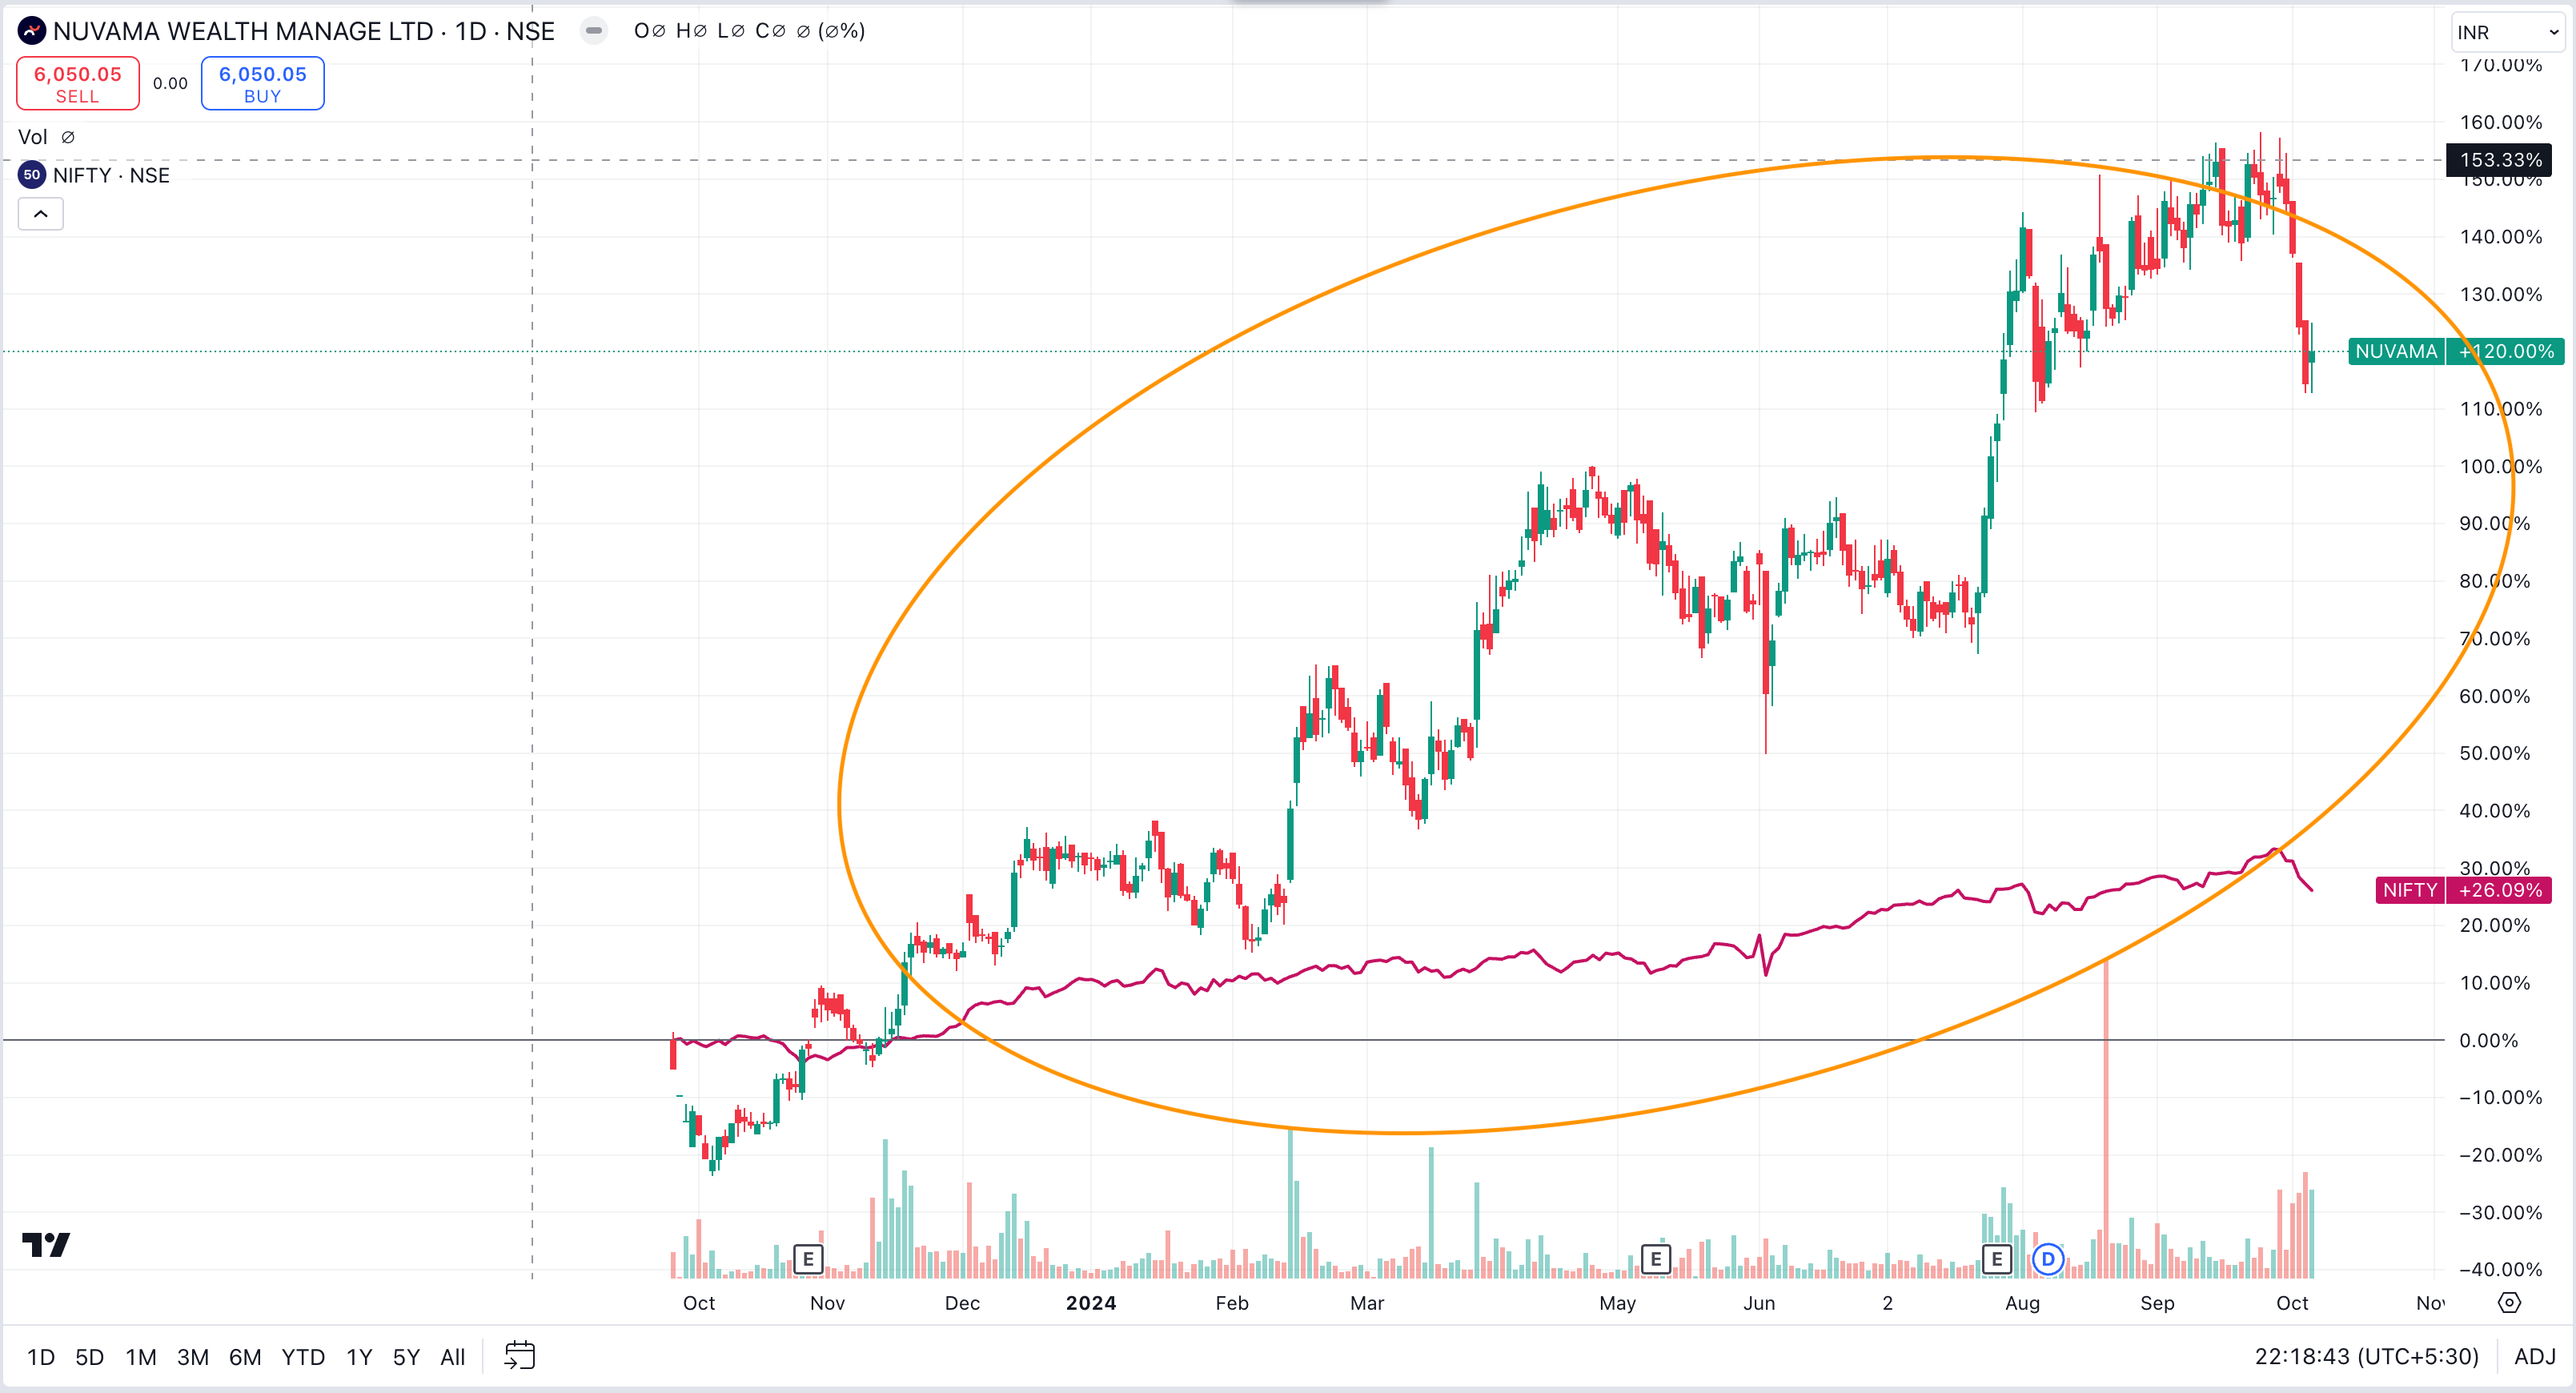
Price Action - Recently IPOed… Since Oct 23, Authum - 120%, NIFTY 26%
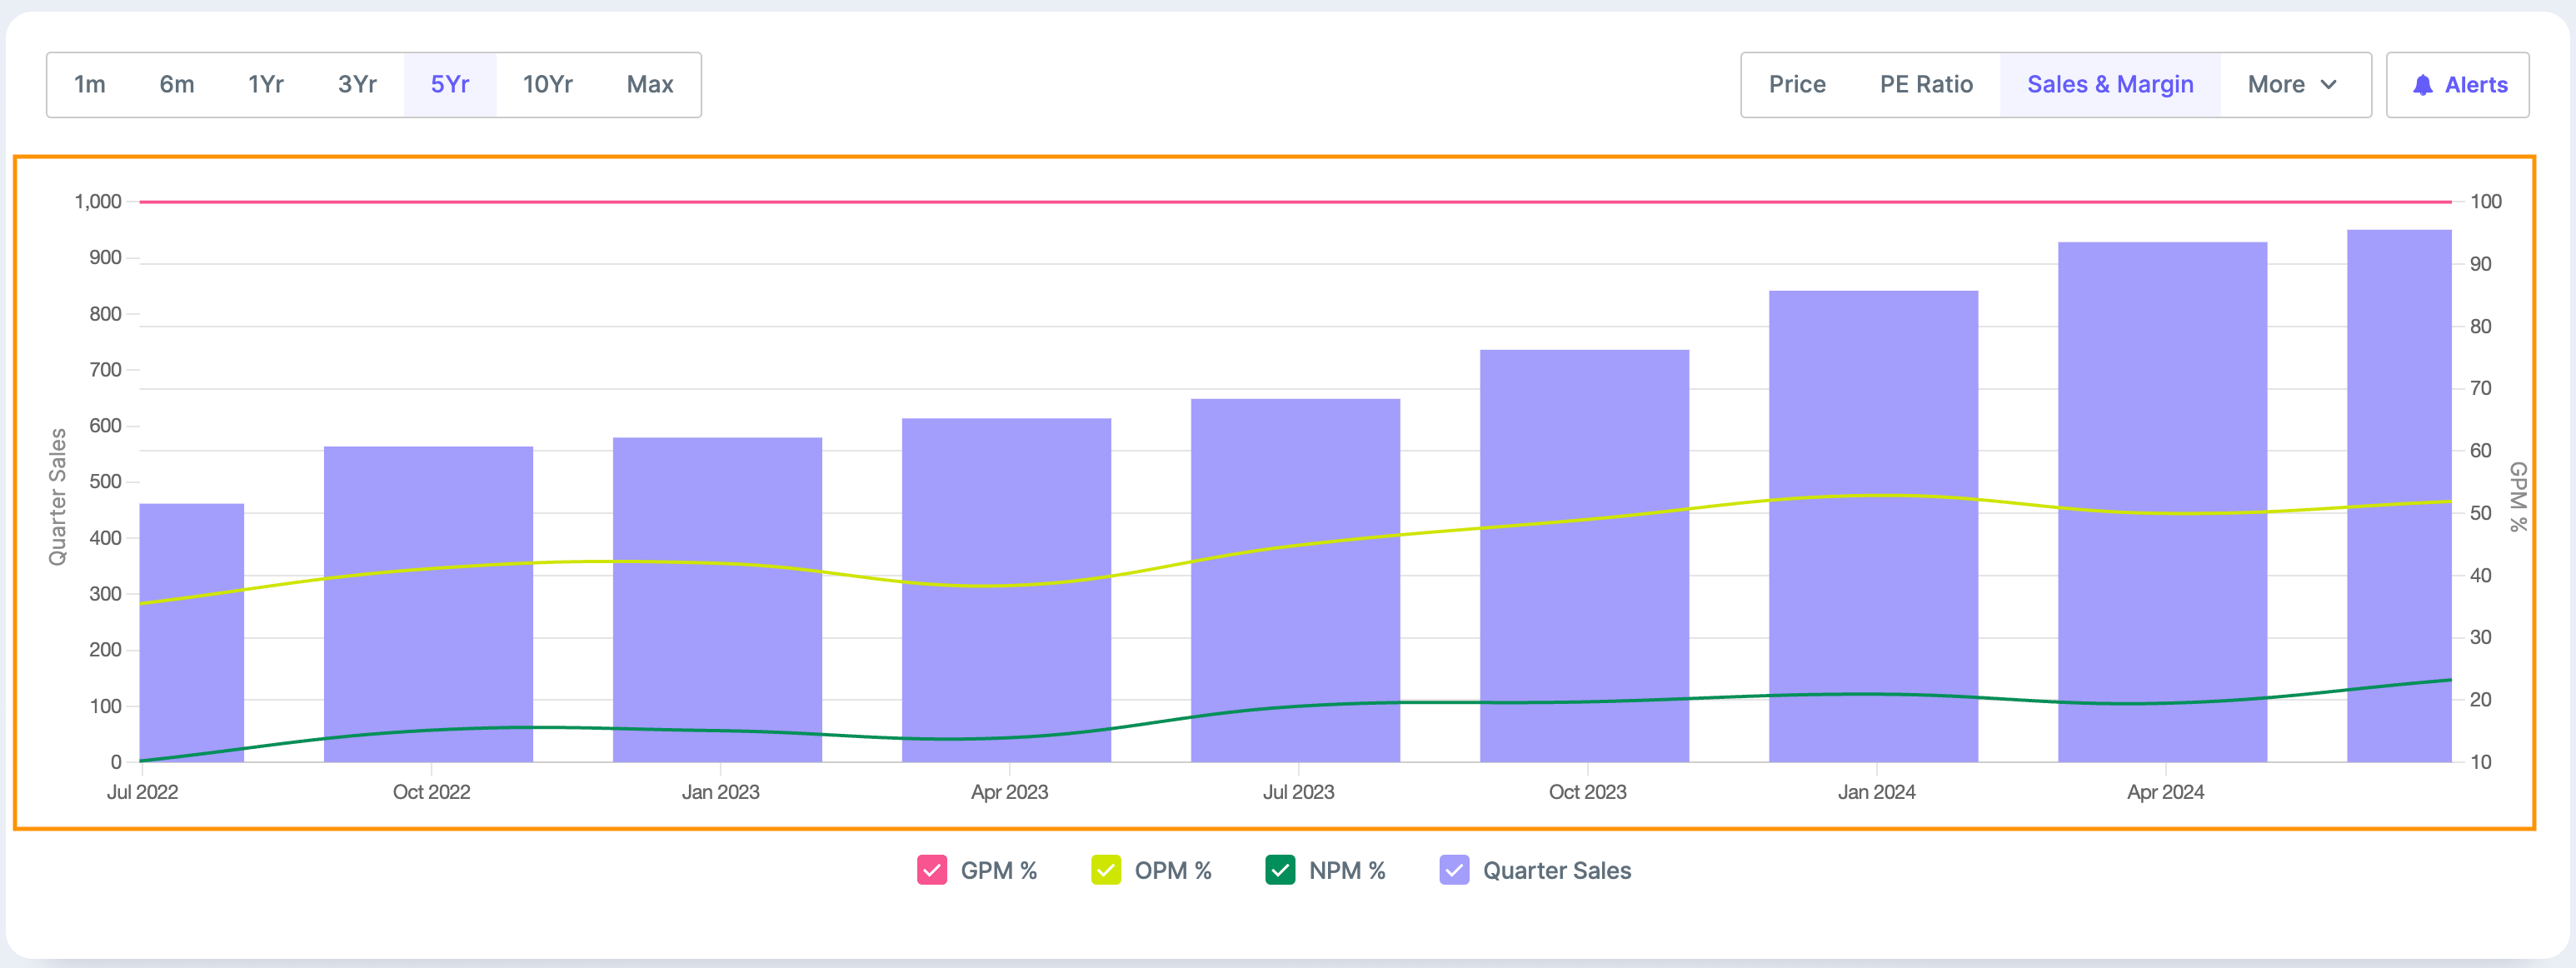
Operational metrics performance - Below chart shows Revenue, Operating and Net Profit Margin consistently increasing from July 2022
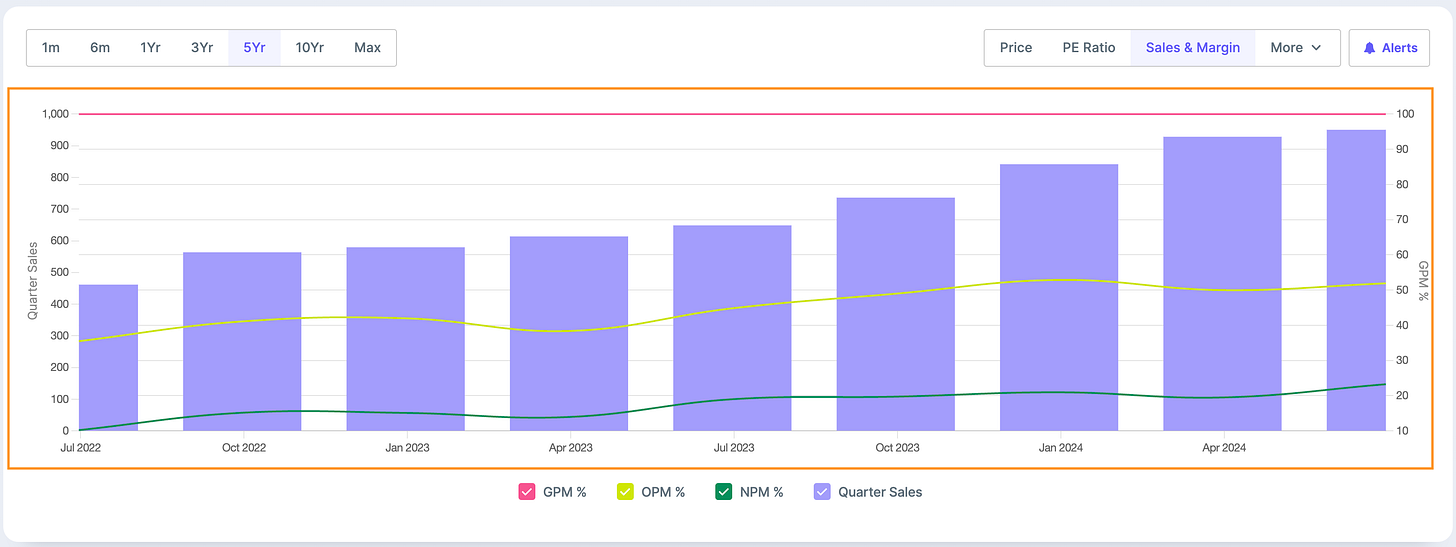
Q1 25 results (QoQ Increase) - Sales increased by 2% and Profits increased by 31%
Q1 25 results (YoY increase) - Sales increased by 47% and Profits increased by 16%
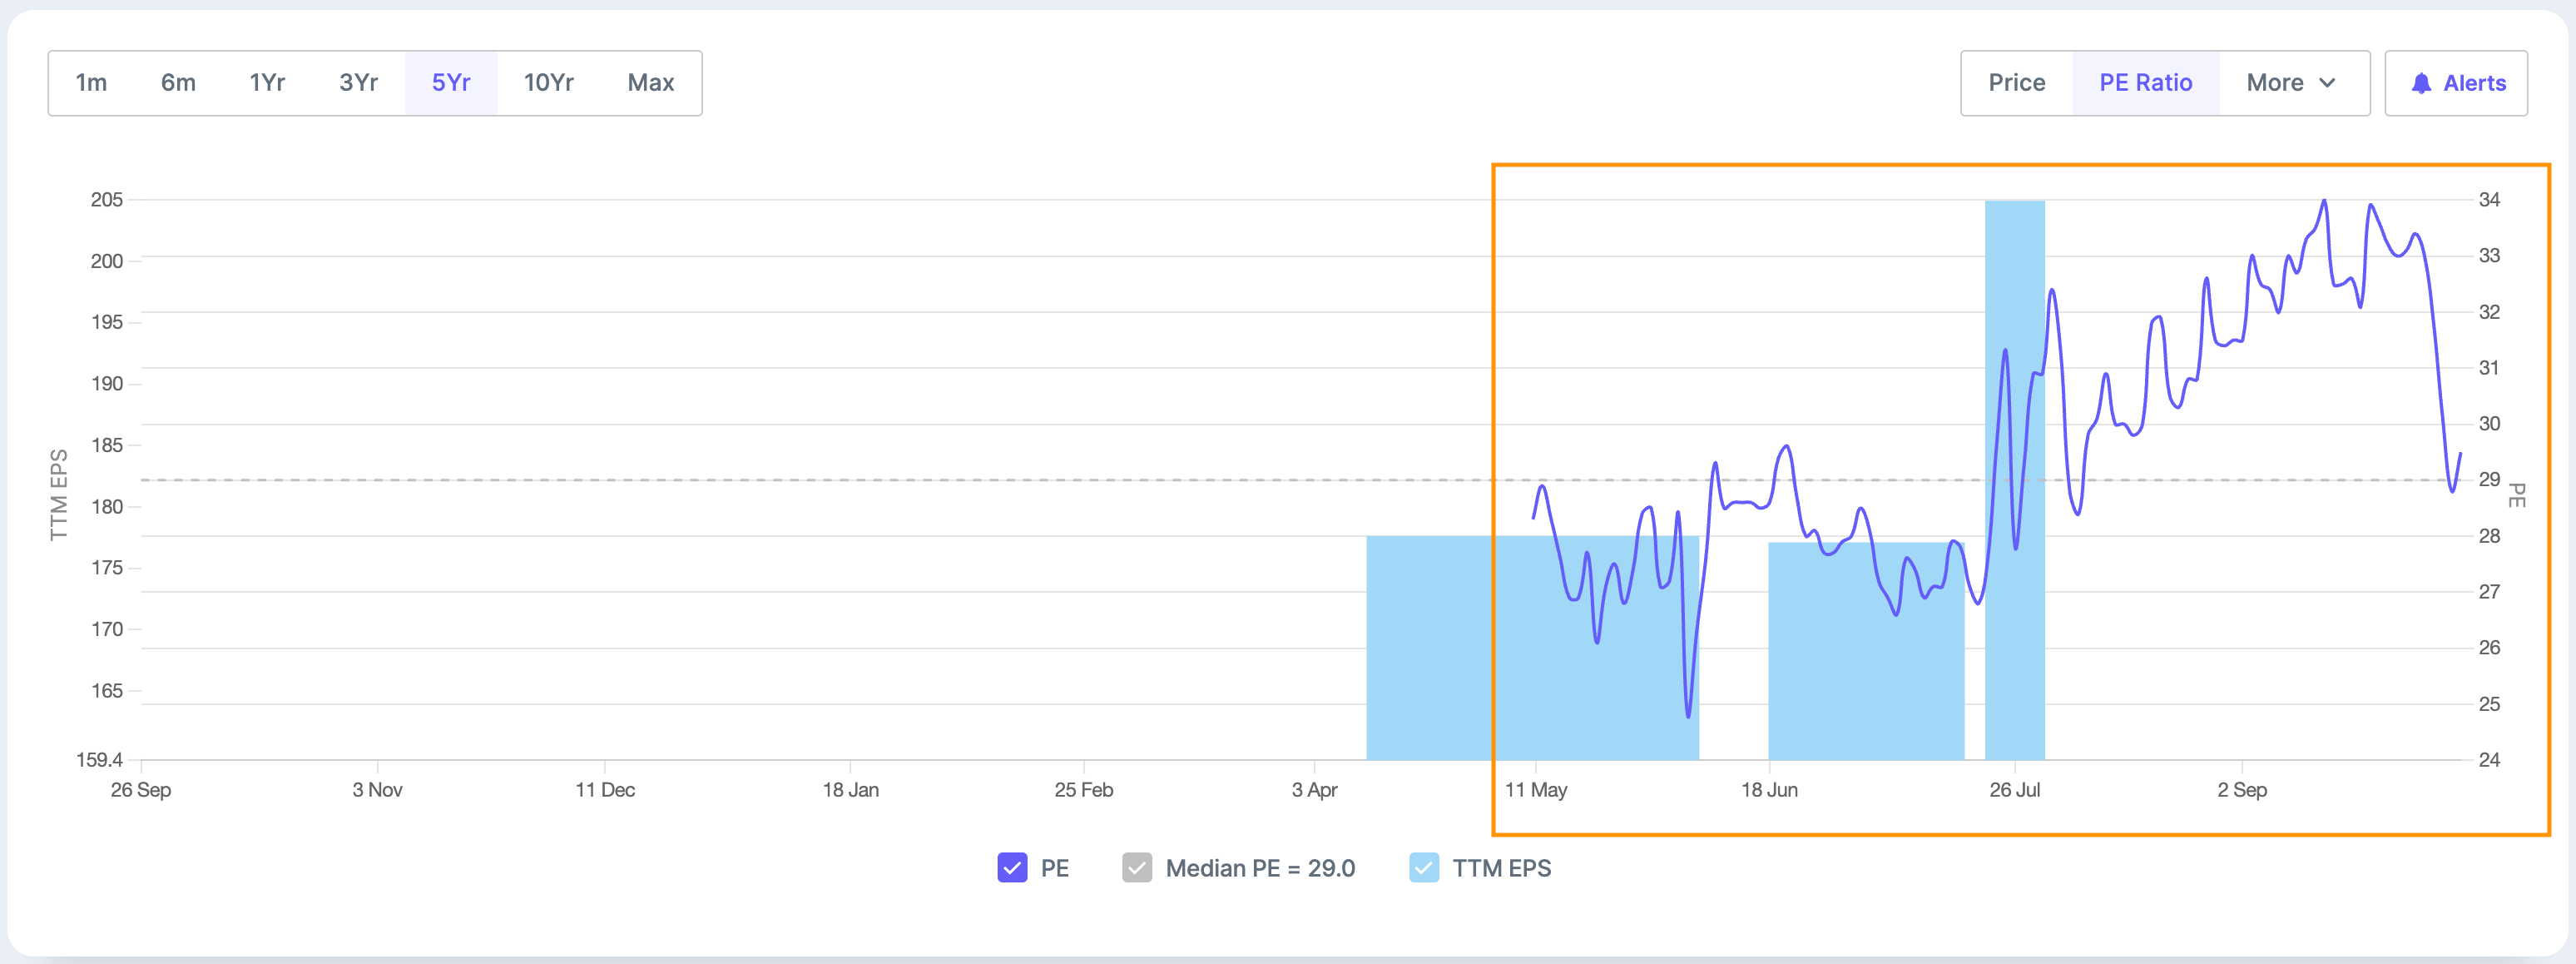
Valuations and EPS - Below chart shows TTM EPS (EPS of last 4 quarters) has grown much faster than price leading to PE being around 29 which is the long term average.
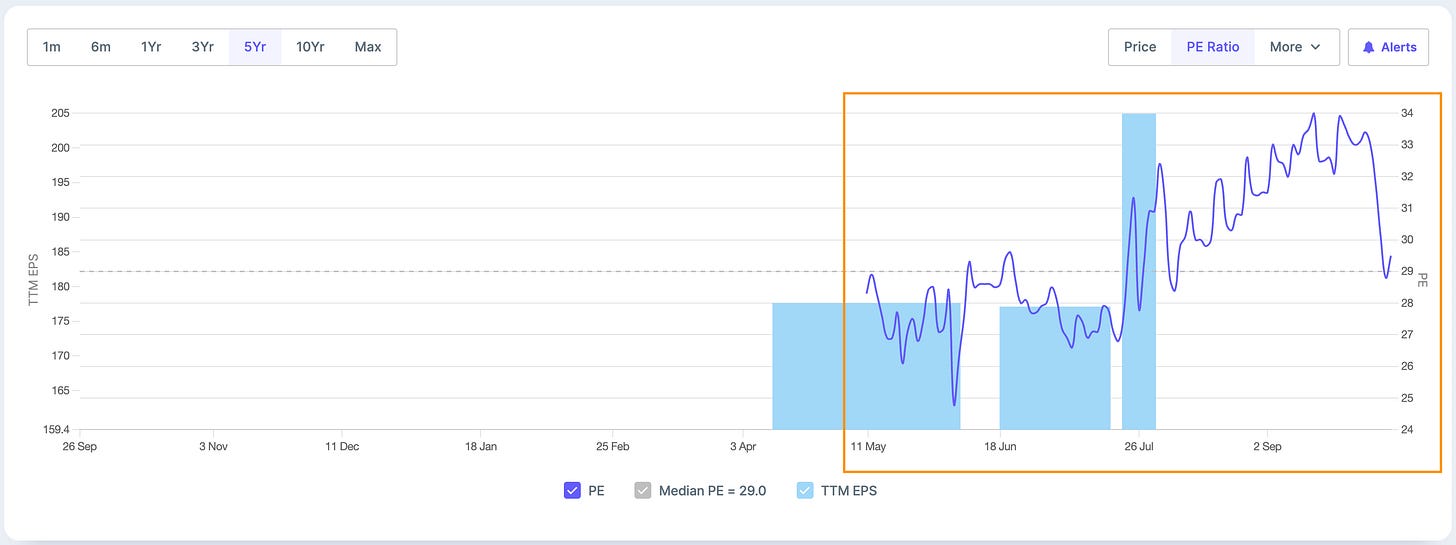
PE at 29 i.e. around historical average
TTM EPS (EPS of Last 4 quarters) - Massive growth in July quarter
What led to outperformance
AUM Growth
Total client assets grew 50% YoY to INR 3,89,000 crores
Market Share Gains
Increased market share in institutional equities and investment banking segments
Revenue Growth
Total revenue up 60% YoY to INR 668 crores
Client Acquisition
Added 200 families in Nuvama Private, taking total count to 3,900 families
Systematic Investments
Garnered INR 1,400 crores in net new money in MPIS, 11% higher than FY24 quarterly average
Product Portfolio
Expanded offerings in asset management with new products like commercial real estate and private equity funds
Distribution Channels
Added about 350 Relationship Managers over last 12 months, including 60+ in Q1
Cost Management
Cost-to-income ratio improved from 68% in Q4 to 66% in Q1, despite significant RM additions
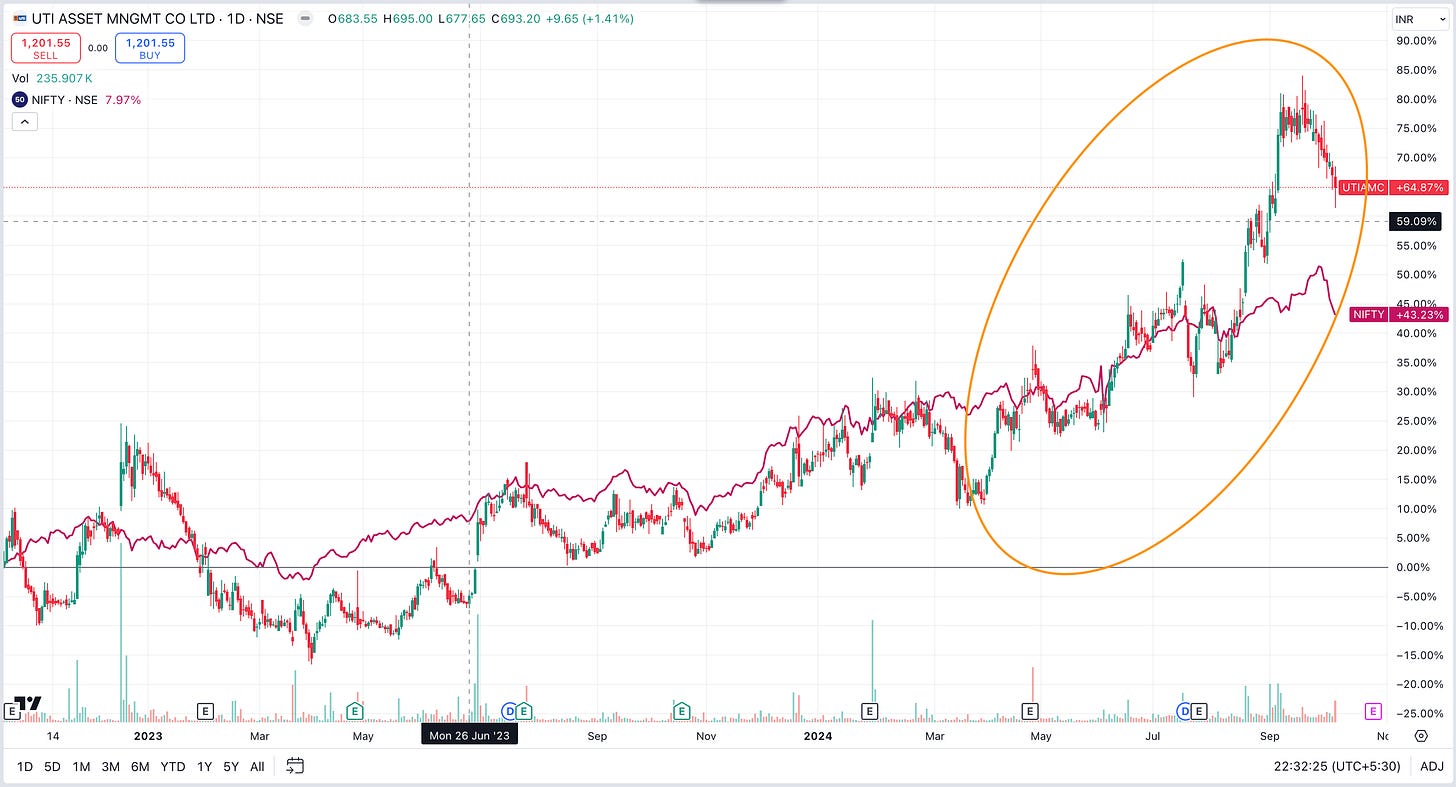
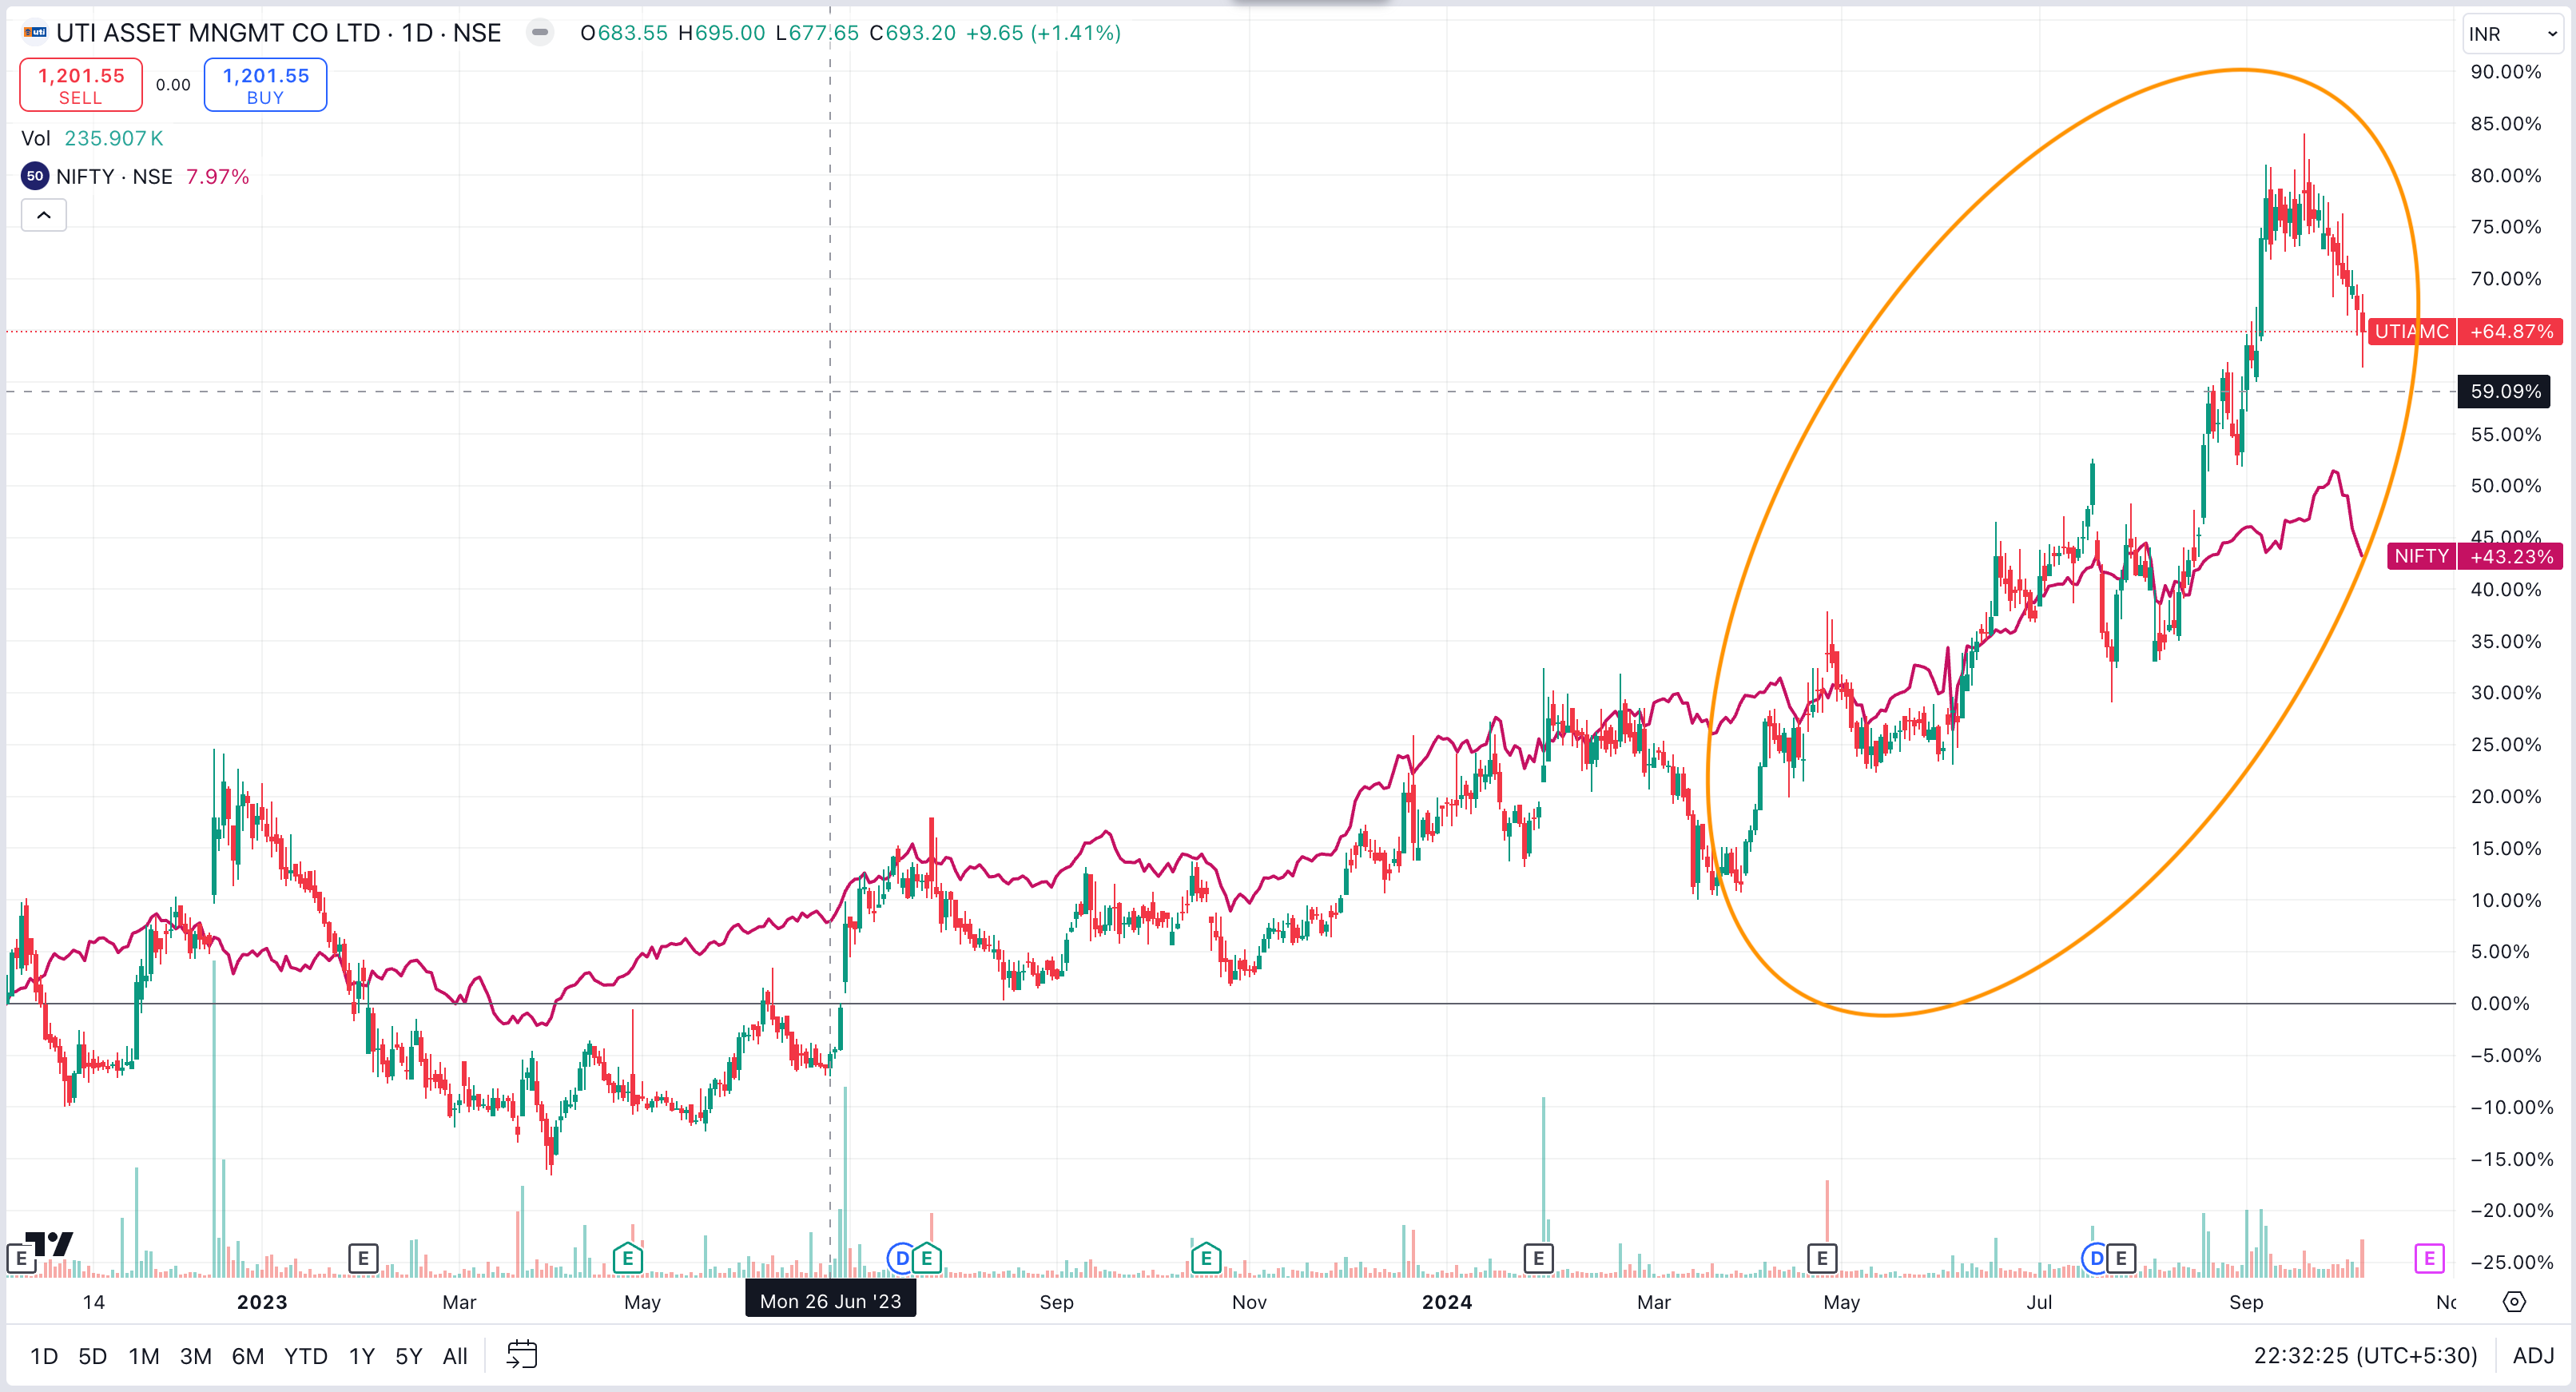
UTI AMC - Market cap 15,000 Cr+
Price Action - Since Oct 2022 UTI AMC - 65%, NIFTY 43%
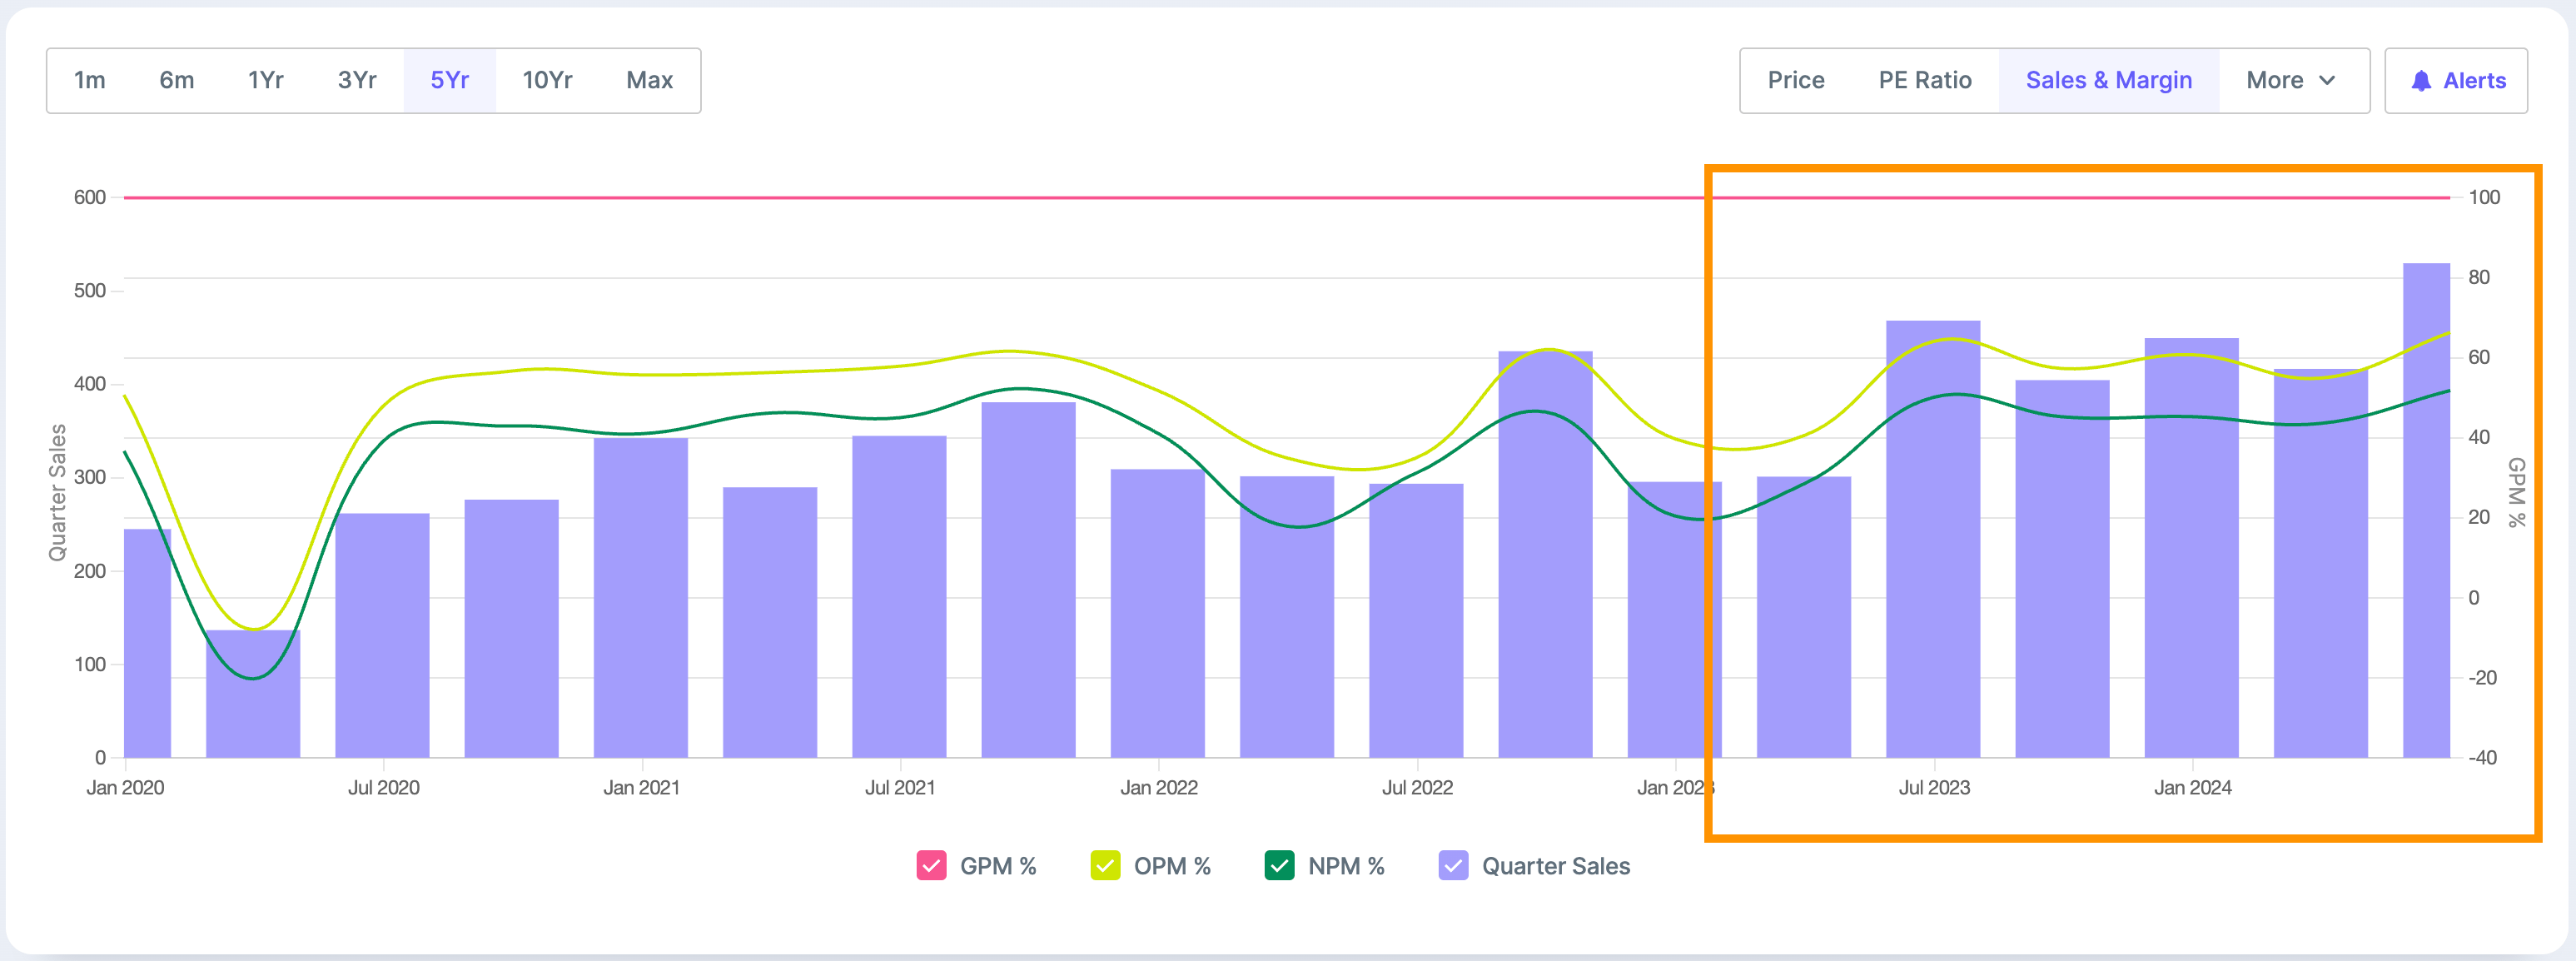
Operational metrics performance - Below chart shows Revenue, Operating and Net Profit Margin consistently increasing from Jan 2023
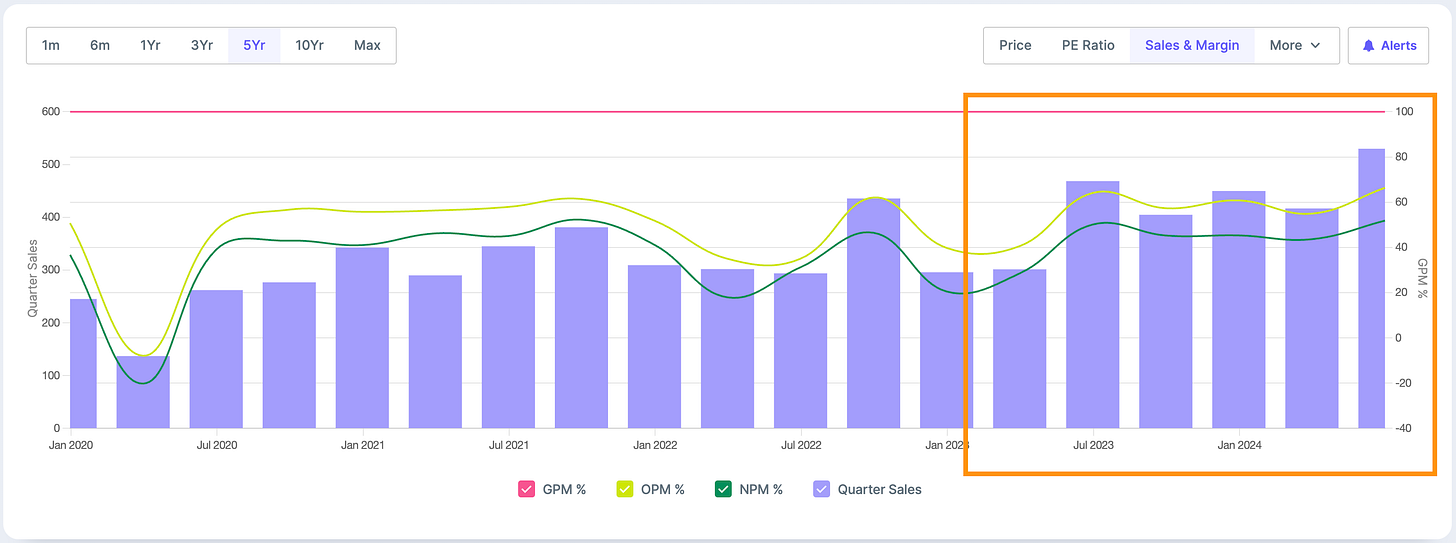
Q1 25 results (QoQ Increase) - Sales increased by 27% and Profits increased by 37%
Q1 25 results (YoY increase) - Sales increased by 13% and Profits increased by 4%
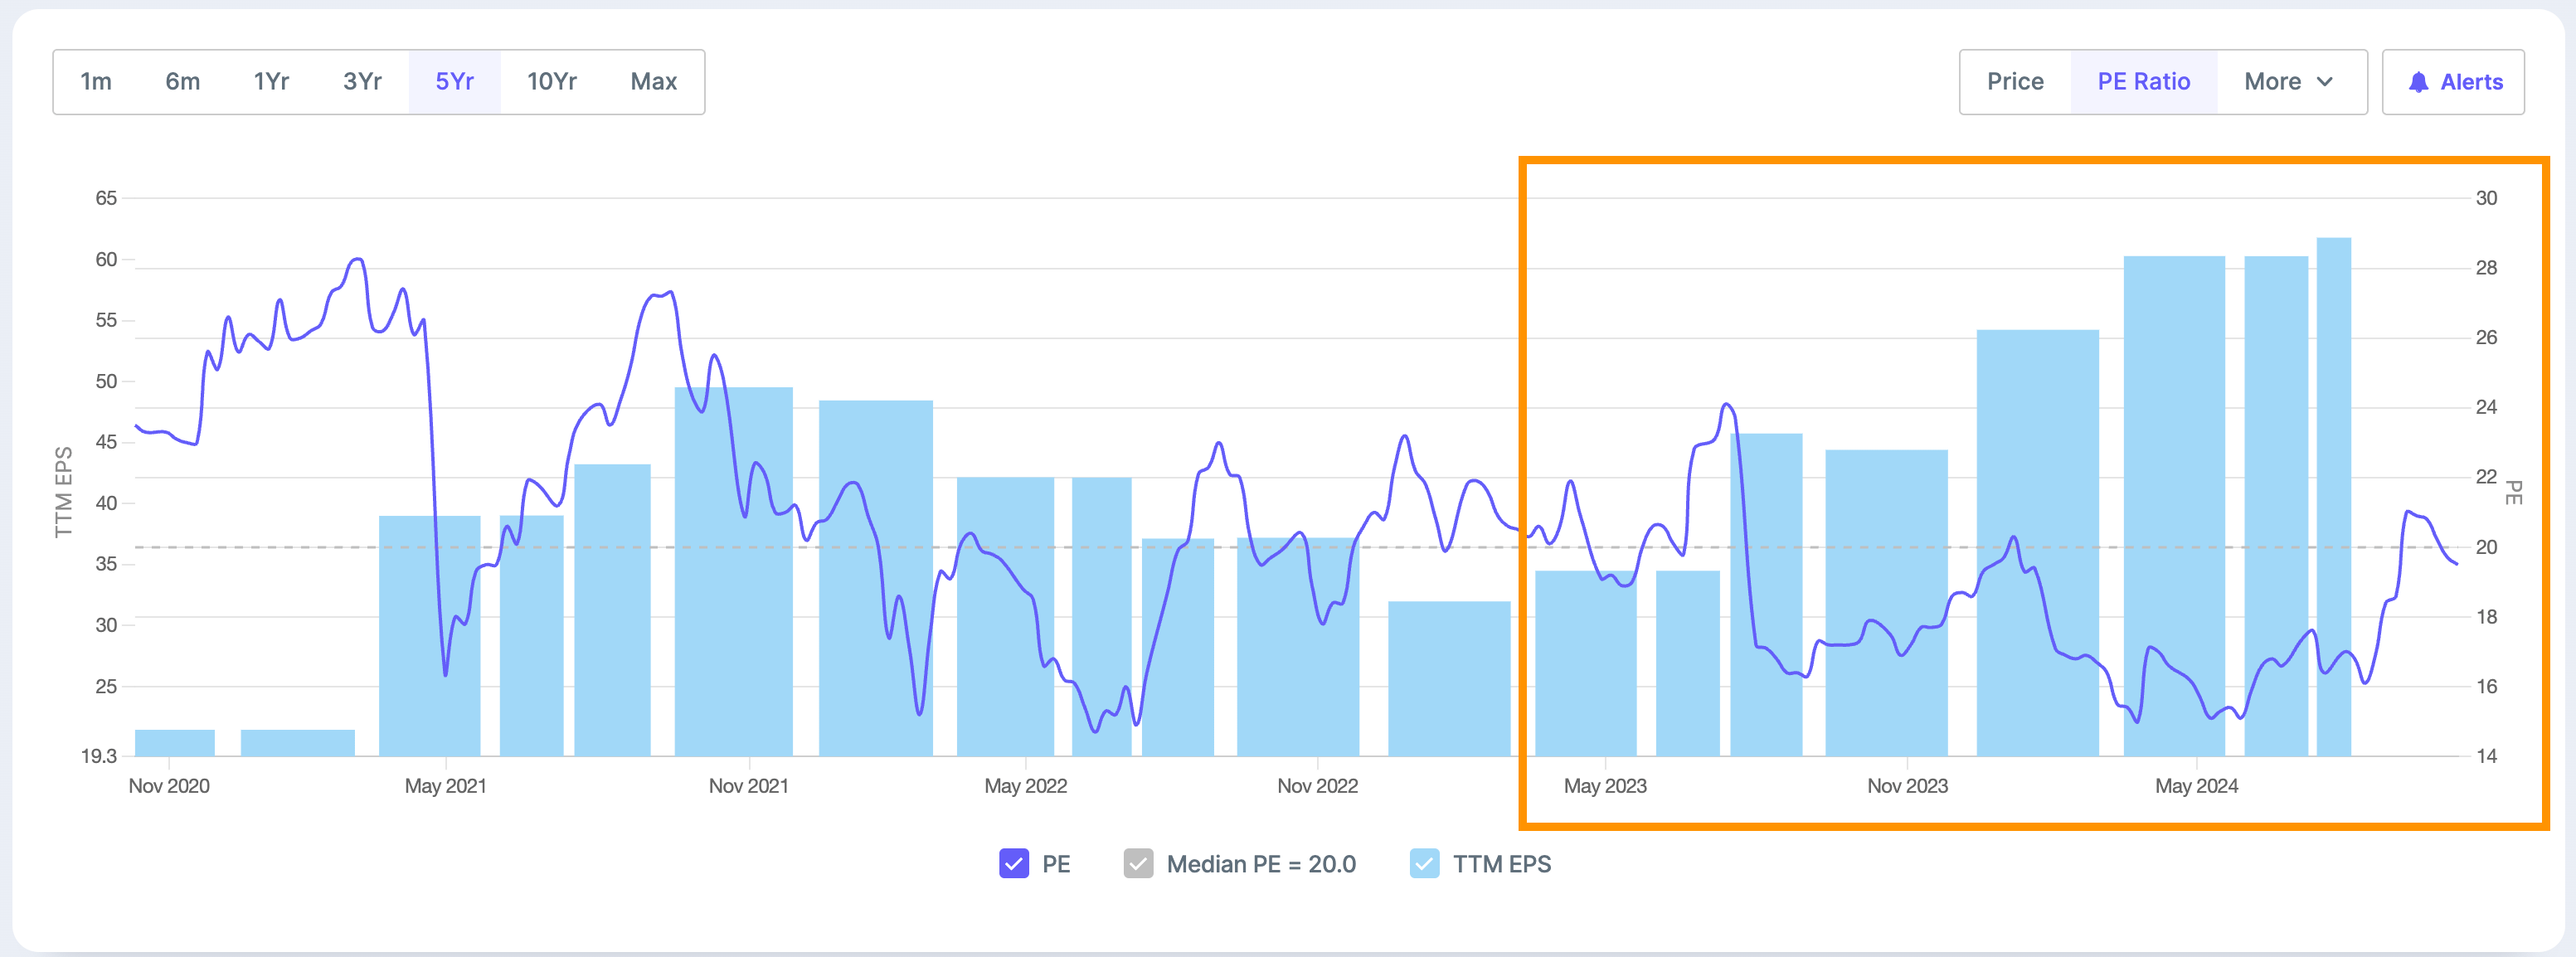
Valuations and EPS - Below chart shows TTM EPS (EPS of last 4 quarters) has grown much faster than price from May 23 to May 24 leading to PE bottoming around 16. Post May 24 Price has started move at a faster pace leading to PE increasing to long term average of 20
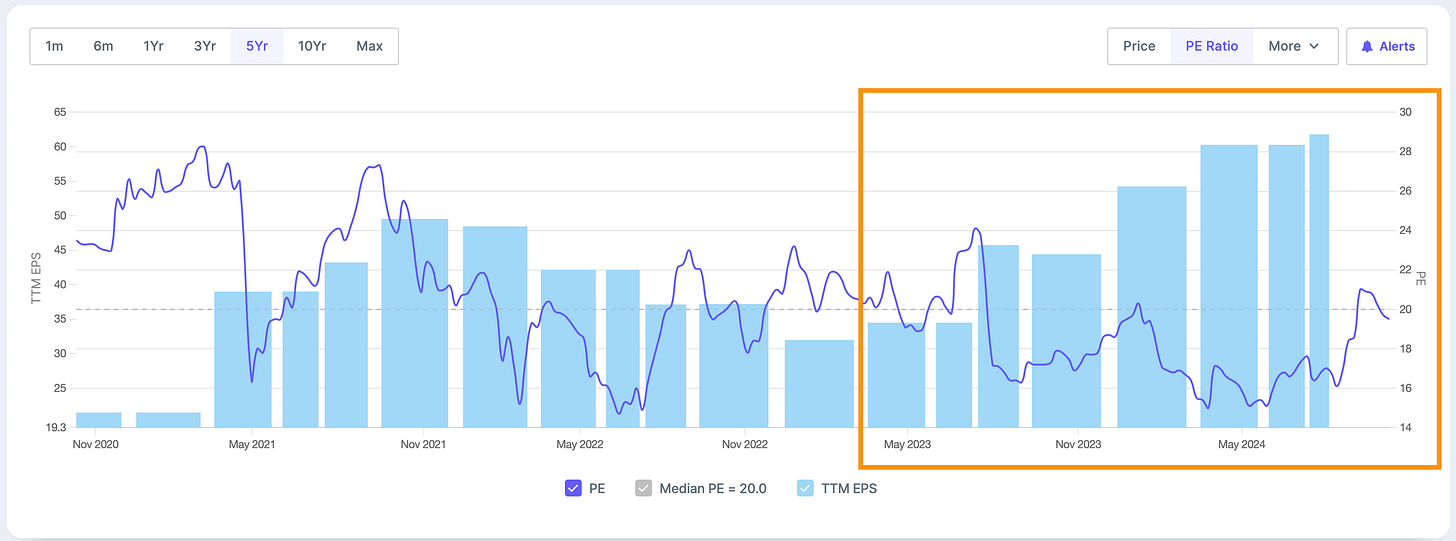
PE at 20 i.e. around historical average
TTM EPS (EPS of Last 4 quarters) - Consistent growth since May 2023
What led to outperformance
AUM Growth
Total AUM grew 20% YoY to ₹19,36,107 crore, including strong growth in MF QAAUM and other business segments
Market Share Gains
Overall MF QAAUM market share increased to 5.27% in Q1 FY25 from 5.76% in Q1 FY24, with notable improvement in passive funds
Revenue Growth
Total revenue from operations up 13% YoY to ₹529 crore, with core revenue (sale of services) growing faster at 19% YoY
Client Acquisition
Total live folios stood at 1.25 crore as of 30th June 2024, supported by ~69,390 empaneled distribution partners
Systematic Investments
SIP AUM increased 44.84% YoY to ₹36,095 crore, with monthly SIP book rising 11% QoQ to ₹25.8 billion for June 2024
Product Portfolio
Expanded offerings with new products in asset management, including commercial real estate and private equity funds
Distribution Channels
Digital purchase transactions rose 33.19% YoY to 37.84 lakh, complemented by presence across 698 districts in India
Cost Management
Operating profit margin improved from 14 bps to 16 bps of AAUM YoY, with core PAT growing 39% YoY, outpacing revenue growth
DOLAT ALGOTECH LTD - Market cap 2,314 Cr+
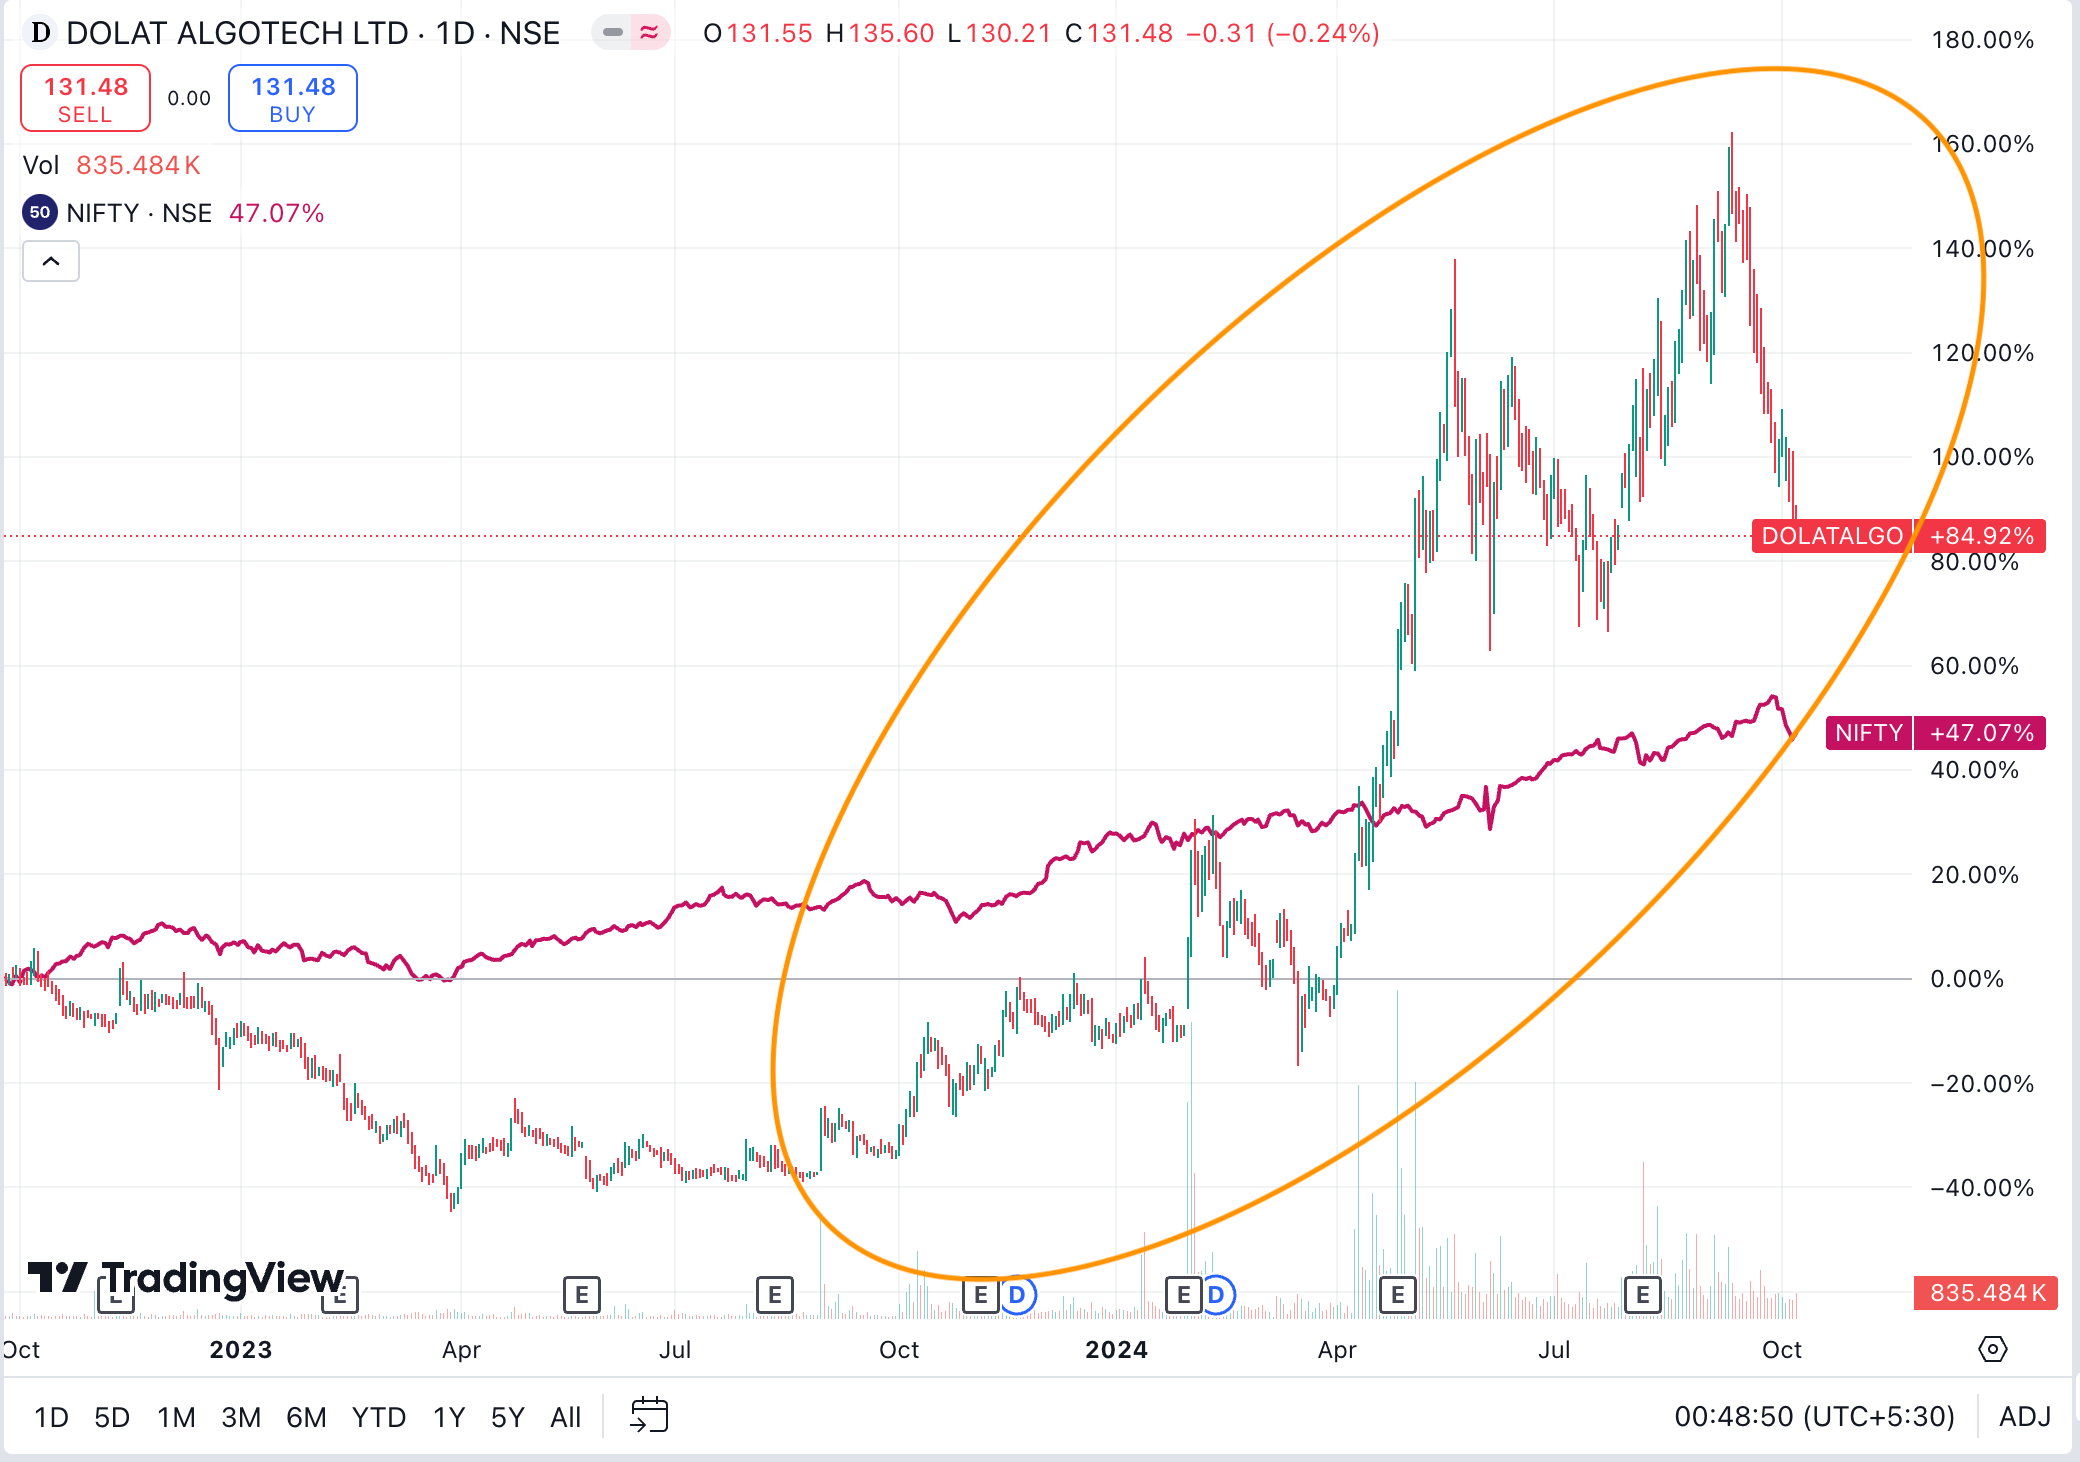
Price Action - Since Oct 2022 Dolat Algotech - 85%, NIFTY 47%
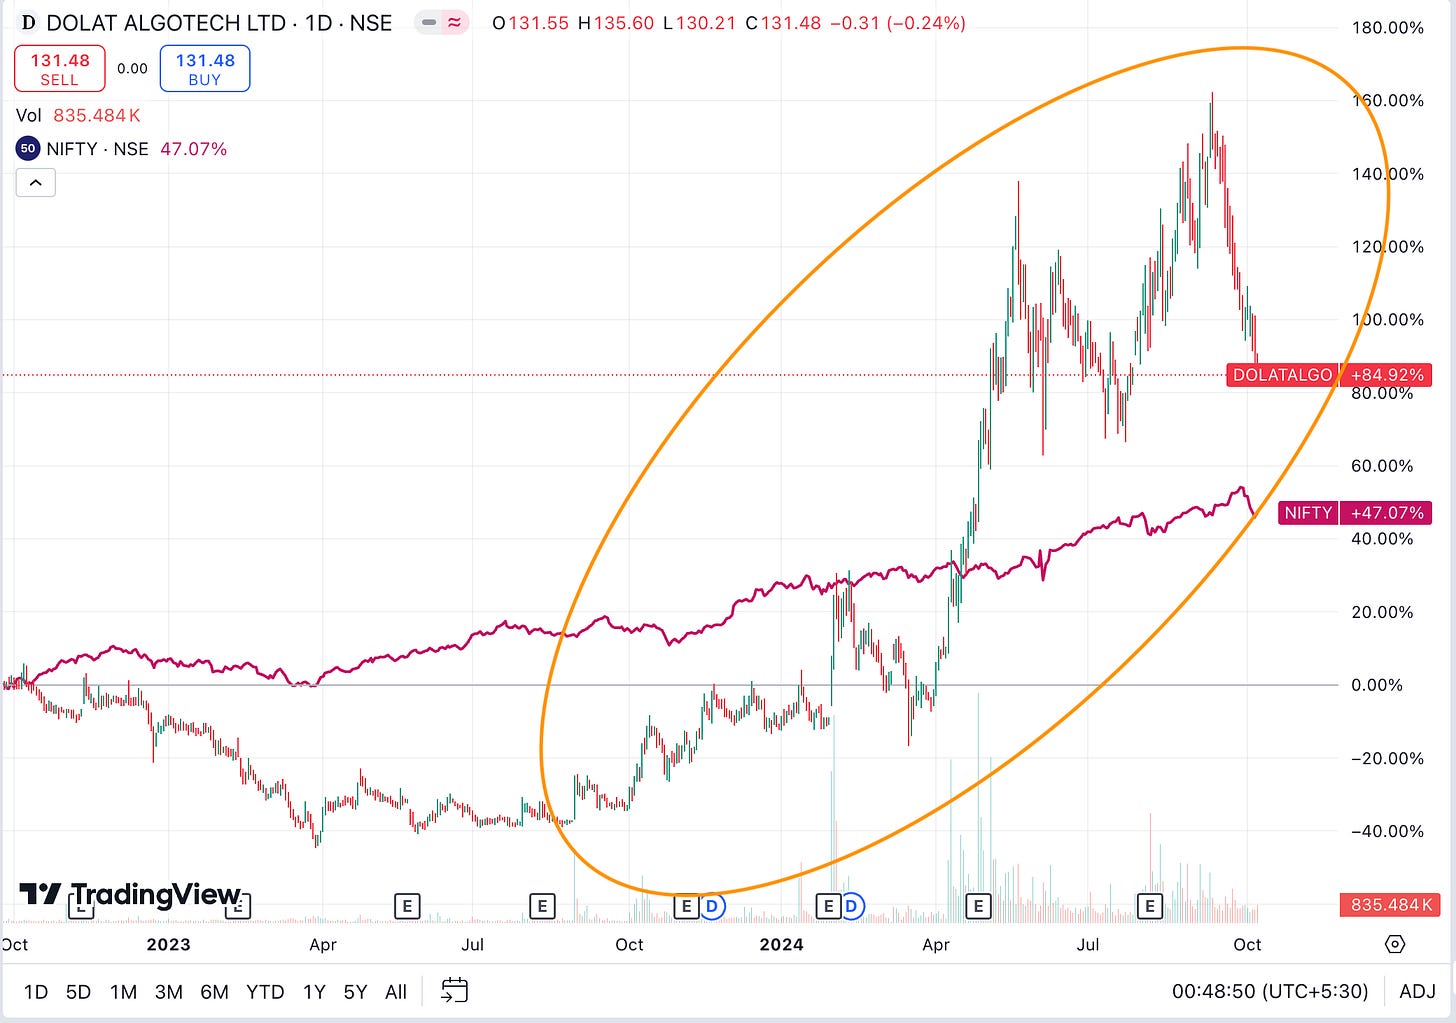
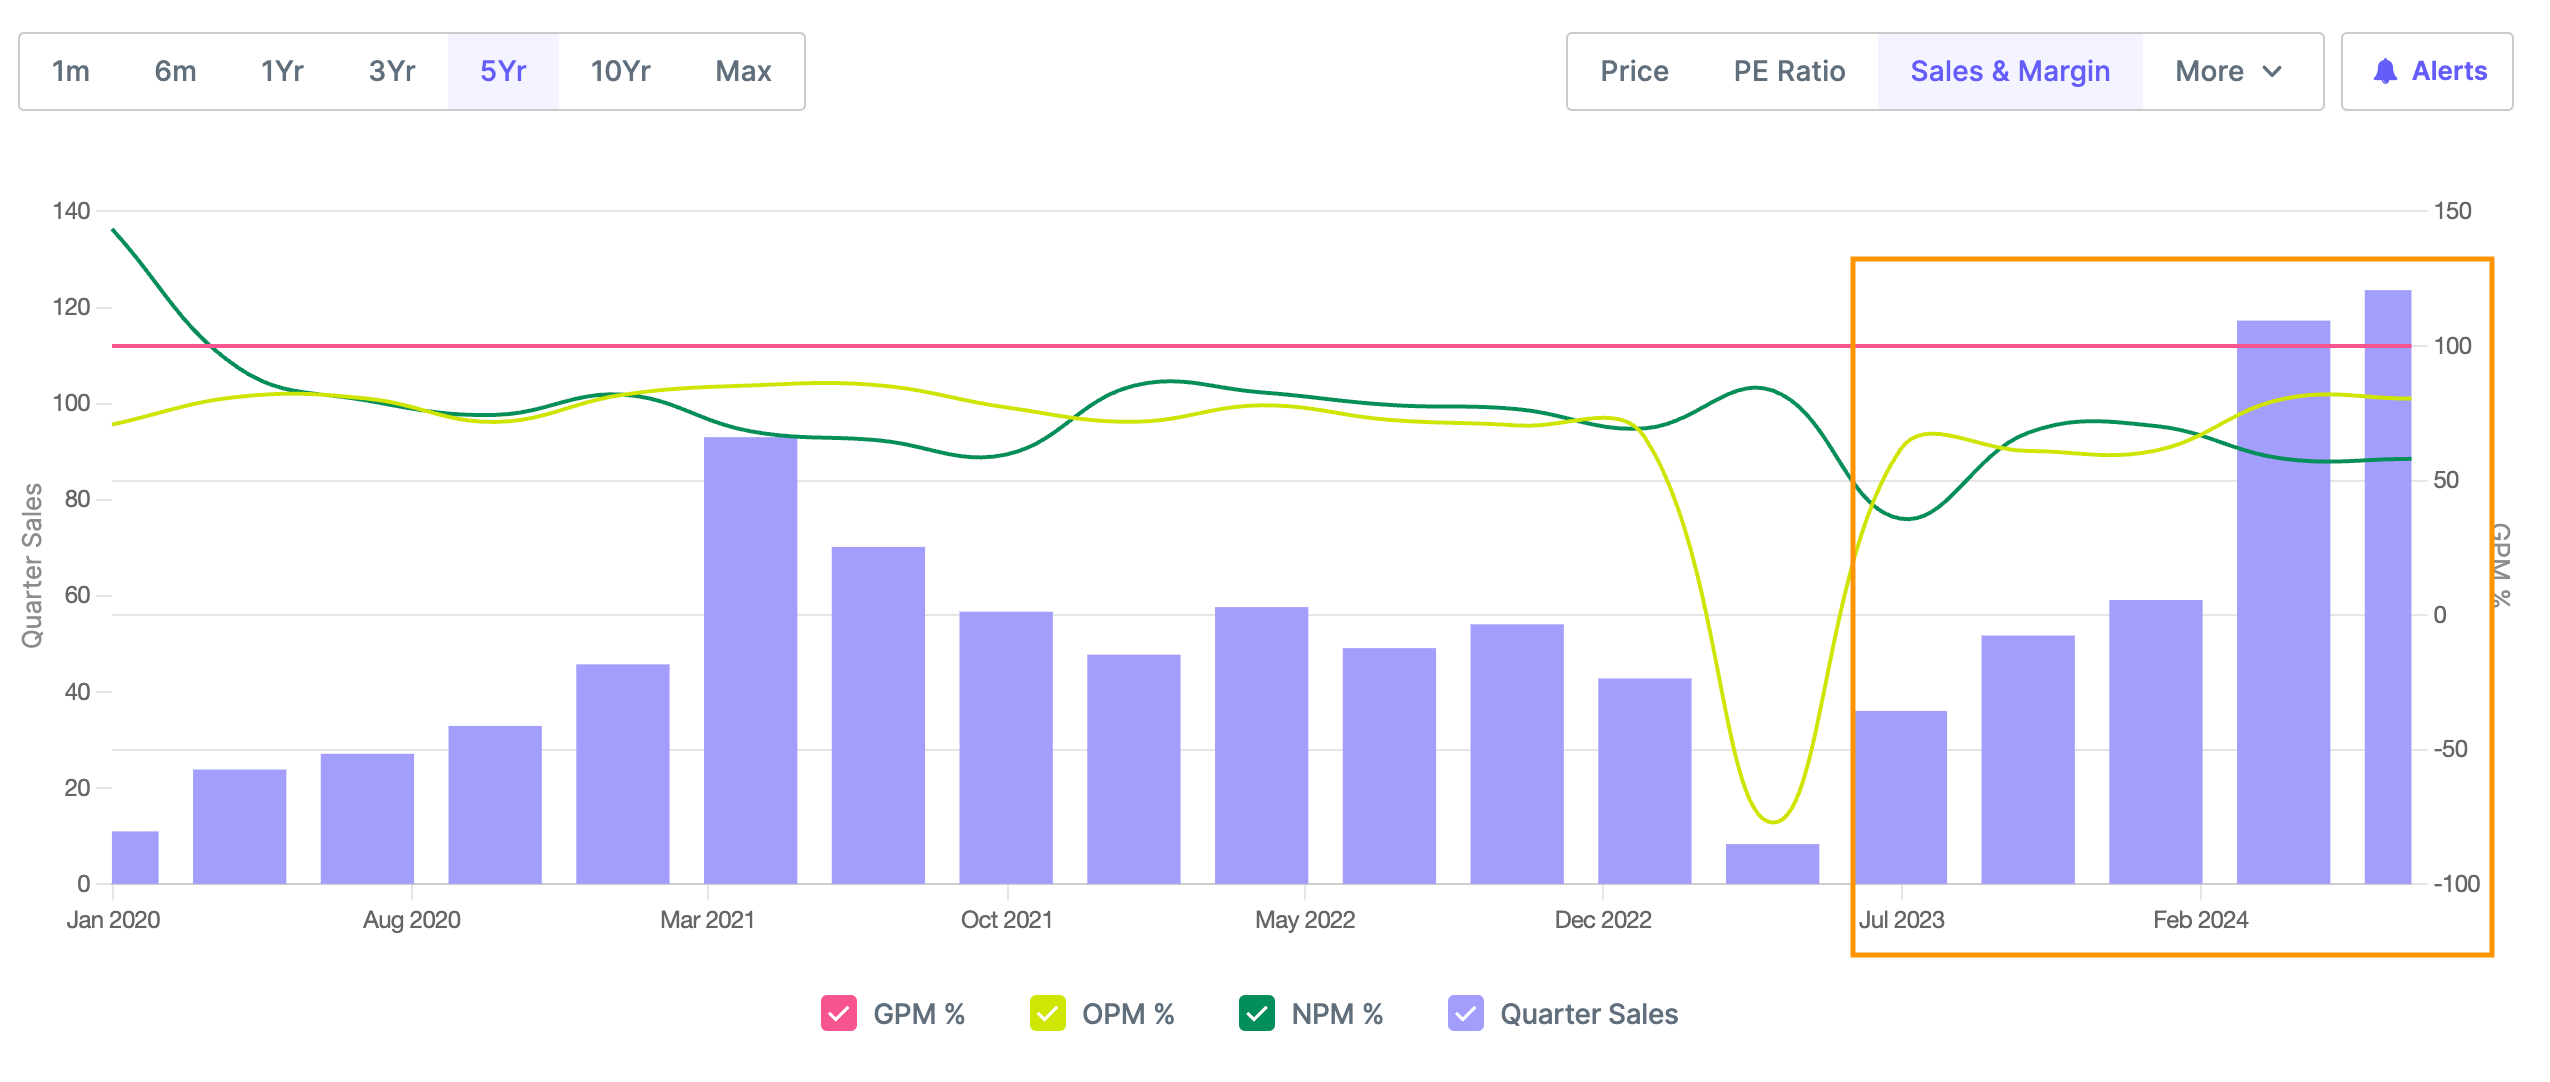
Operational metrics performance - Below chart shows Revenue, Operating and Net Profit Margin consistently increasing from July 2023
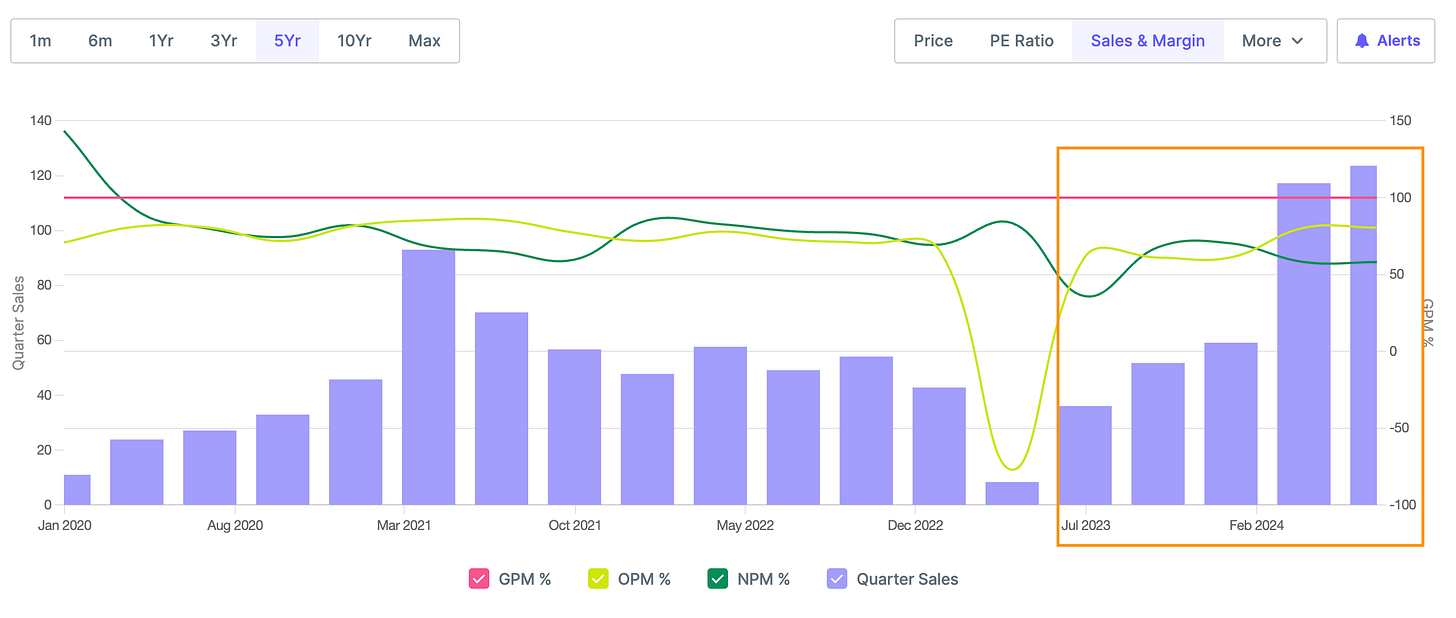
Q1 25 results (QoQ Increase) - Sales increased by 5% and Profits increased by 13%
Q1 25 results (YoY increase) - Sales increased by 344% and Profits increased by 31%
Valuations and EPS - Below chart shows TTM EPS (EPS of last 4 quarters) has increased massively since Nov 2023 and price has also grown at the same pace leading to PE stablising at 10.
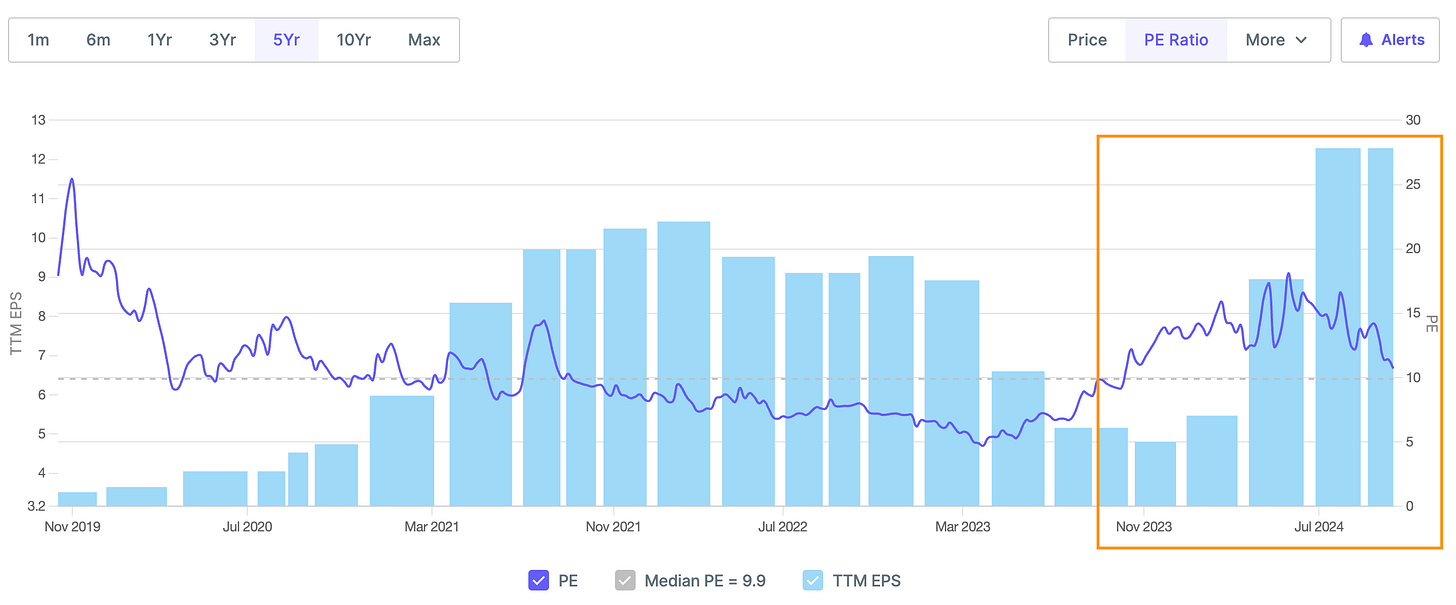
PE at 10 i.e. around historical average
TTM EPS (EPS of Last 4 quarters) - Consistent growth since Nov 2023
What led to outperformance
No con-call available
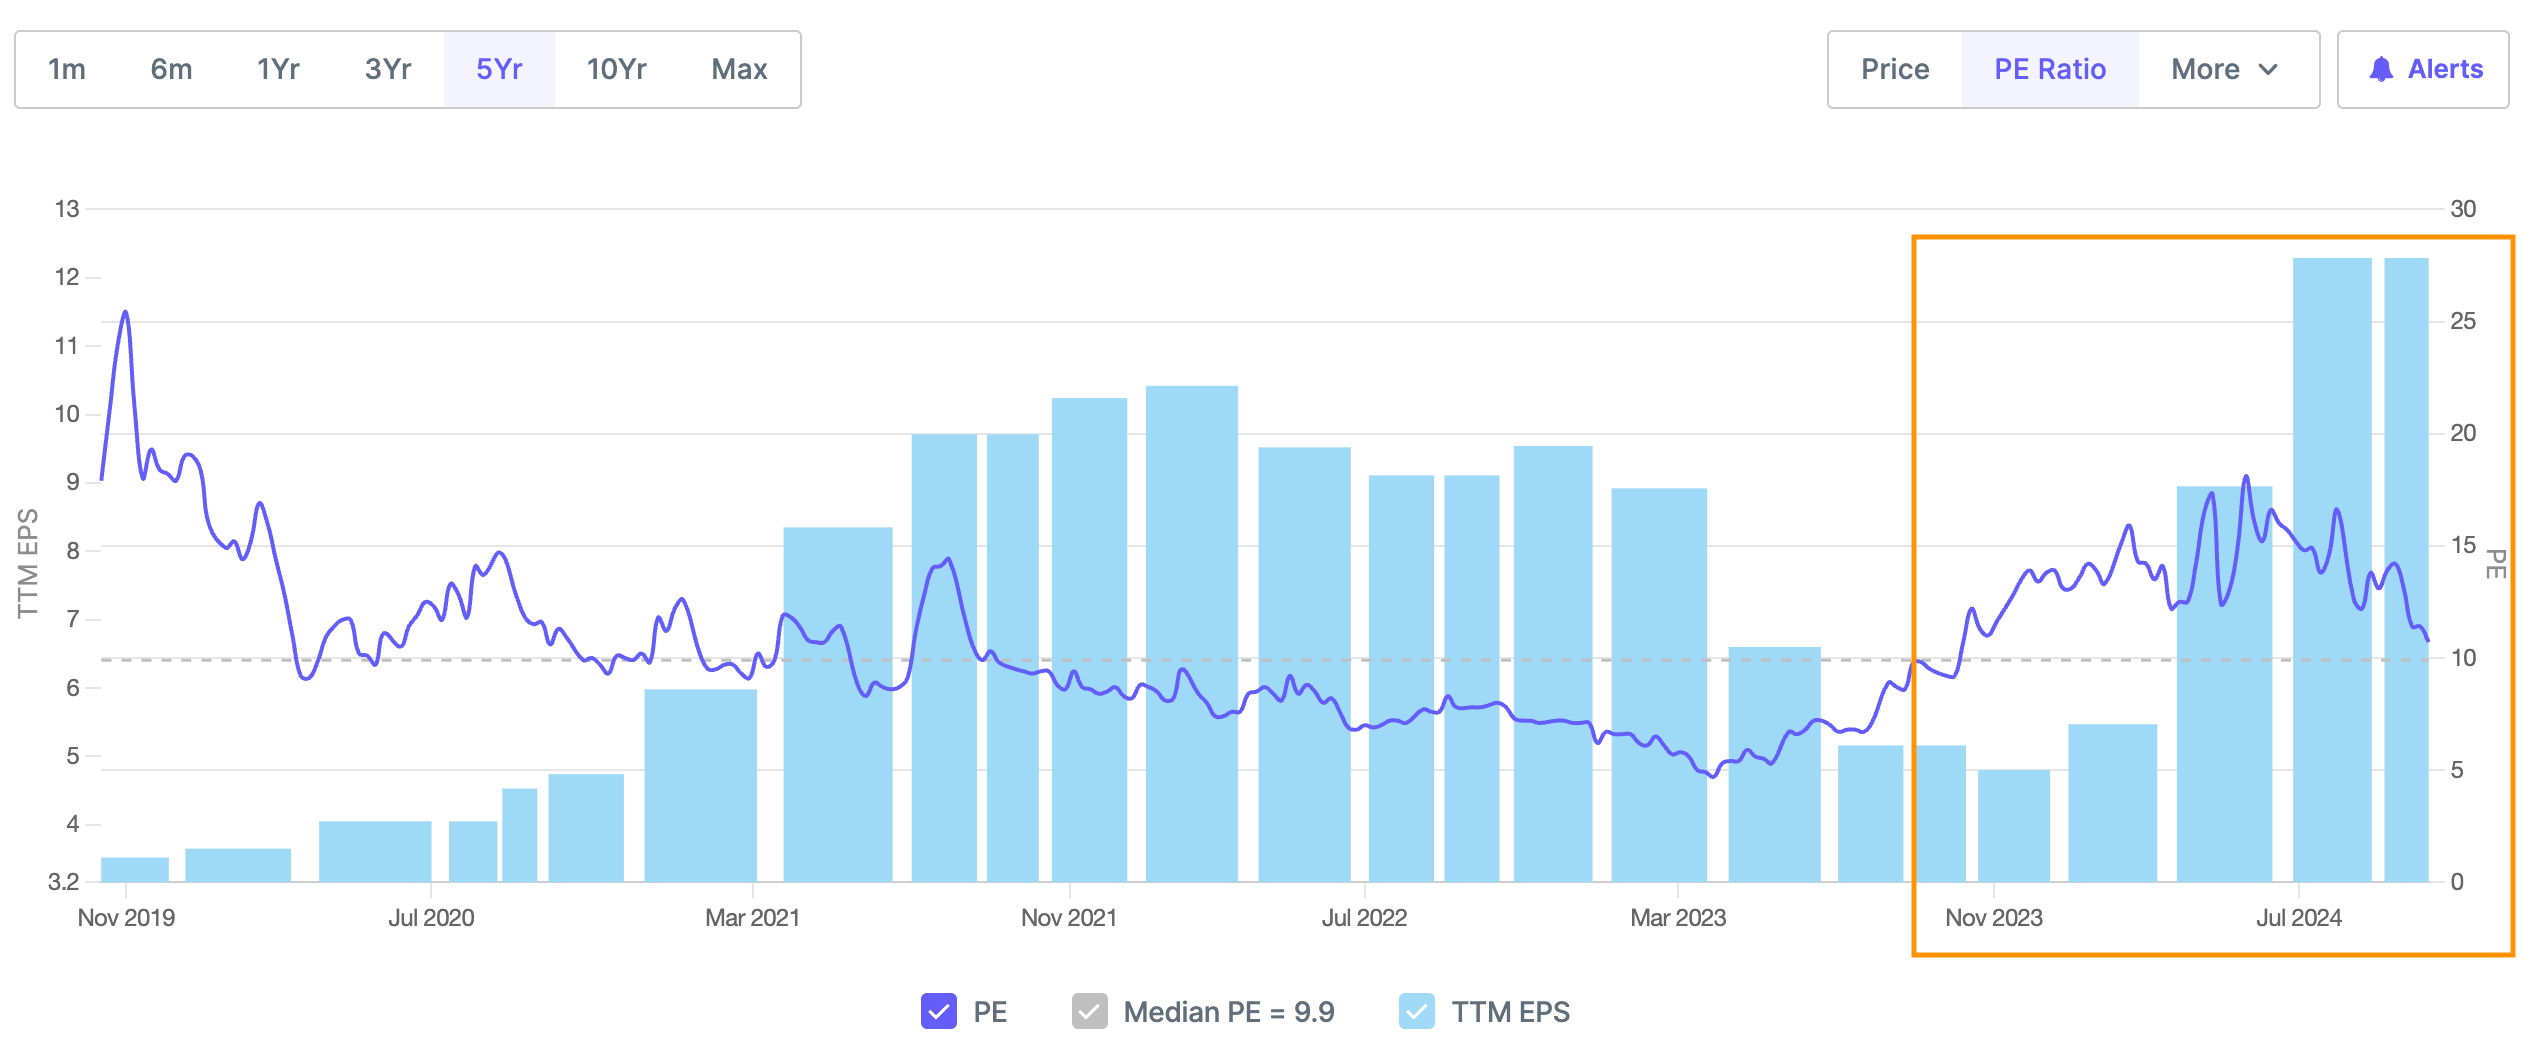
5Paisa Capital Ltd- Market cap 1,643 Cr+
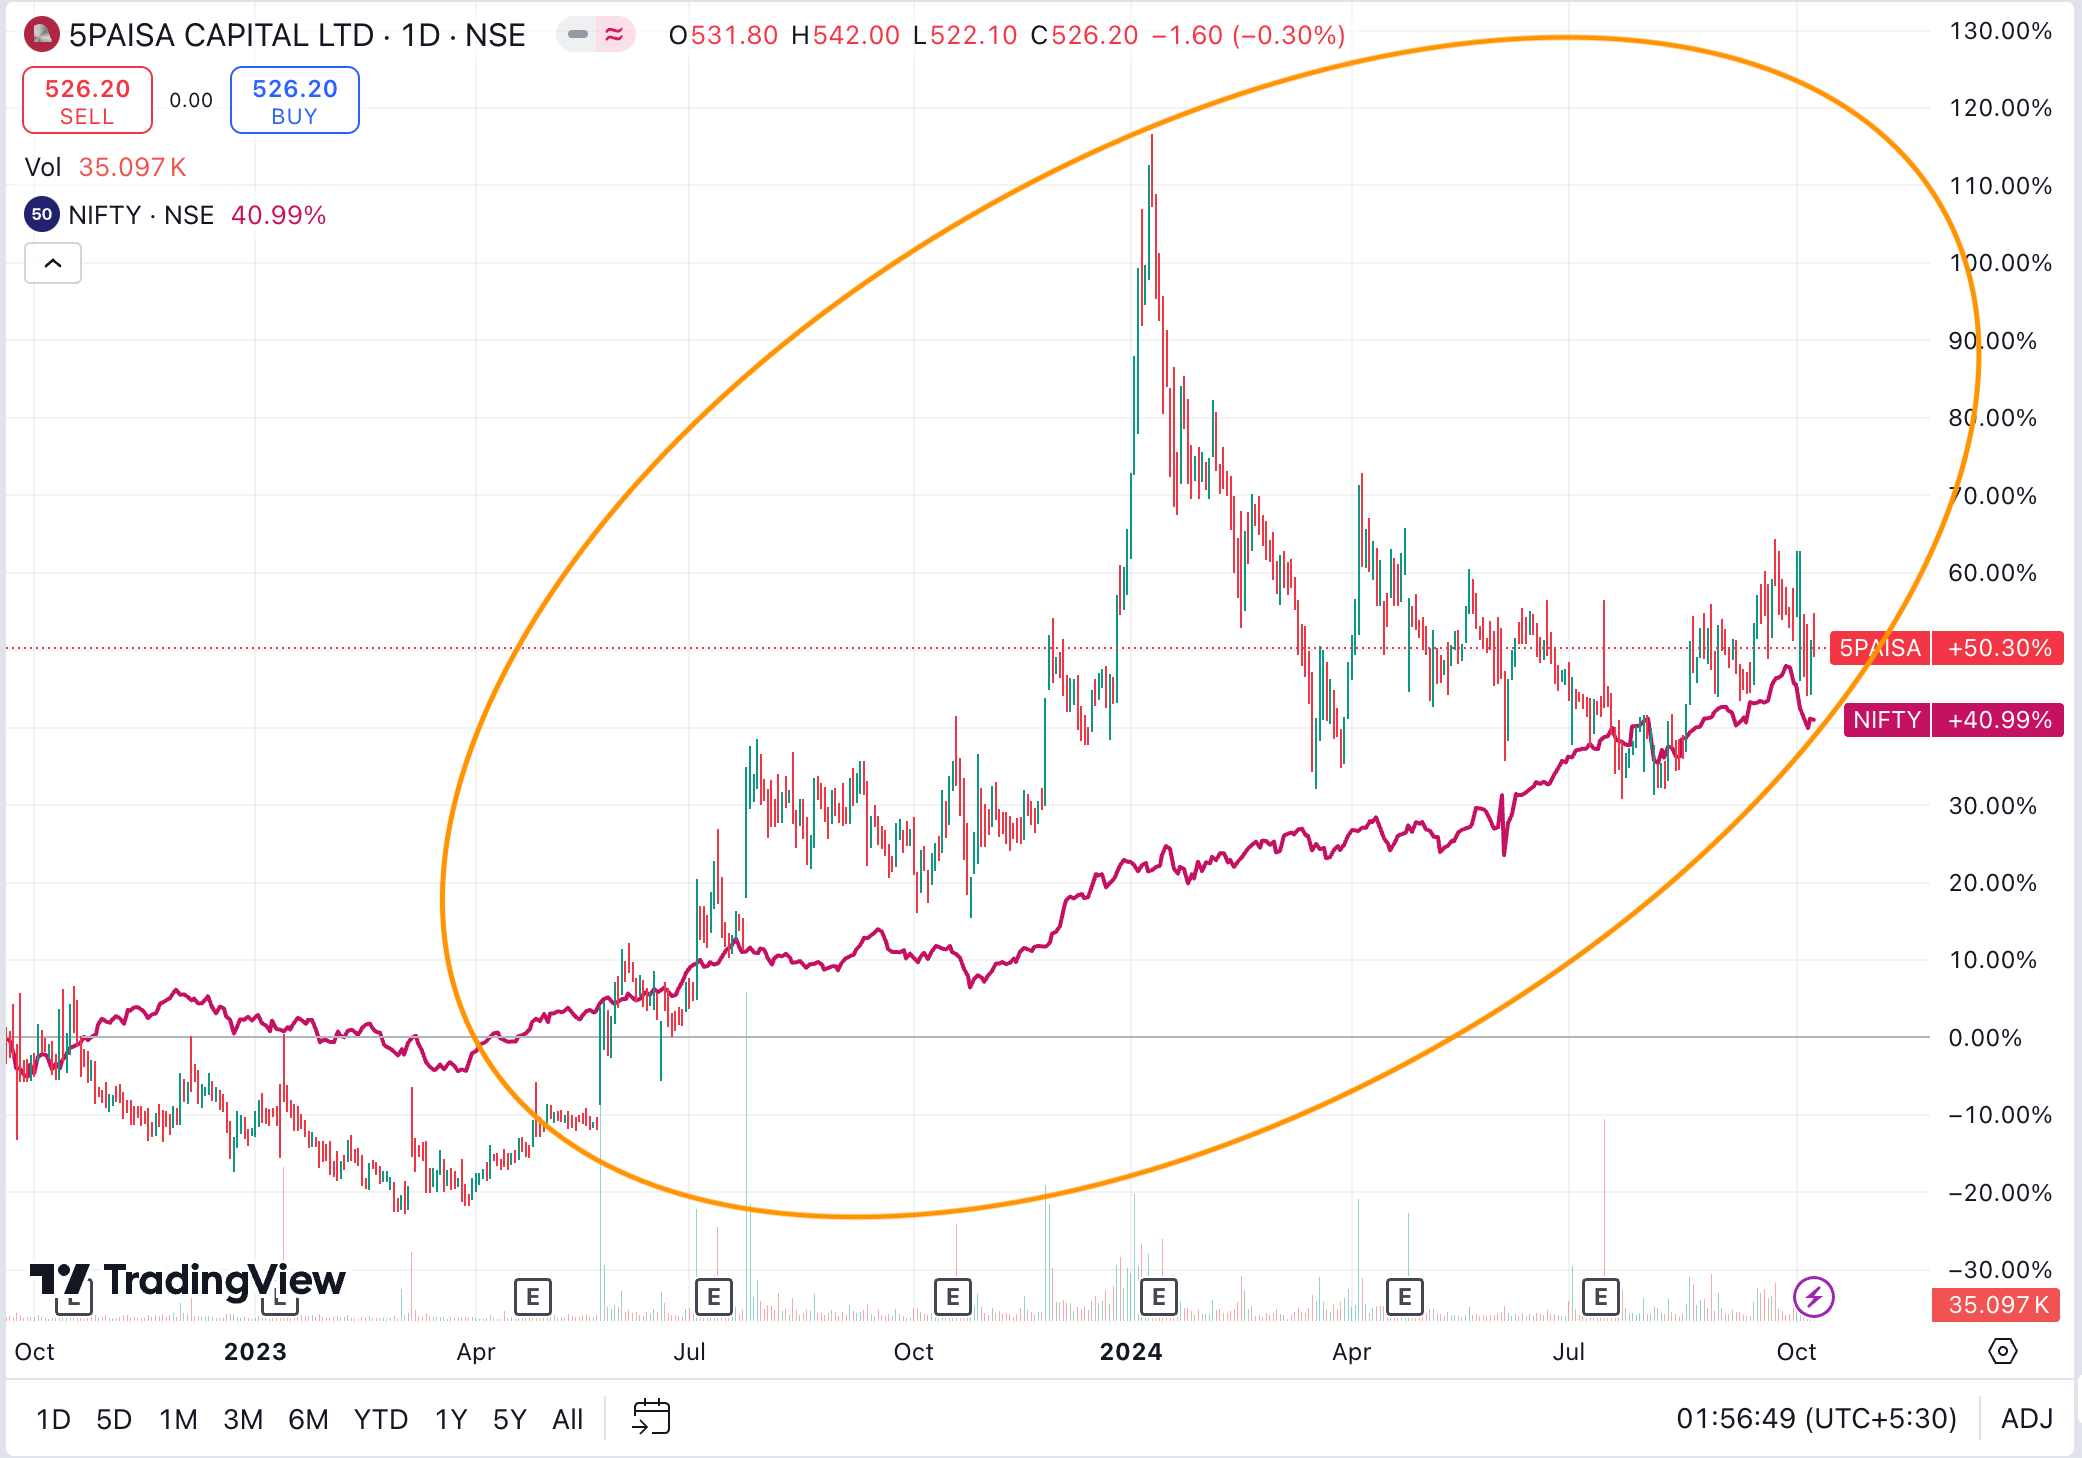
Price Action - Since Oct 2022 5Paisa - 50%, NIFTY 41%
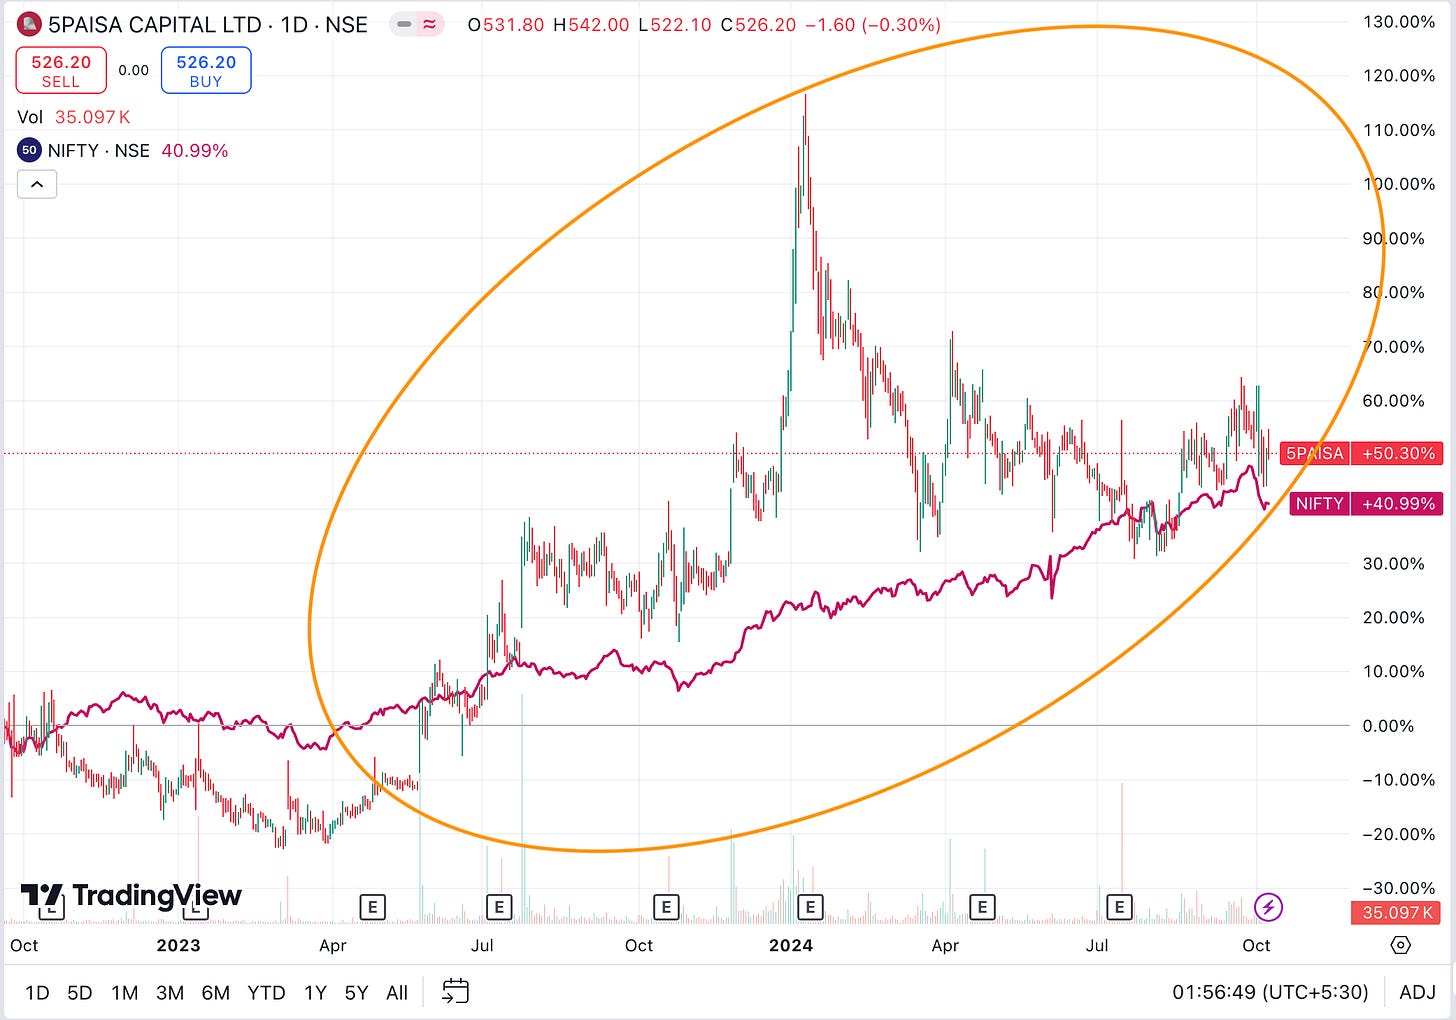
Operational metrics performance - Below chart shows Operating and Net Profit Margin consistently increasing from Jan 2022 while there is a consistent revenue increase from Jun 2023.
Q1 25 results (QoQ Increase) - Sales decreased by 9% and Profits increased by 43%
Q1 25 results (YoY increase) - Sales increased by 21% and Profits increased by 20%
Valuations and EPS - Below chart shows TTM EPS (EPS of last 4 quarters) consistently increasing from July 2022 to Nov 2023 and then dipping a bit. The price did not move as fast as the EPS growth leading to PE derating to 30
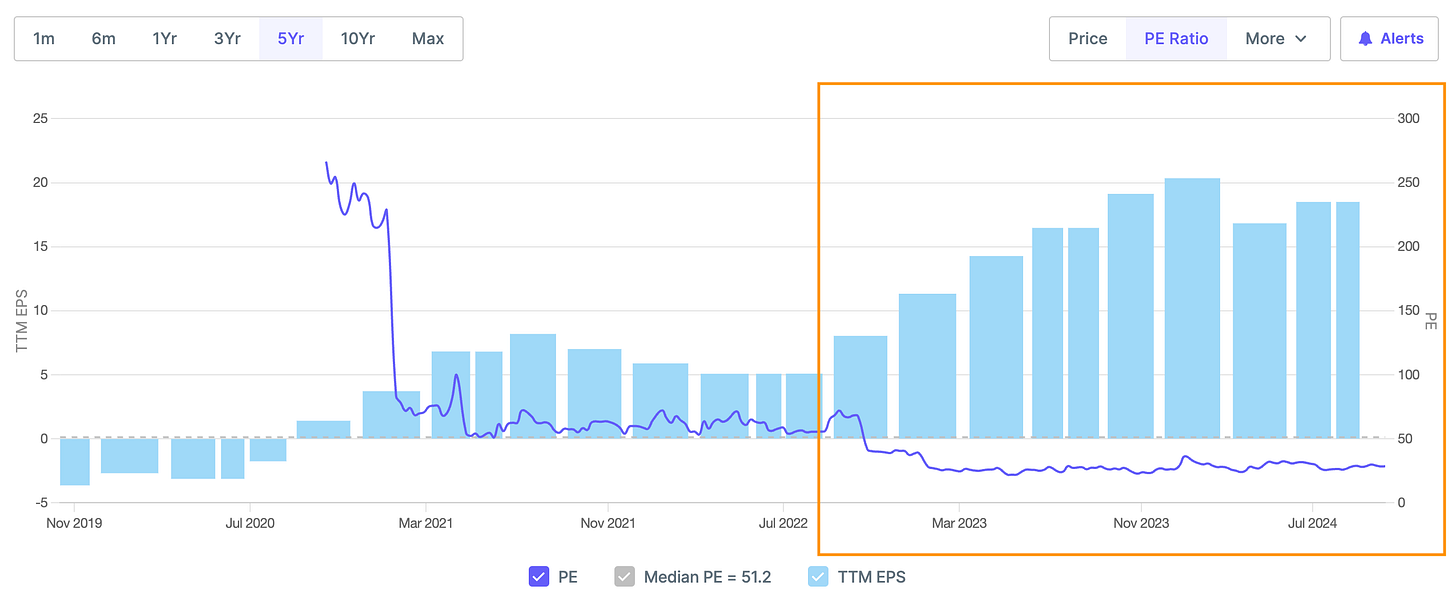
PE at 30 i.e. below historical average
TTM EPS (EPS of Last 4 quarters) - Consistent growth since July 2022 till Nov 2023 and then dips a bit
What led to outperformance
AUM Growth
Mutual fund AUM reached ₹1,124 crore, a 90% growth YoY
Market Share
Overall market share stood between 2% - 2.5% for both cash and F&O segments
Revenue Growth
Total revenue up 21% YoY to ₹102 crore, with broking revenue growing 11% YoY to ₹40 crore
Client Acquisition
Total customer base reached 44.7 lakhs, with 2.34 lakh new customers acquired in Q1, reflecting 116% growth YoY
Trading Volumes
i. Average Daily Turnover (ADTO) grew to ₹3.67 trillion, a growth of 27% YoY
Product Portfolio
Enhanced features for option traders, including straddle chains and bulk order placement. Introduced new FnO 360 product for derivatives trading
Technology Improvements
Revamped mobile app for iOS and Android to be available by end of Q2 FY'25 . Trade Station 2.0, a revamped web platform, now accessible to all users
Financial Performance
Achieved highest ever PAT of ₹20.1 crore, a growth of 248% QoQ and 39% YoY. PAT margins improved to 20%
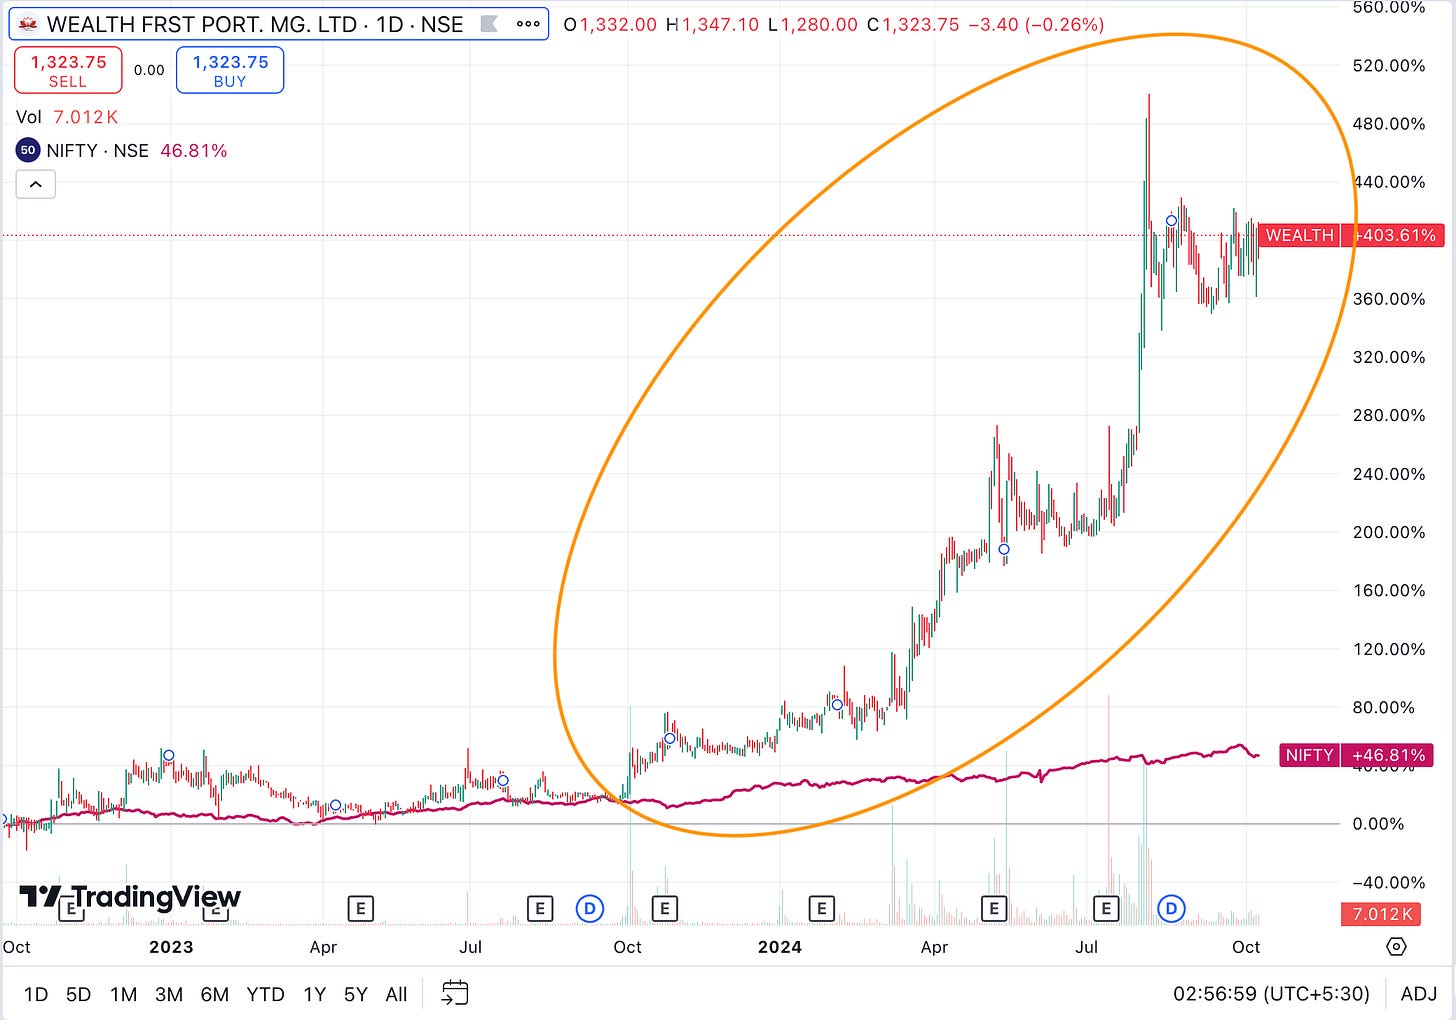
Wealth First Ltd- Market cap 1,410 Cr+
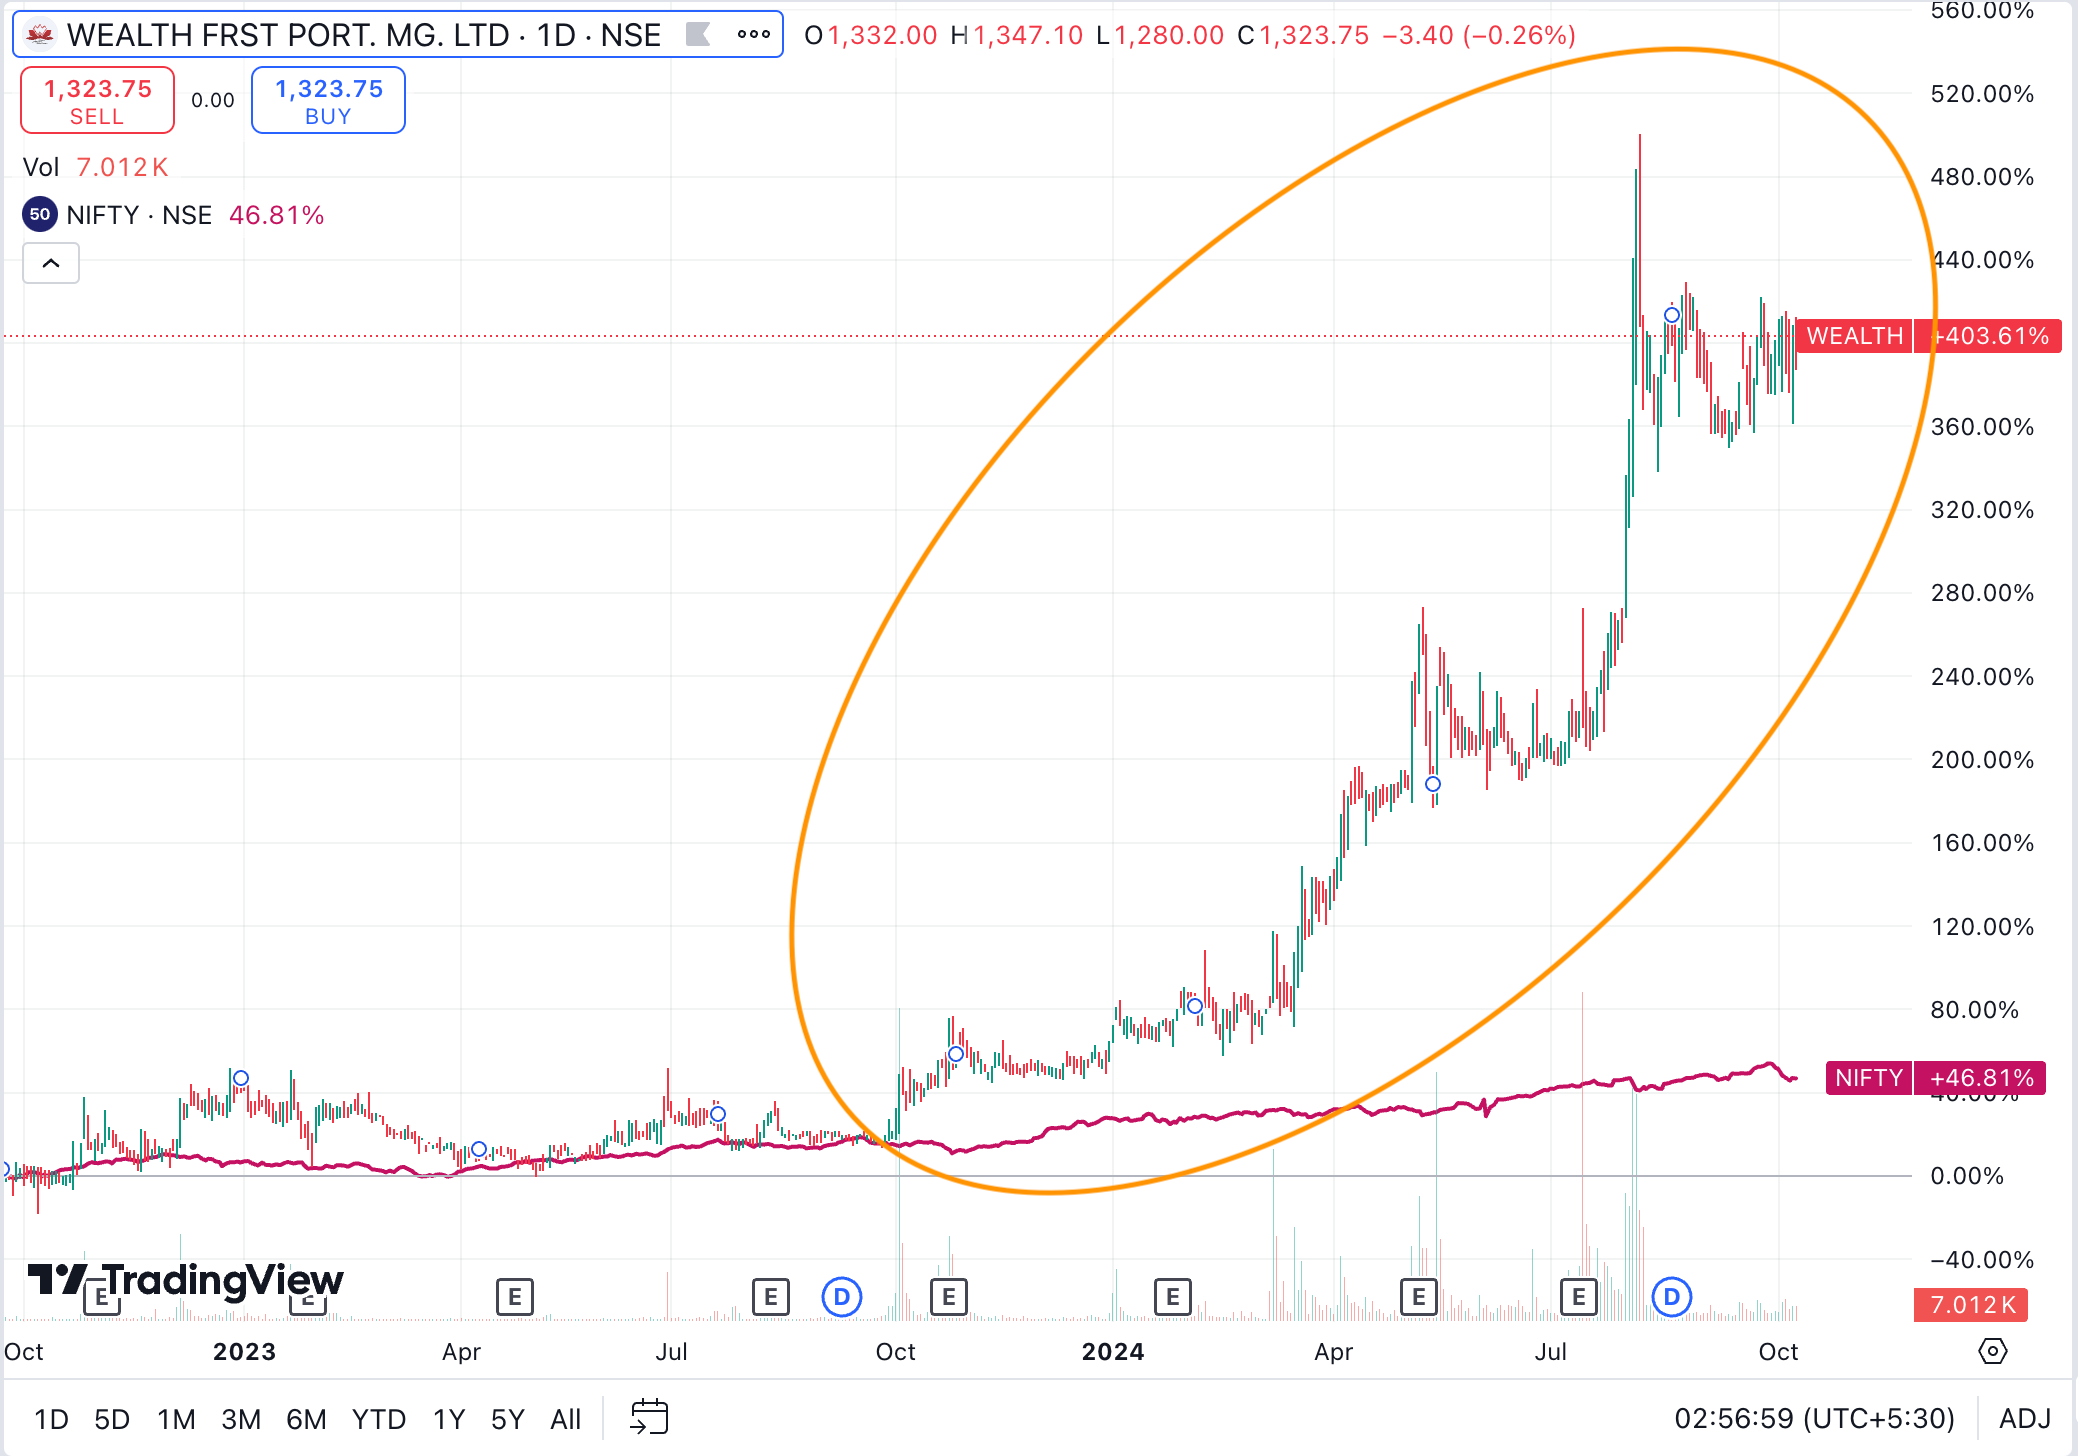
Price Action - Since Oct 2022 Wealth First - 404%, NIFTY 47%
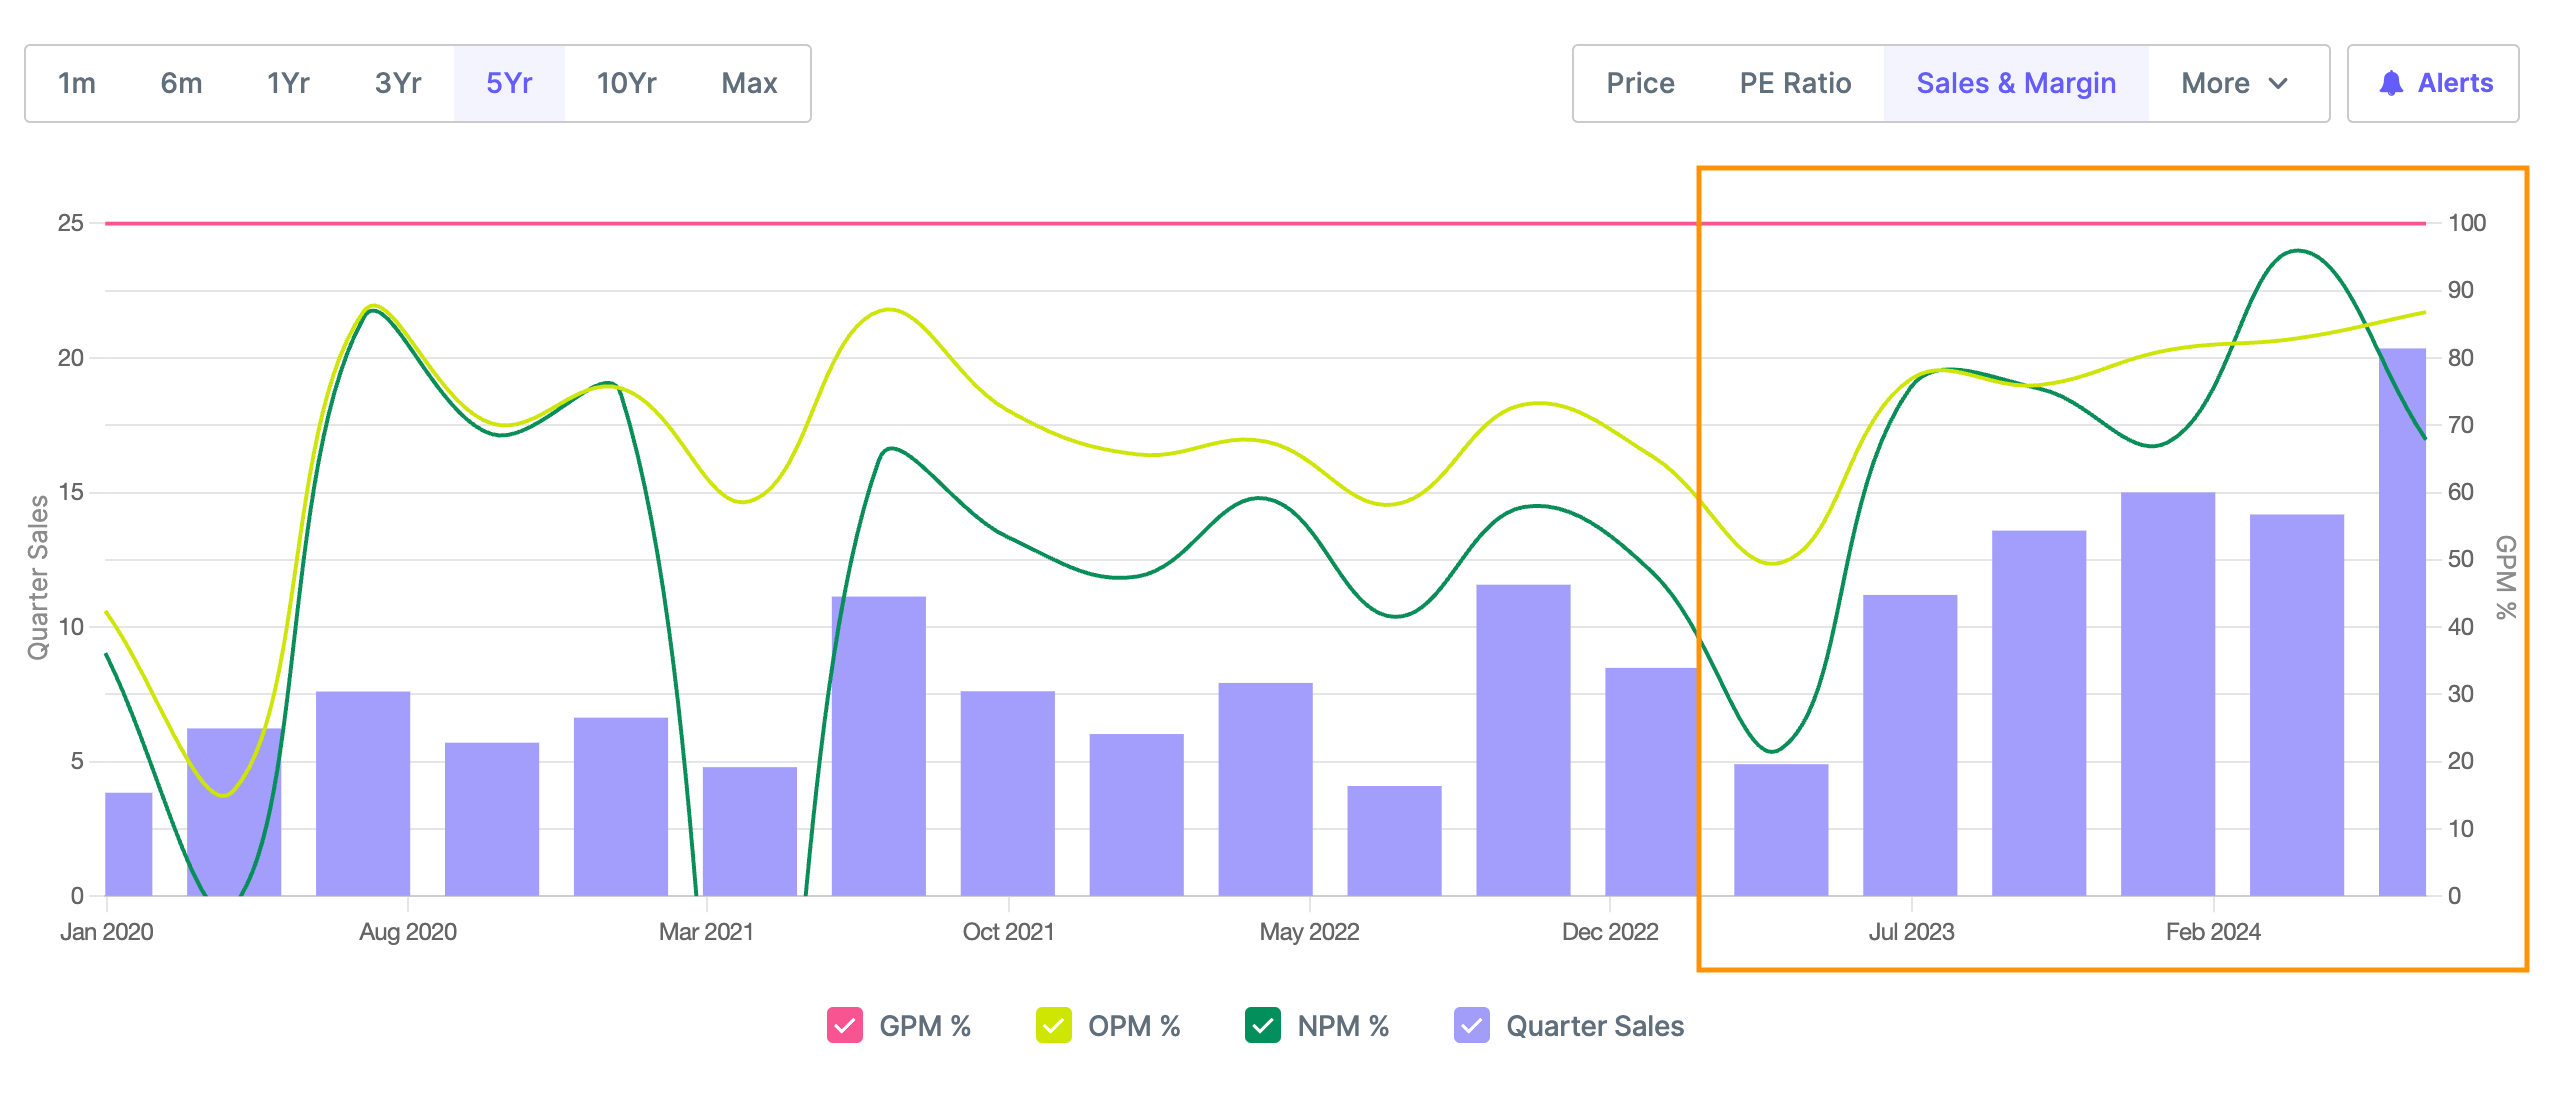
Operational metrics performance - Below chart shows Revenue, Operating and Net Profit Margin consistently increasing from Jan 2023
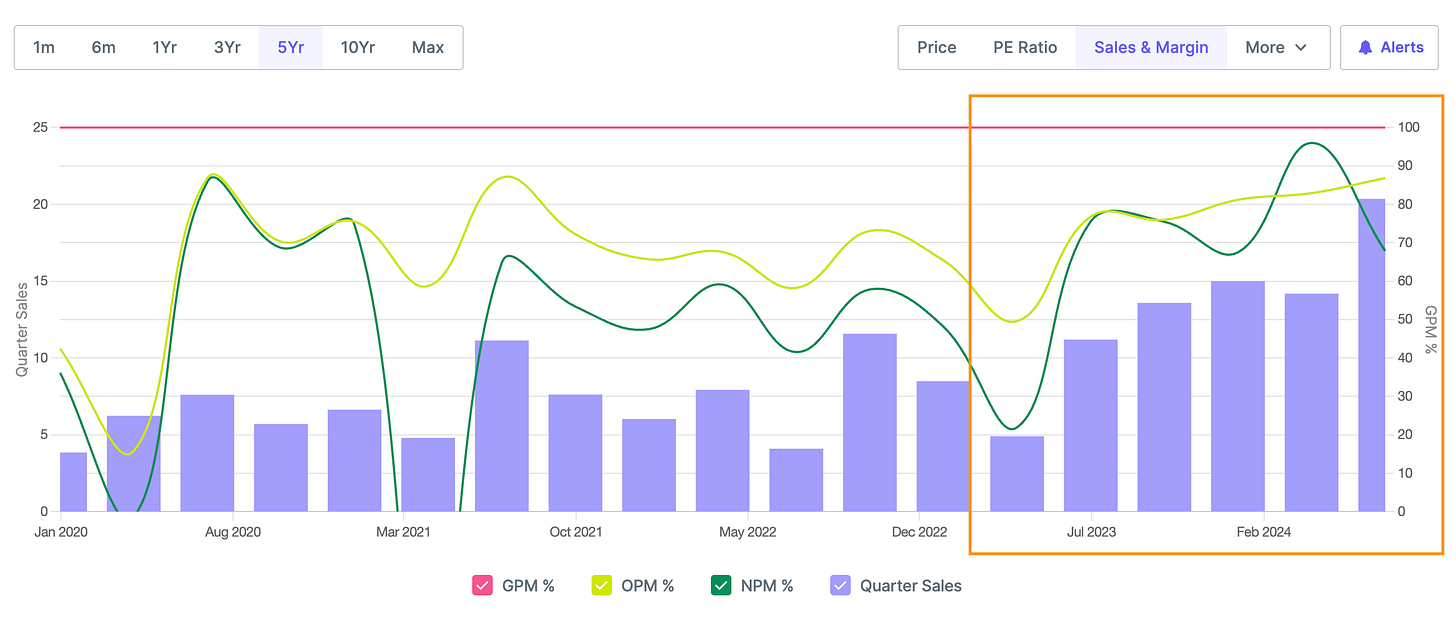
Q1 25 results (QoQ Increase) - Sales increased by 44% and Profits increased by 34%
Q1 25 results (YoY increase) - Sales increased by 82% and Profits increased by 13%
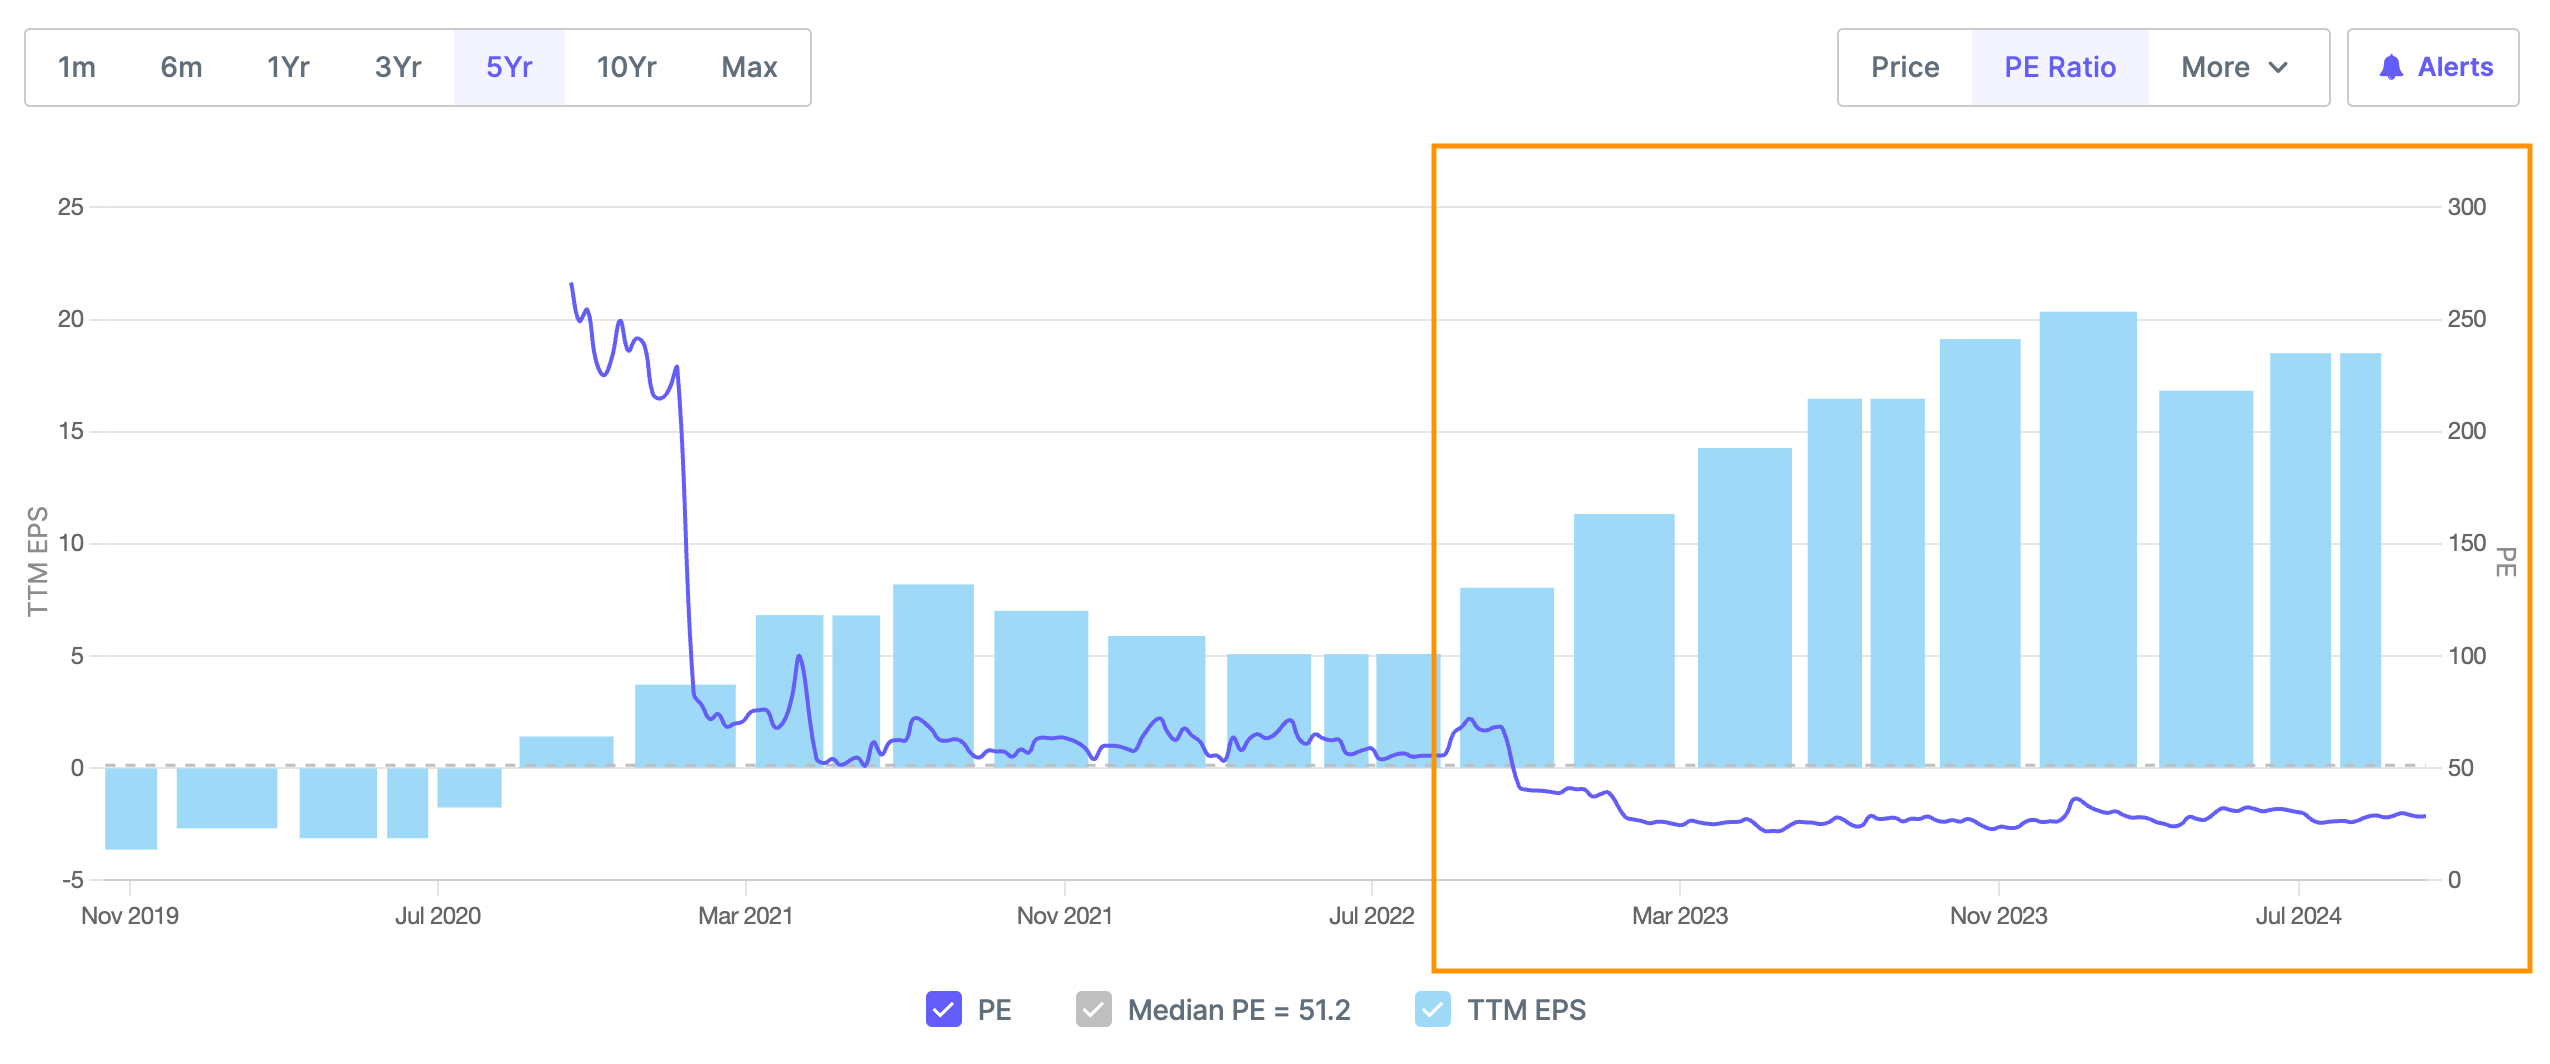
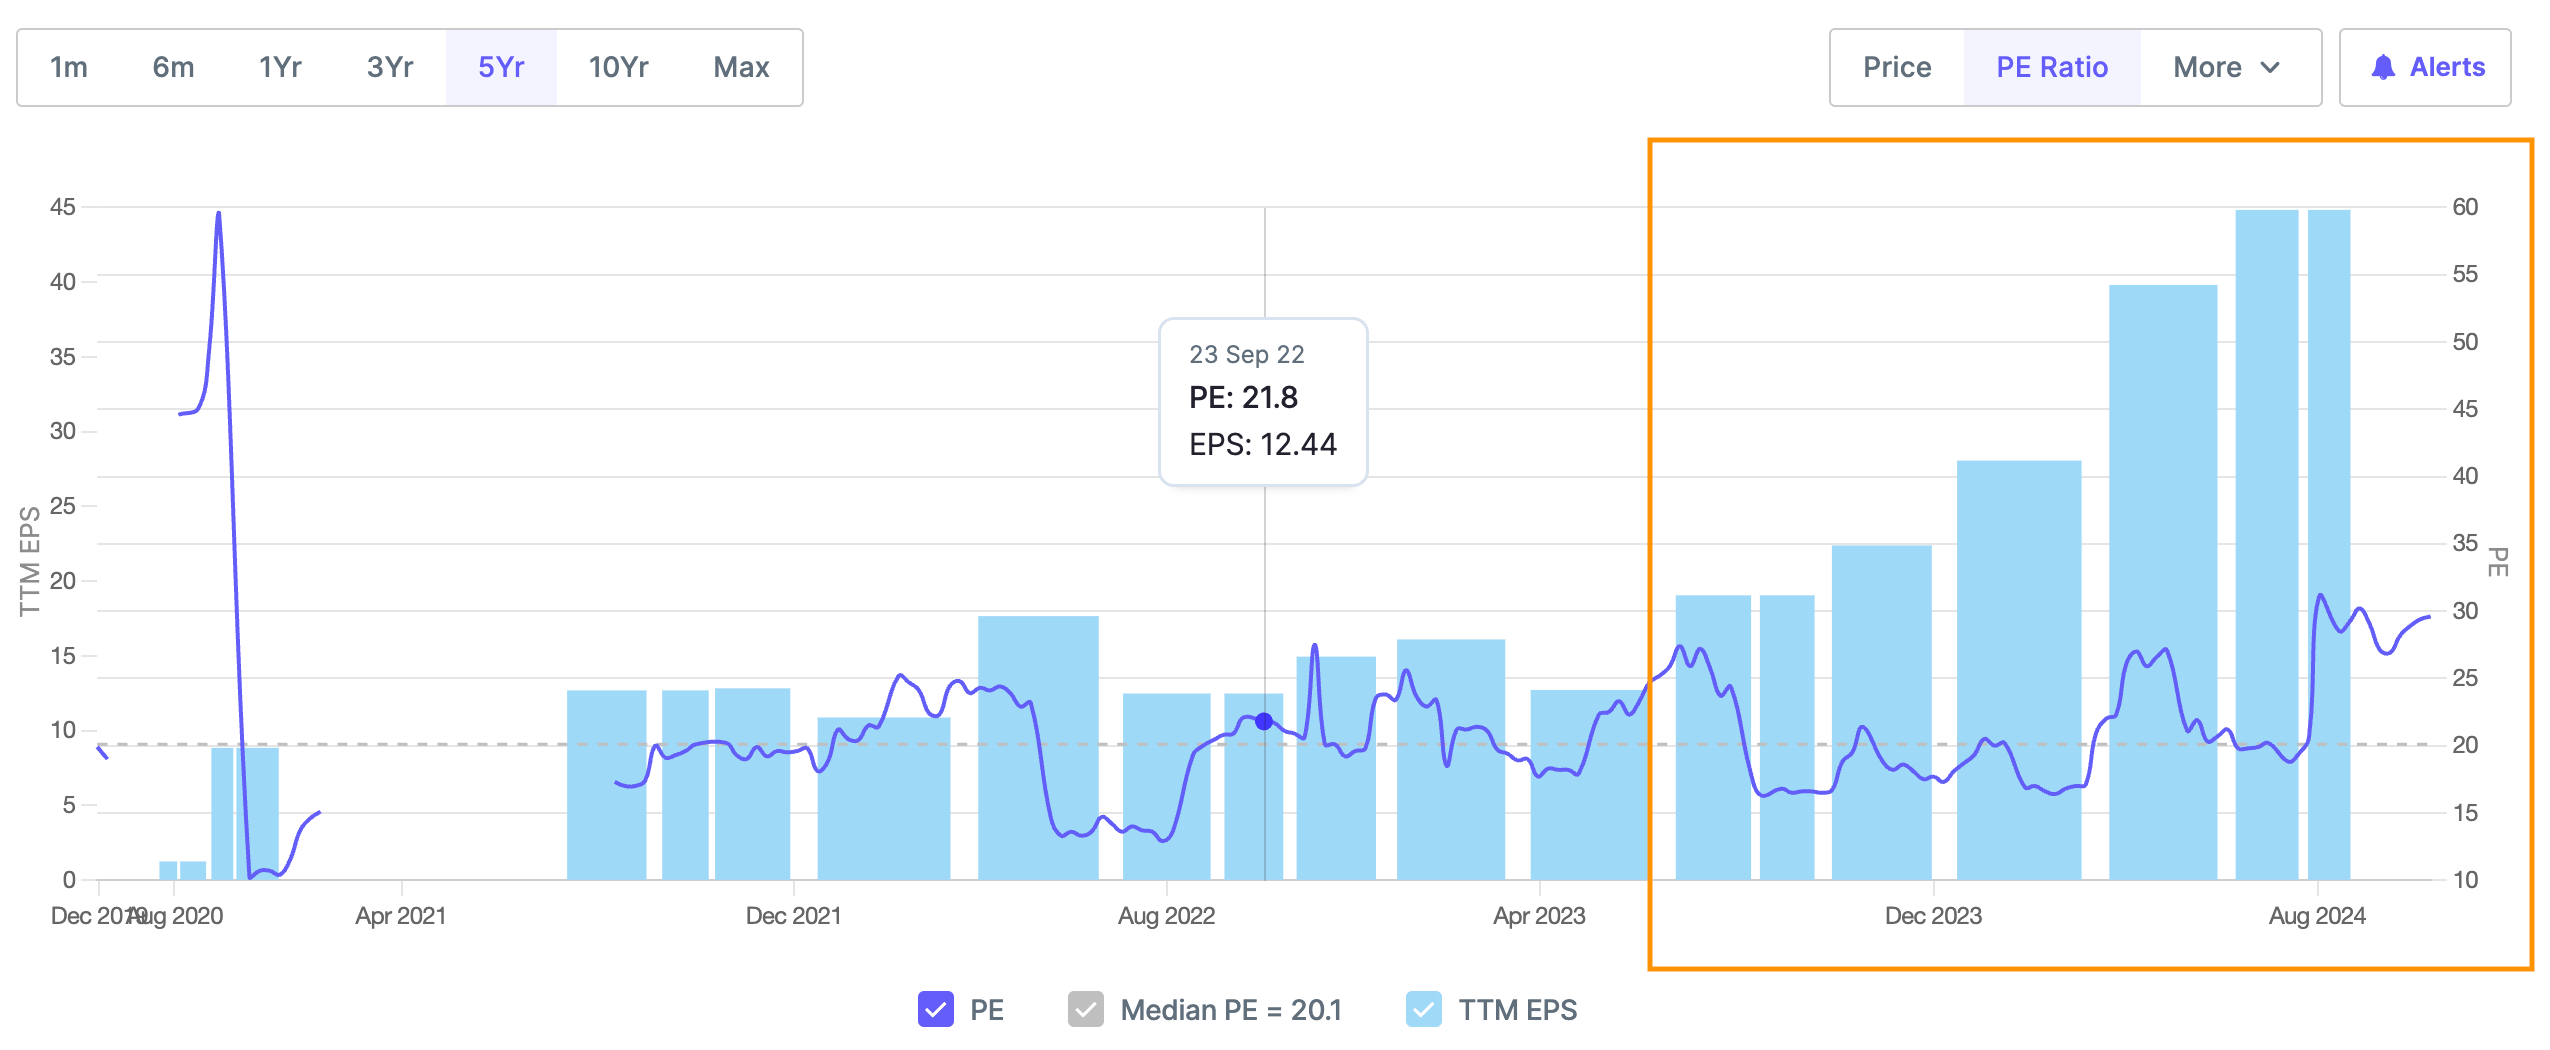
Valuations and EPS - Below chart shows TTM EPS (EPS of last 4 quarters) increasing consistently since April 2023. For the first few quarters price grew at the same pace as TTM EPS but in the last quarter grew faster than TTM EPS leading to PE stablising at 30
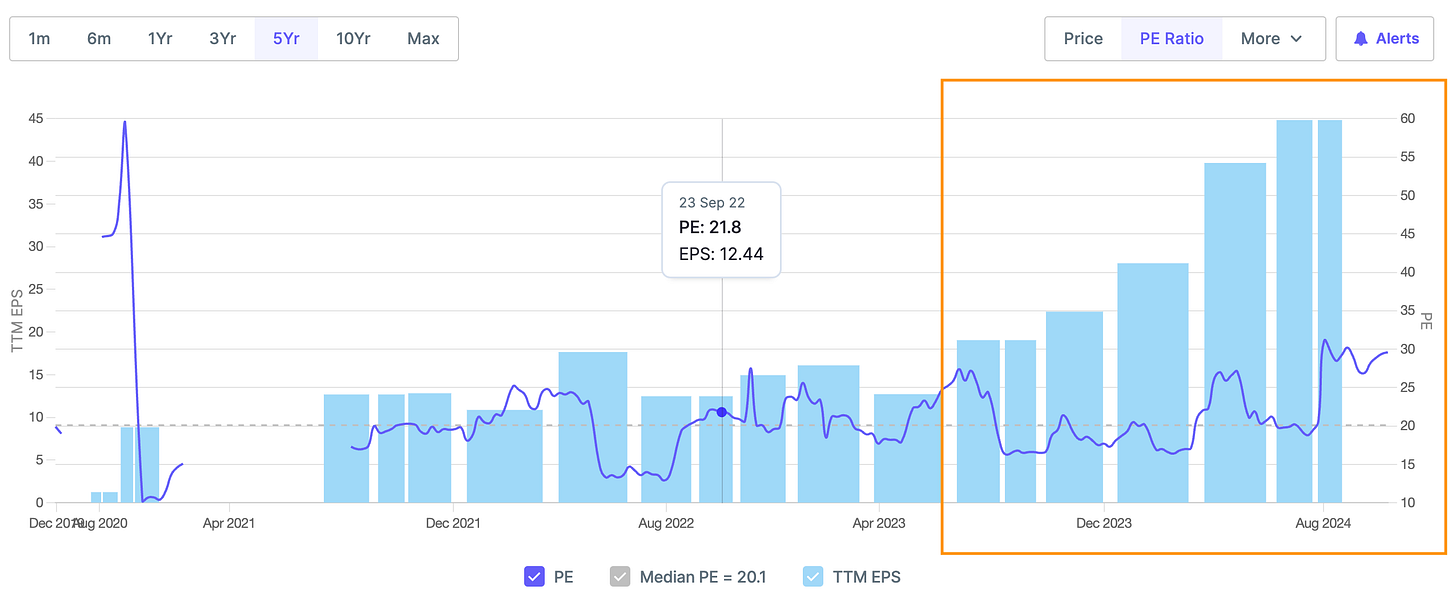
PE at 30 i.e. above historical average
TTM EPS (EPS of Last 4 quarters) - Consistent growth since April 2023
What led to outperformance
AUA Growth
Total AUA grew 36% YoY to ₹11,417.8 crore, including strong growth in MF+PMS AUM and other business segments
ARR AUM Growth
Assets under Recurring Revenue (ARR AUM) increased by 65% YoY to ₹5,448.3 crore
Revenue Growth
Total revenue from operations up 55% YoY to ₹21.6 crore, with trail base revenue growing faster at 76% YoY to ₹11.2 crore
Client Acquisition
Total client base increased to 19,887, which is a growth of 6% YoY
Total client families increased by 9% YoY to 5,996
Systematic Investments
Strong momentum in SIP inflows, with industry SIP inflow for the quarter ended June 2024 witnessing an inflow of ₹625 Bn, a growth of 45% YoY
Market Conditions
Strong market recovery following the general elections, resulting in significant inflows into equity funds
Operational Efficiency
Improved profitability with PAT jumping by 66% YoY to ₹14.0 crore ii. PAT margin improved from 60.5% in Q1 FY24 to 64.9% in Q1 FY25
The next 2 industries that we will be covering will be
Food processing Indian
Chemicals