


Not SEBI registered. Not investment advice. For your own research only.
Ten listed Indian companies that run online platforms: payments, jobs, travel, home services and shopping.
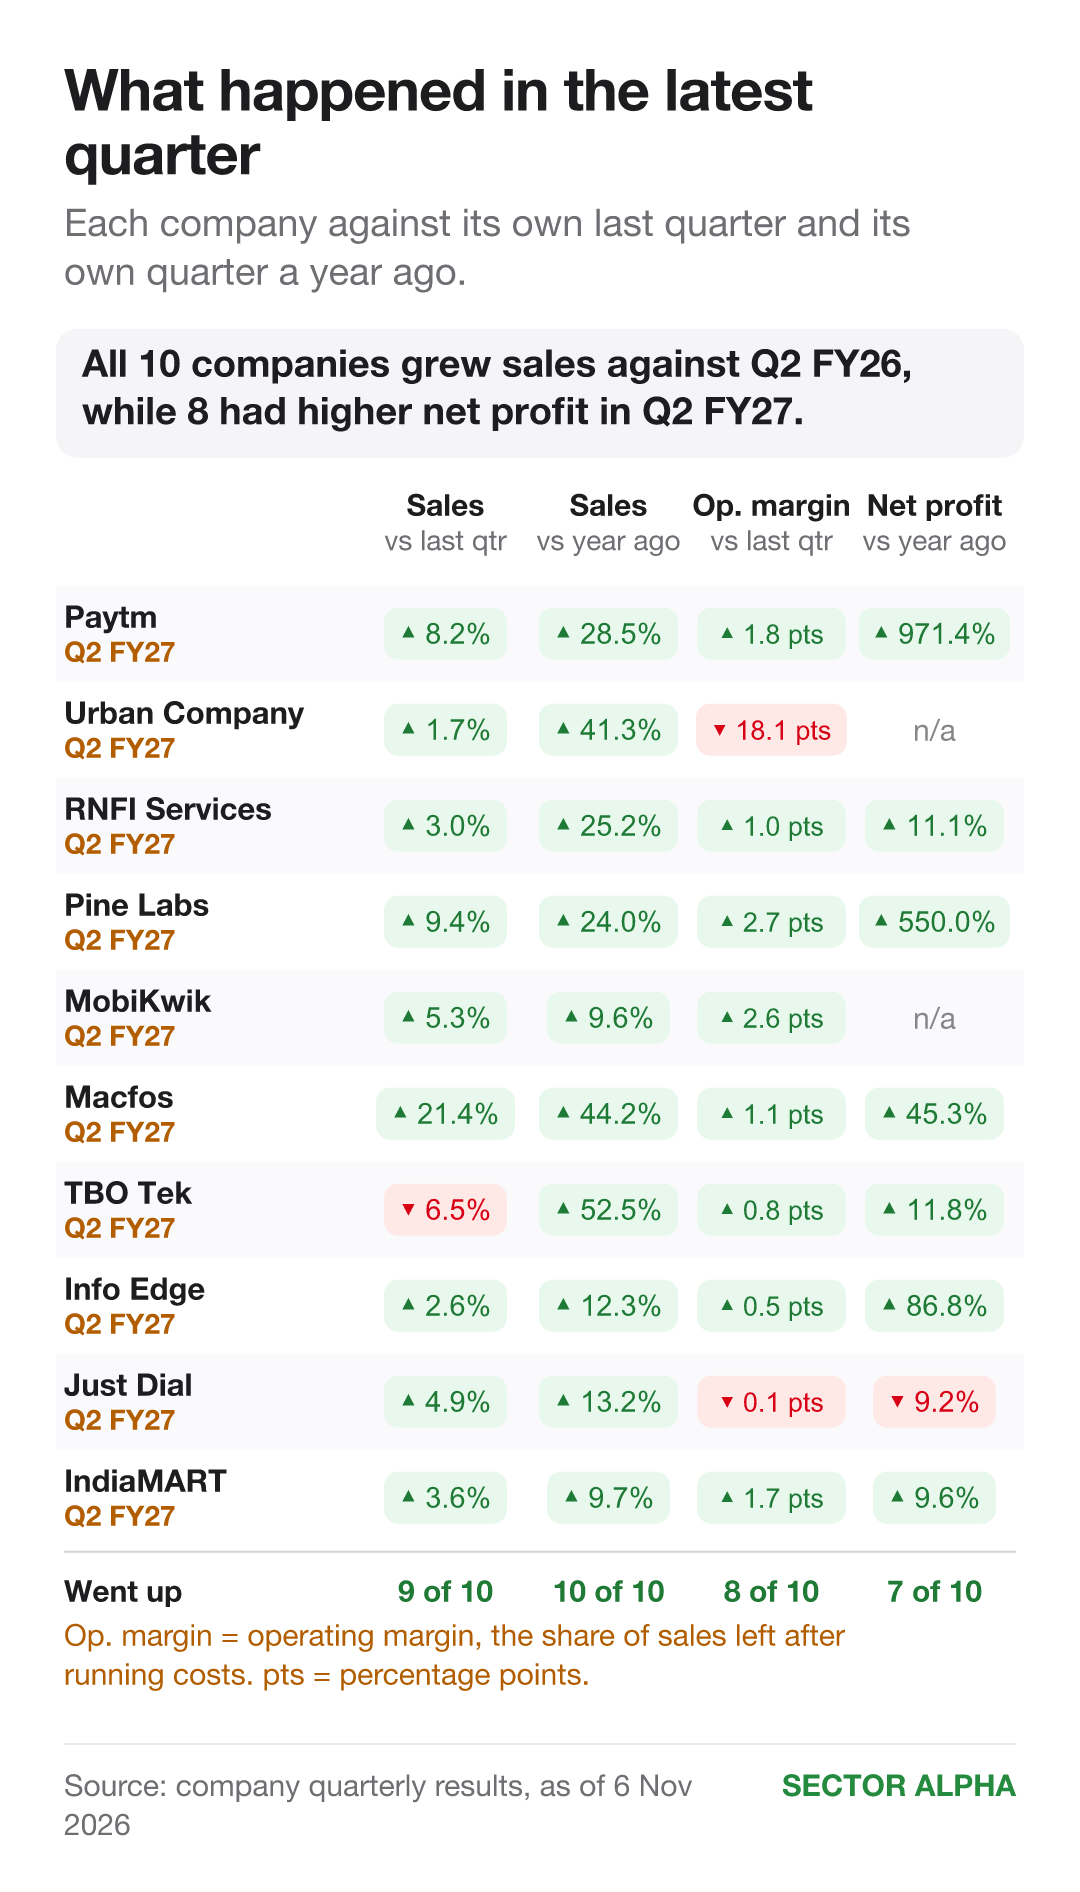
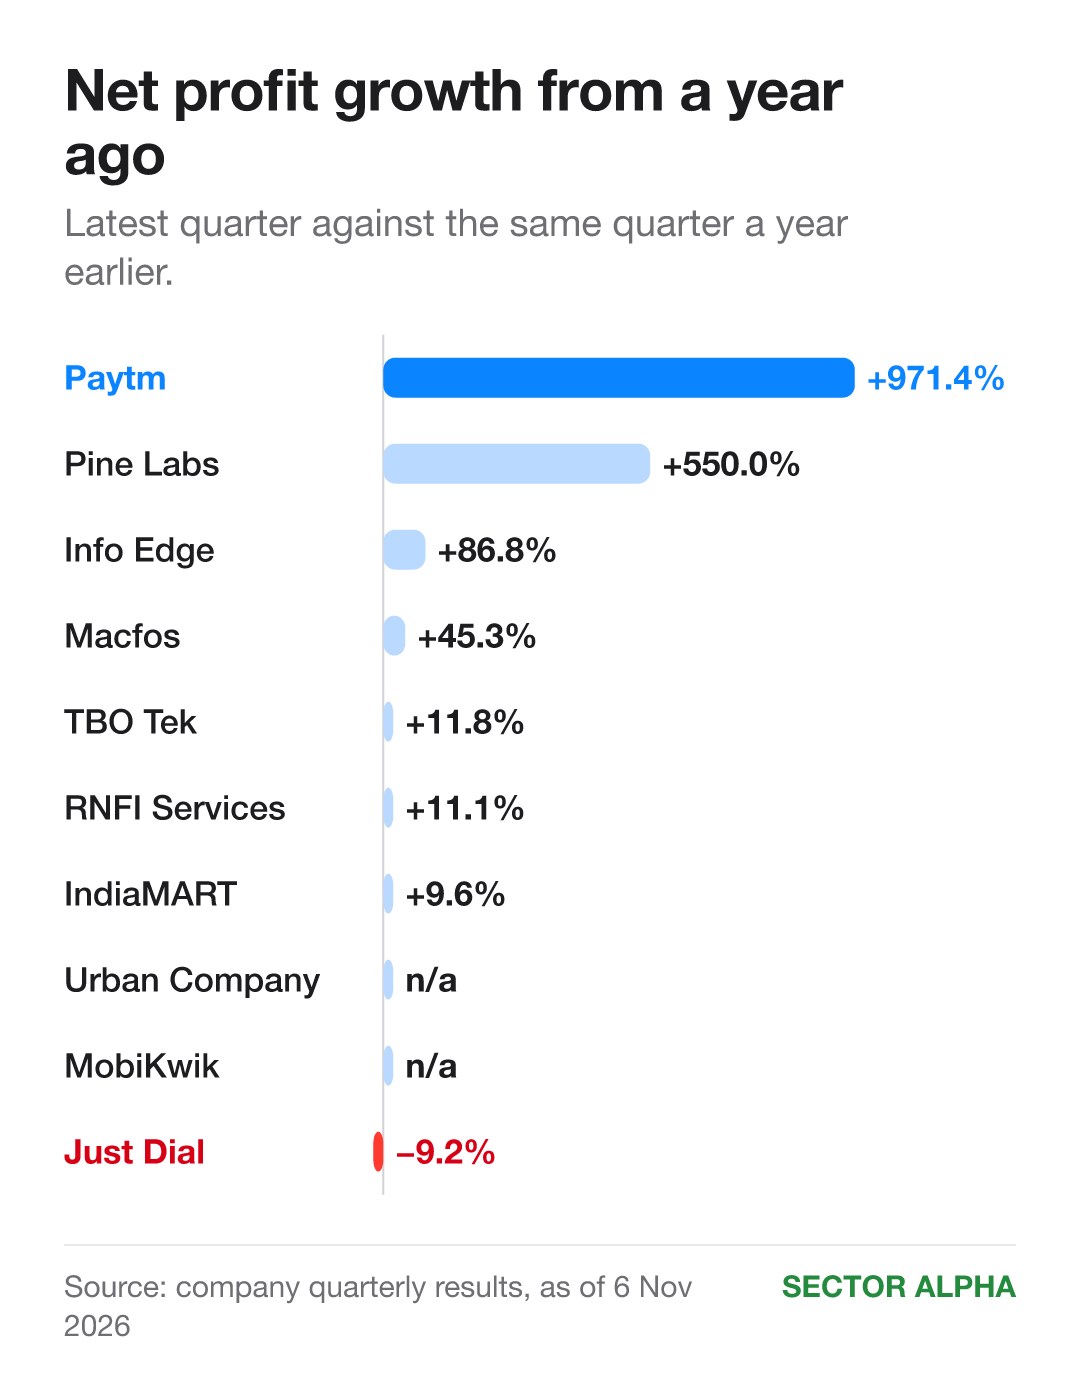
Sales: up from a year ago at all 10. Profit: up at 8, and the gap between them is huge. Paytm: ₹21 cr → ₹225 cr. Urban Company: loss of ₹59 cr → loss of ₹182 cr.
One thing to watch across the group: other income, money earned outside the main business. At Paytm it was ₹178 cr in the quarter.
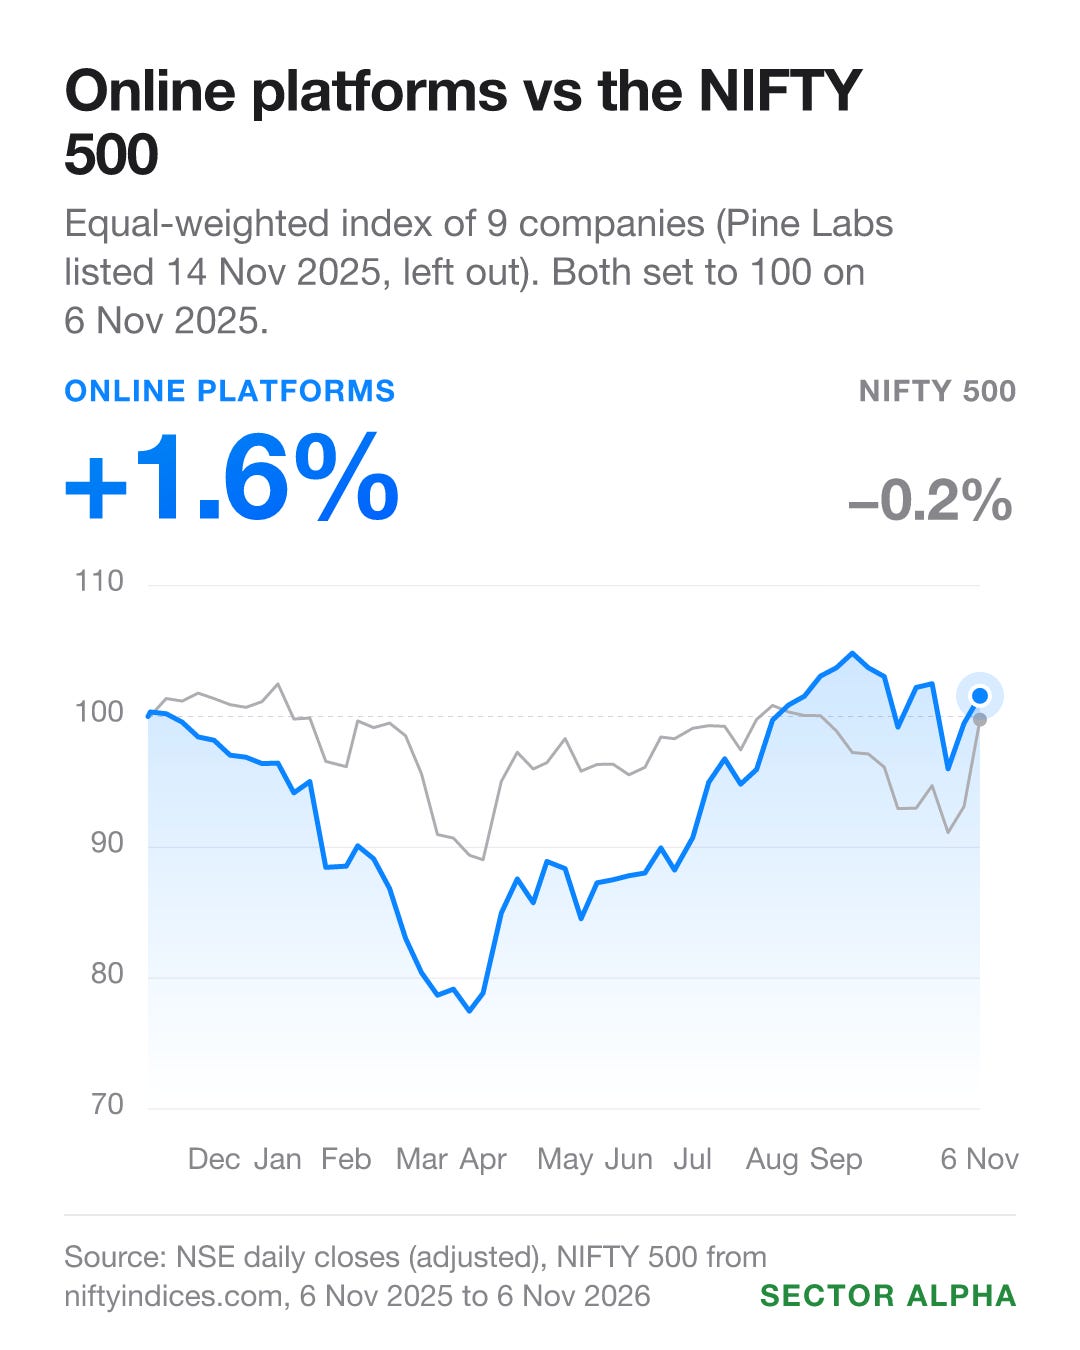
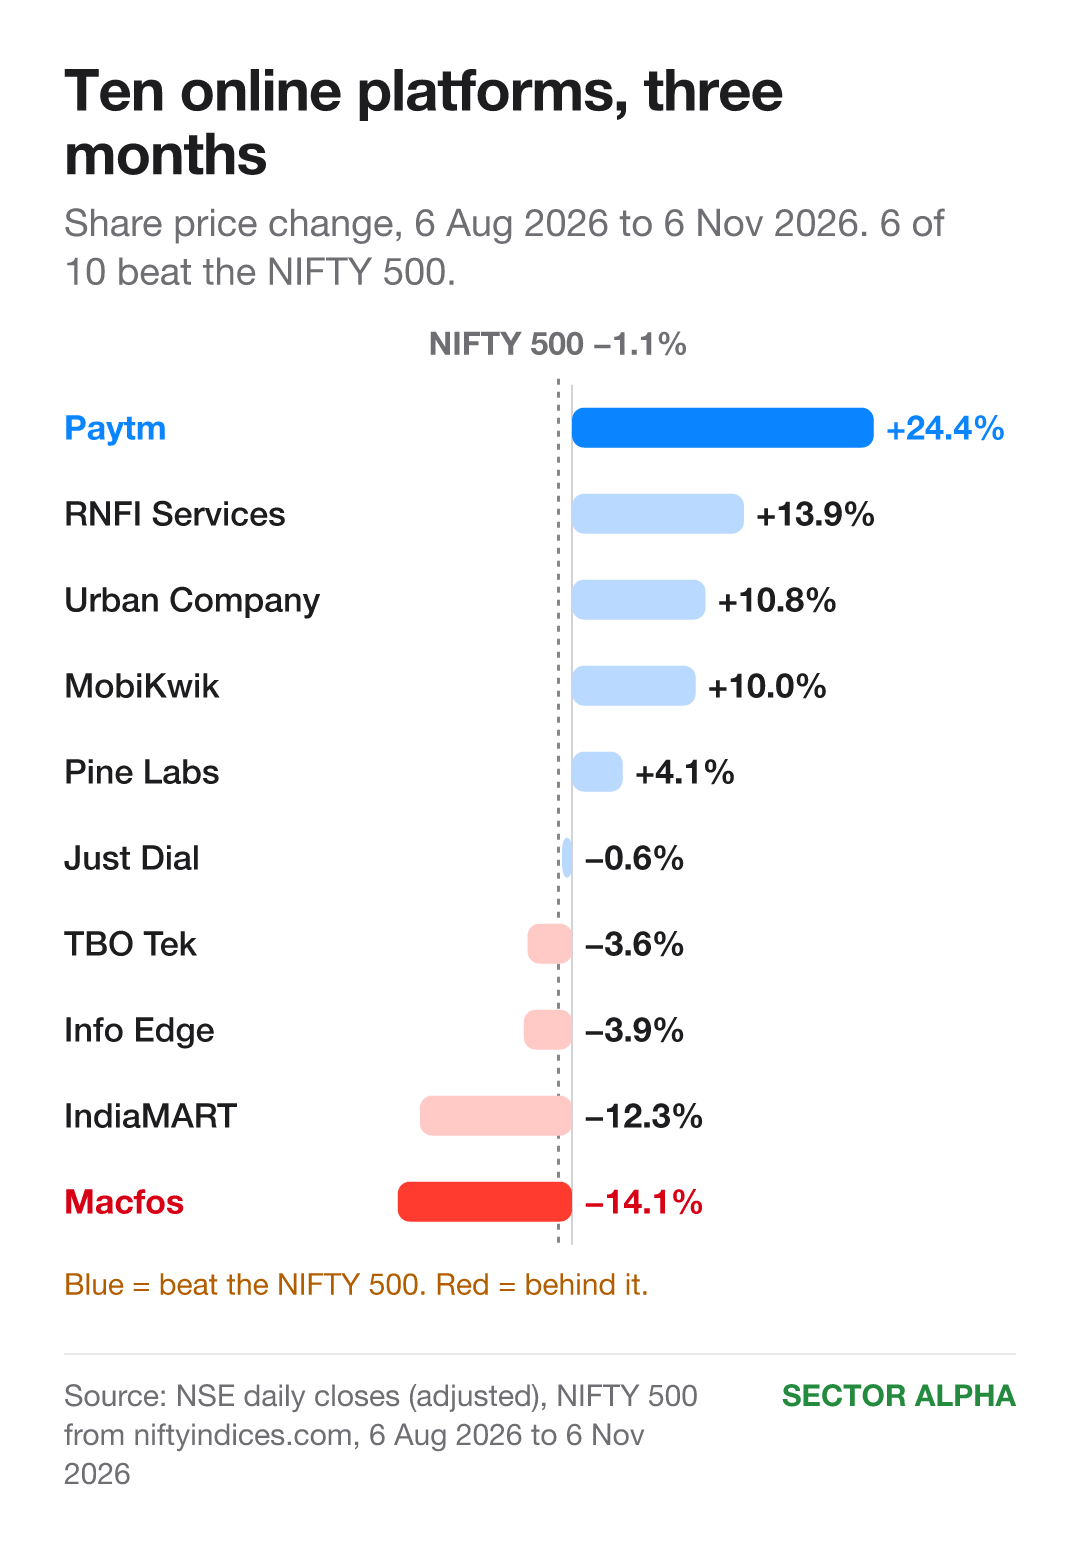
Share price in a year: the group up 1.6%, NIFTY 500 down 0.2%. The group puts equal money in 9 companies. Pine Labs is left out: it listed on 14 Nov 2025. Last 3 months: 6 of 10 beat the NIFTY 500, which fell 1.1%. Best: Paytm, up 24.4%. Worst: Macfos, down 14.1%.
What is happening in the online platforms sector
All 10 have reported July to September 2026 (Q2 FY27). Every company below is on that quarter.
How the ten compare
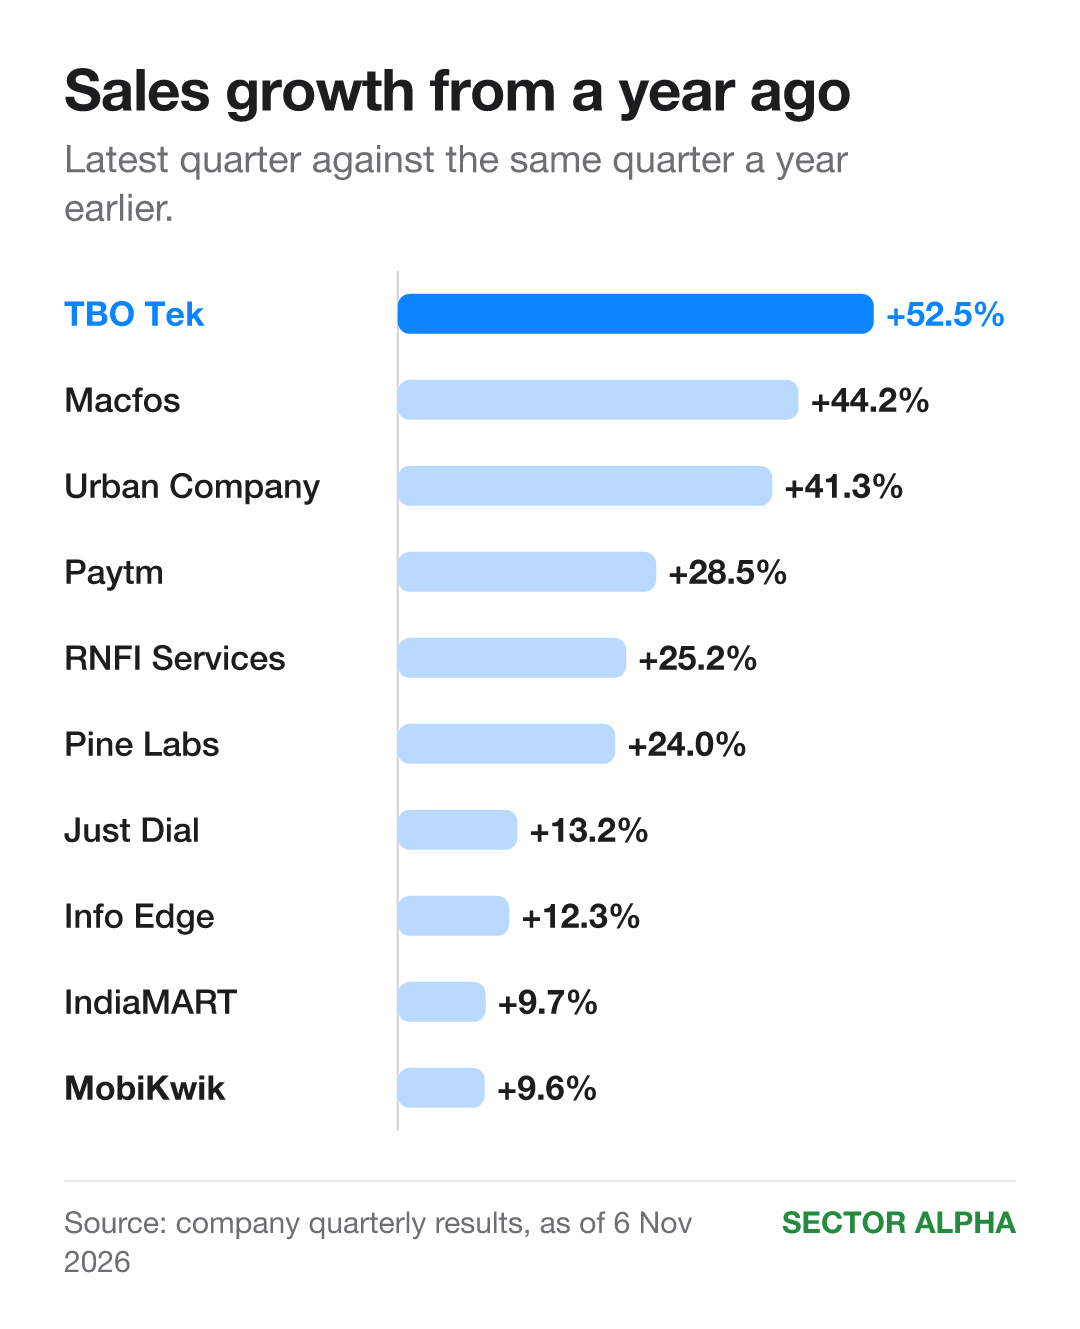
Sales up on a year ago: all 10. Sales up on Apr to Jun 2026: 9 of 10.
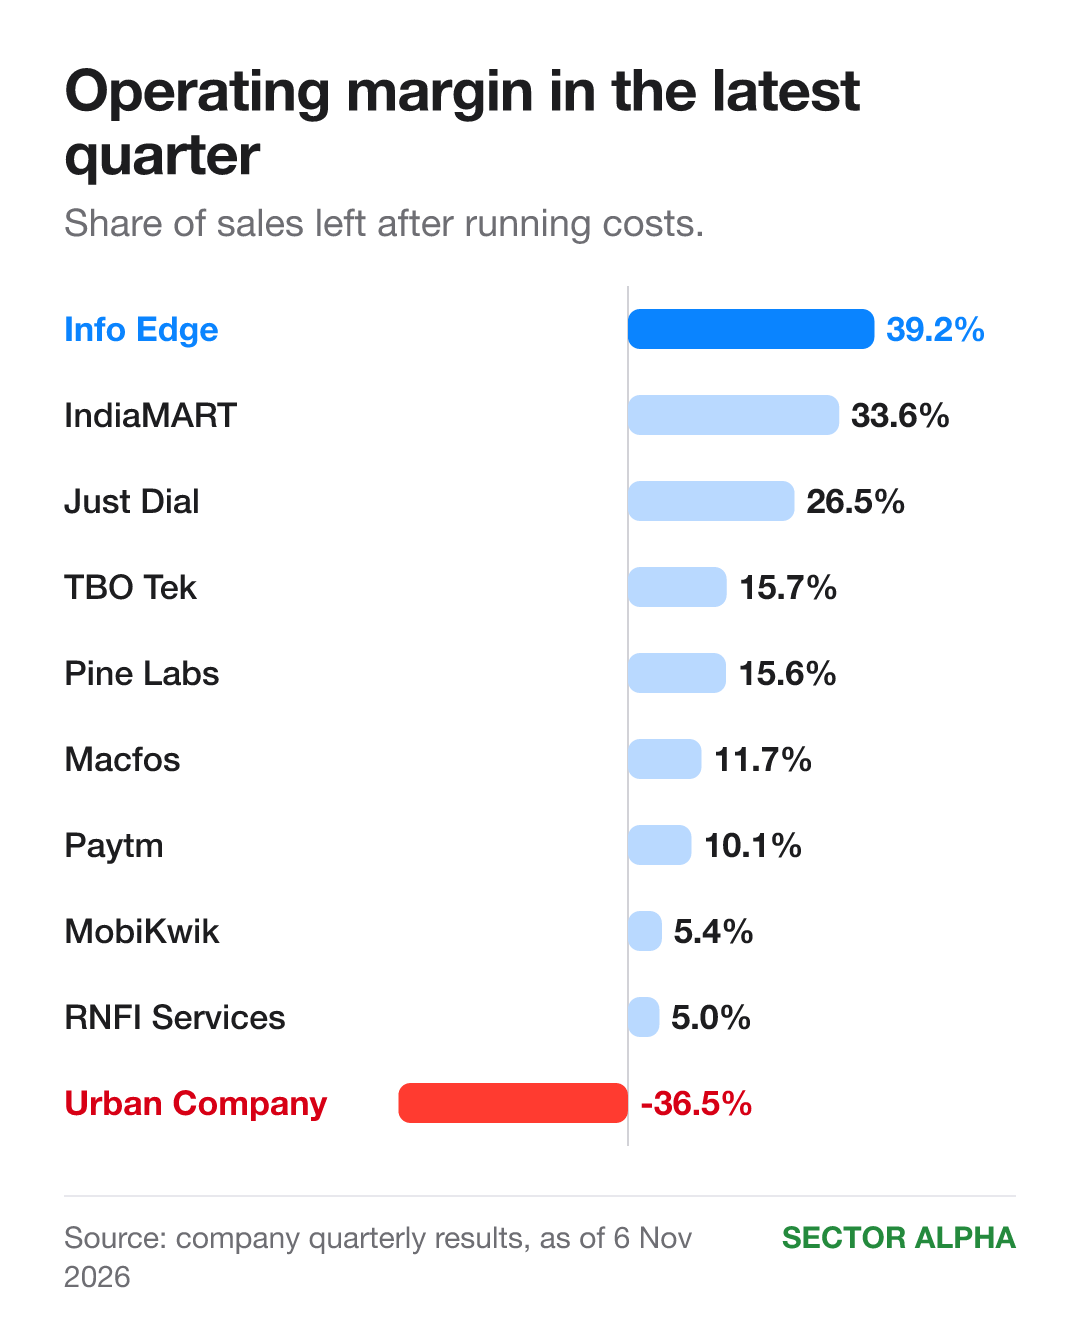
Margin (share of sales left after running costs) up on a year ago: 7 of 10. Down at Urban Company, RNFI and Just Dial.
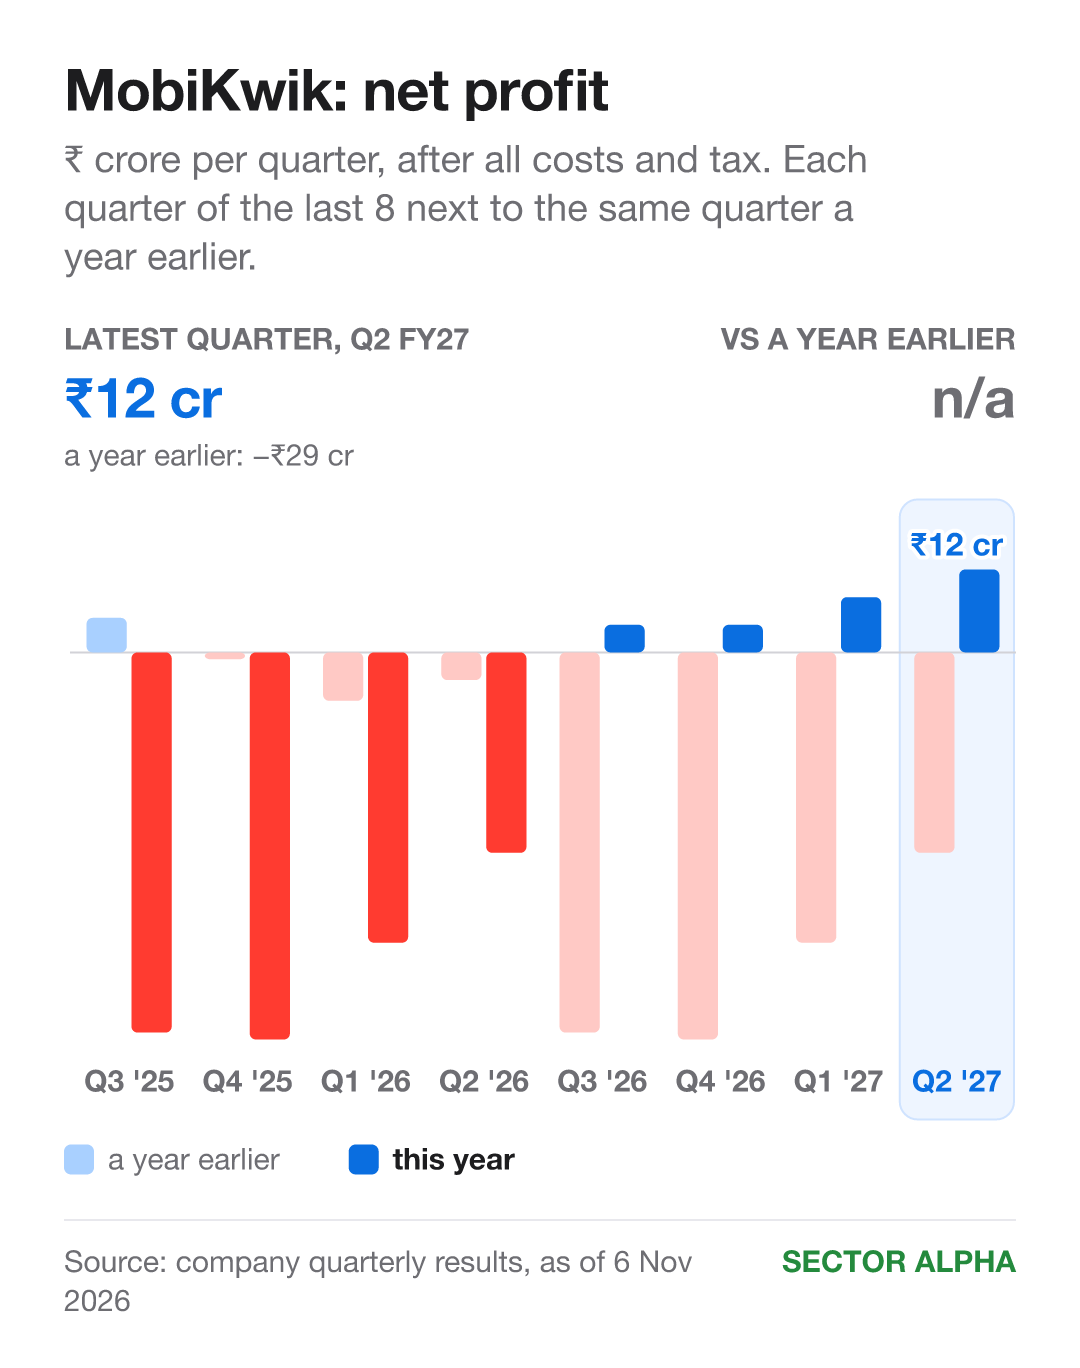
Net profit up on a year ago: 8 of 10. MobiKwik turned a ₹29 crore loss into a ₹12 crore profit. Down at Urban Company (bigger loss) and Just Dial.
Why is this happening
Four themes came up again and again on the calls.
Artificial intelligence tools: Info Edge’s AI recruiting products earn at a pace of about ₹240 crore a year, based on Q2. (Info Edge, Paytm, IndiaMART, Urban Company)
Customer demand: Urban Company had almost 10 million customers who used it in the past year. (Urban Company, Paytm, Info Edge)
Costs of expansion: Urban Company spent ₹174 crore on InstaHelp in Q2. (Urban Company, Info Edge)
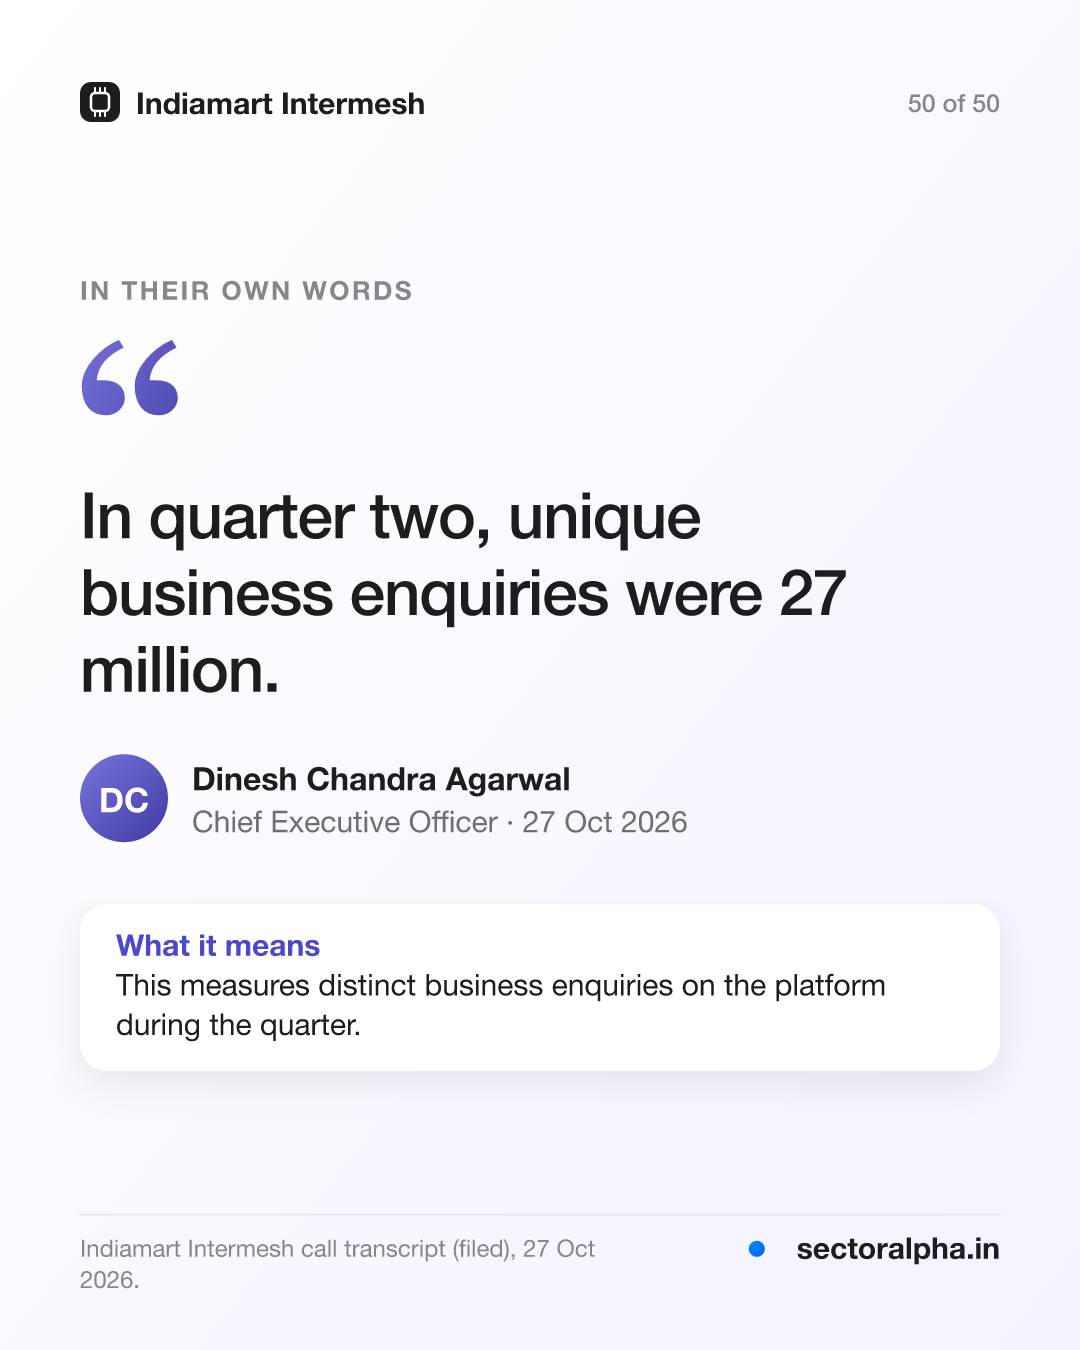
Customer retention: IndiaMART lost a net 615 paying suppliers in Q2, mainly Silver-plan subscribers leaving. (IndiaMART, Info Edge)
Company by company
Paytm (Q2 FY27)
Paytm brings small shops onto its payments app, then sells them loans and other money services.
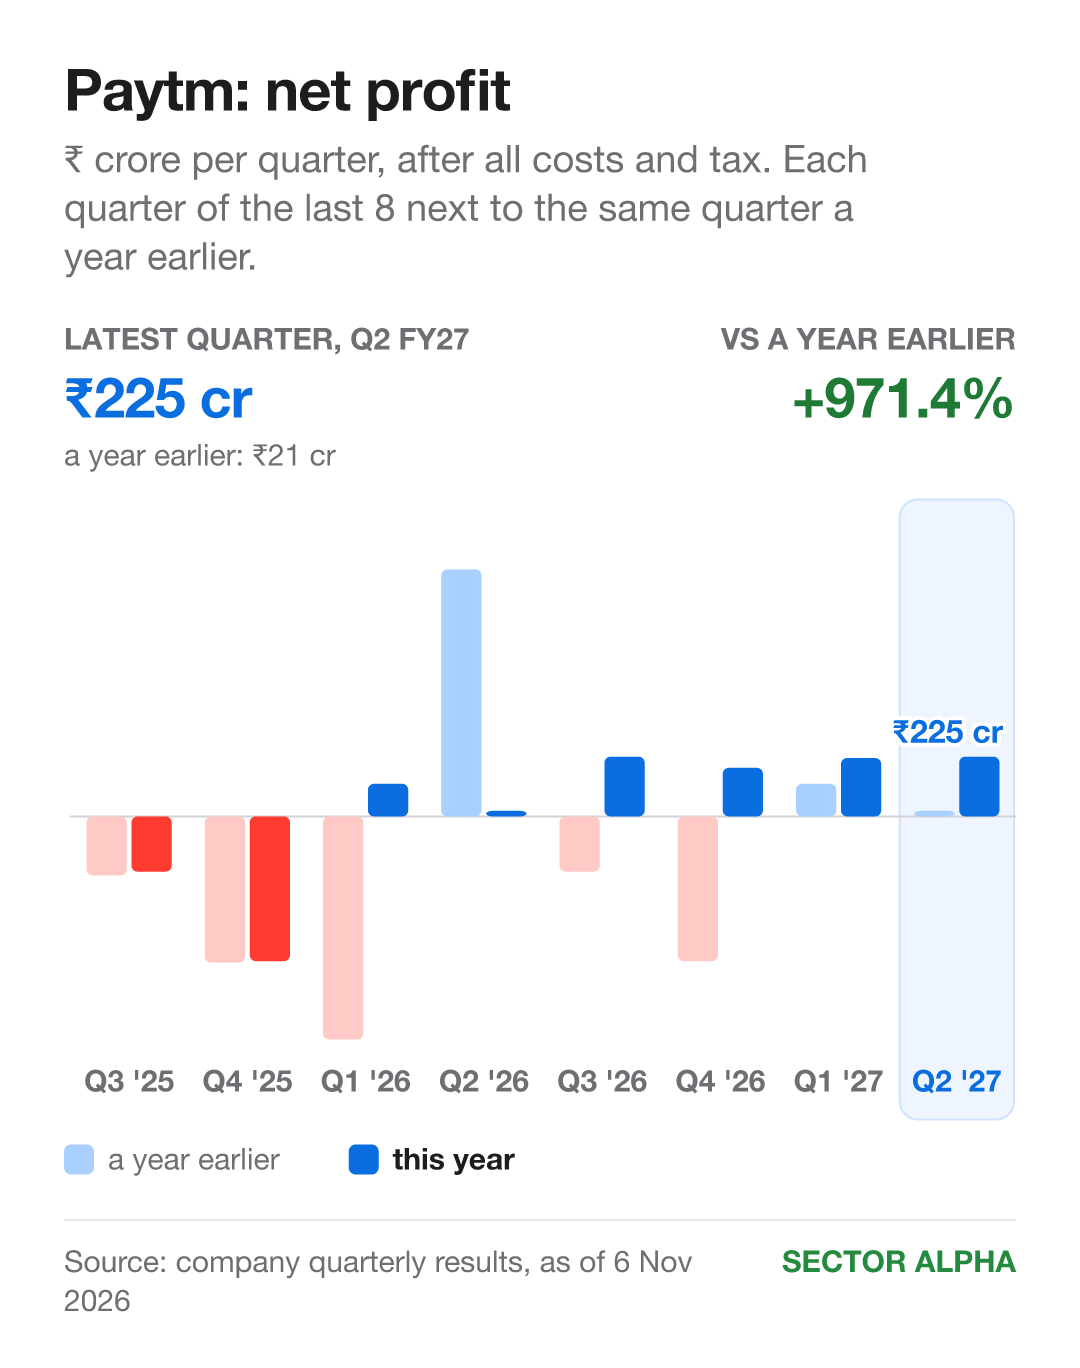
Other income: ₹178 crore, set against ₹225 crore of profit.
Share price, last 3 months: up 24.4%, the best of the ten.
Each quarter vs a year earlier
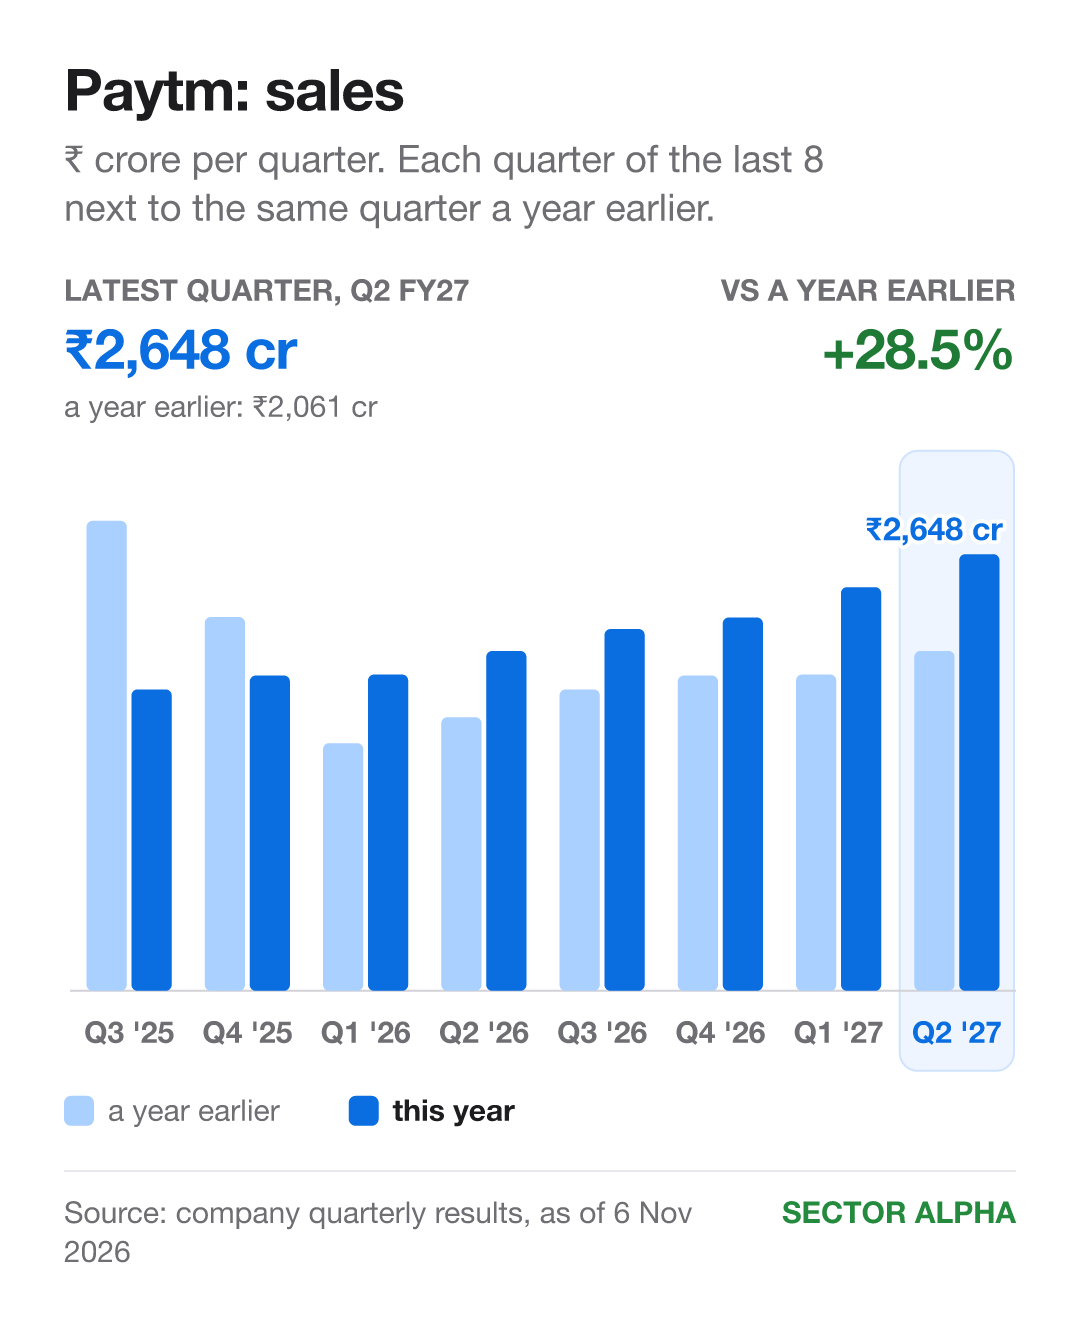
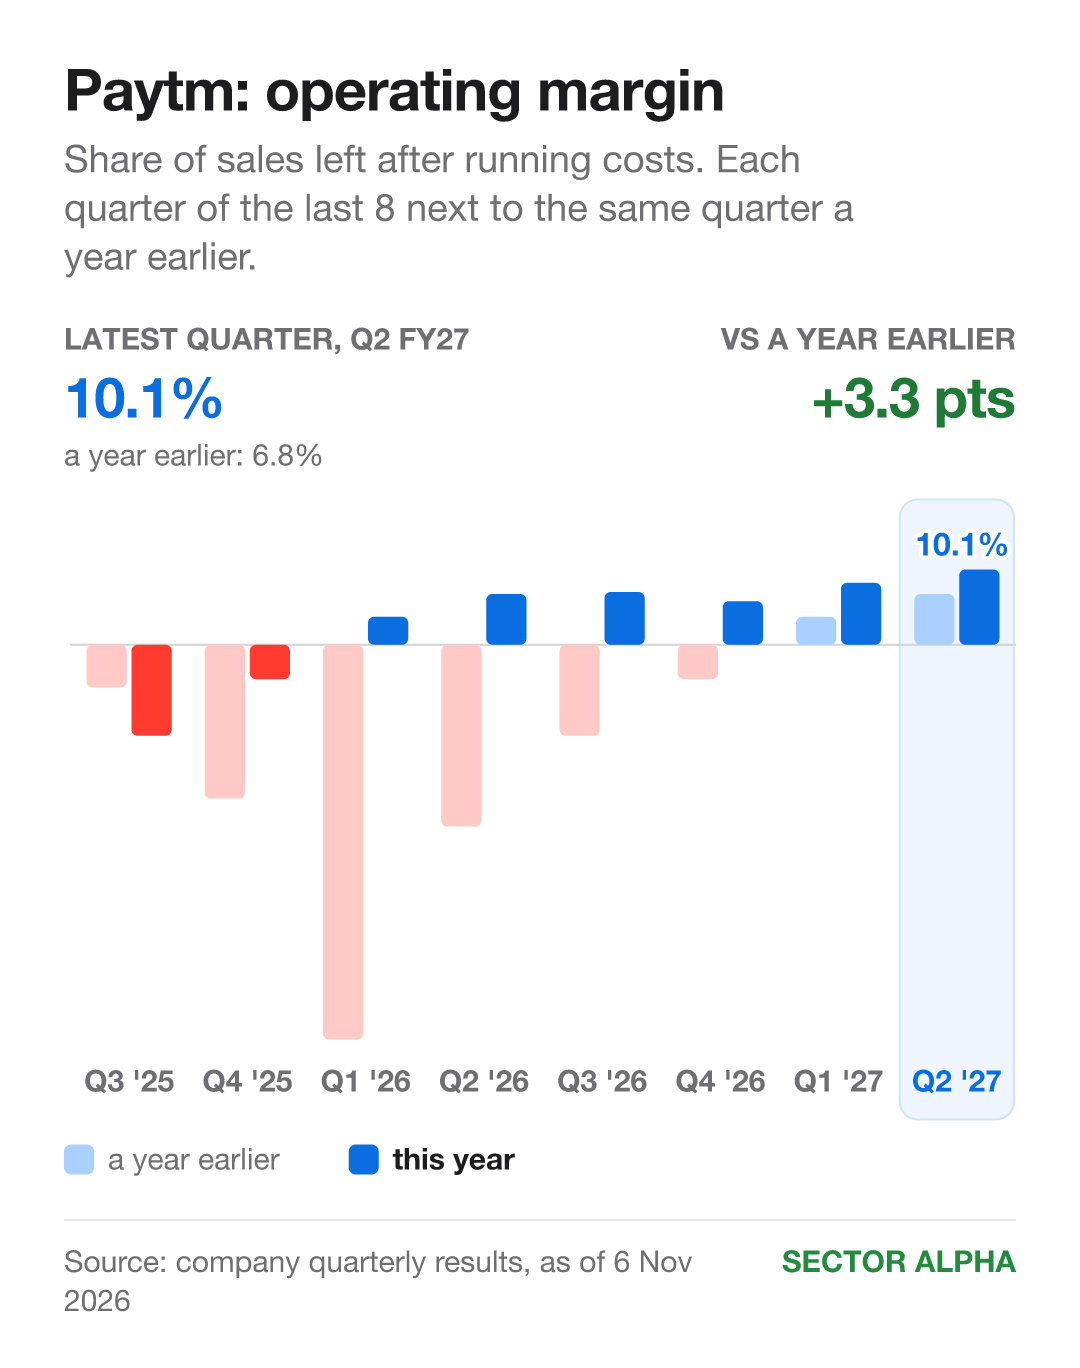
Sales: ₹2,061 cr → ₹2,648 cr. Up 28.5%. Higher in 6 of the last 8 quarters. Margin: 6.8% → 10.1%. Up 3.3 points. Higher in 7 of 8. Net profit: ₹21 cr → ₹225 cr. Higher in 7 of 8.
Why payment margin rose: Paytm let go of a large customer that lost it money on each payment, and held firm on its prices.
Price, earnings and P/E
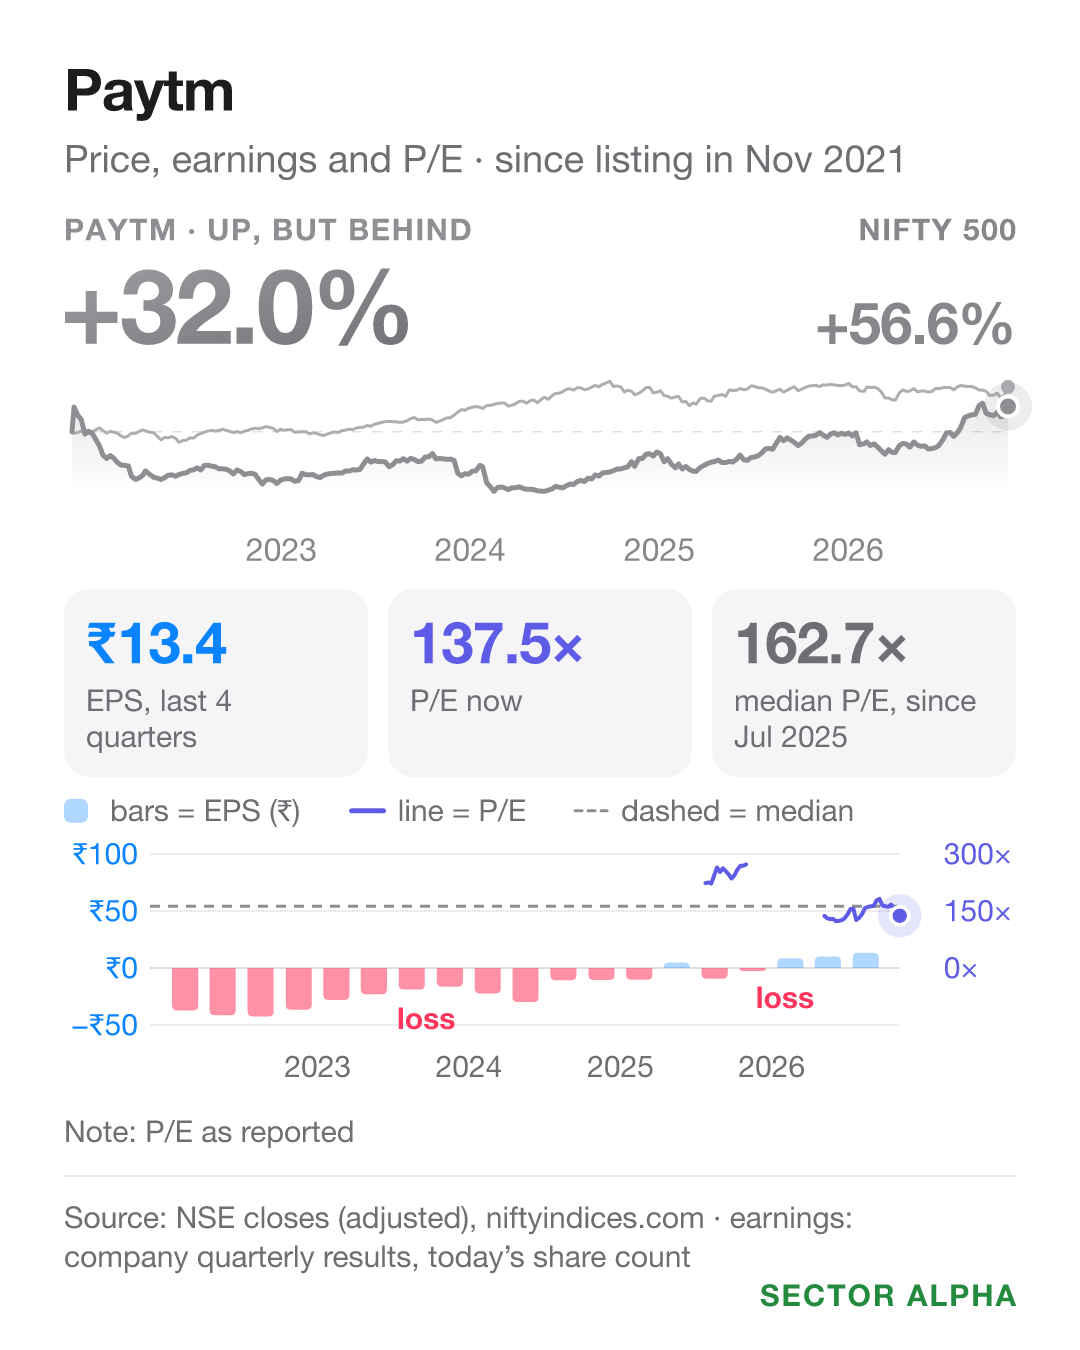
Earnings per share, last 4 quarters: loss of ₹9.5 → profit of ₹13.4. Share price, same year: up 36%.
A year ago there was no P/E (price ÷ earnings per share): earnings were a loss. P/E on 6 Nov 2026: 137.5.
What led to it
Sales growth: 28%, two quarters in a row, management said.
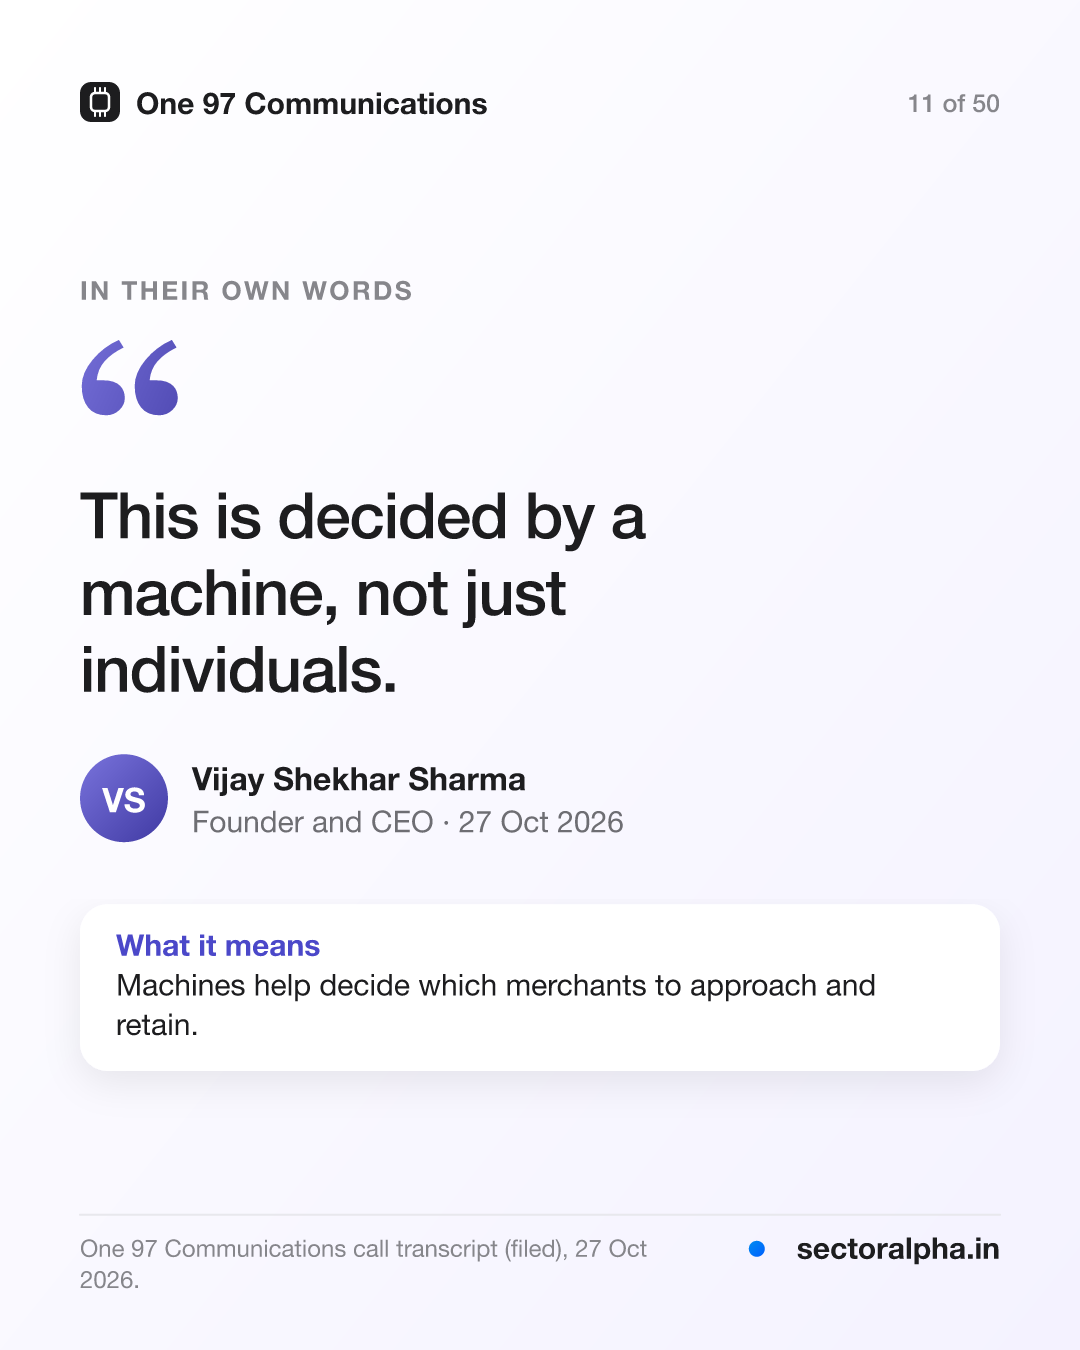
Possible UPI fee: a merchant fee on UPI payments could add 2.5 basis points (0.025%) to Paytm’s payment margin. The start date is not set yet.
Urban Company (Q2 FY27)
Urban Company sends trained workers to homes for cleaning, repairs and beauty.
Why the loss grew: ₹174 crore spent on InstaHelp, its new on-demand house-help service.
Share price, last 3 months: up 10.8%.
Each quarter vs a year earlier
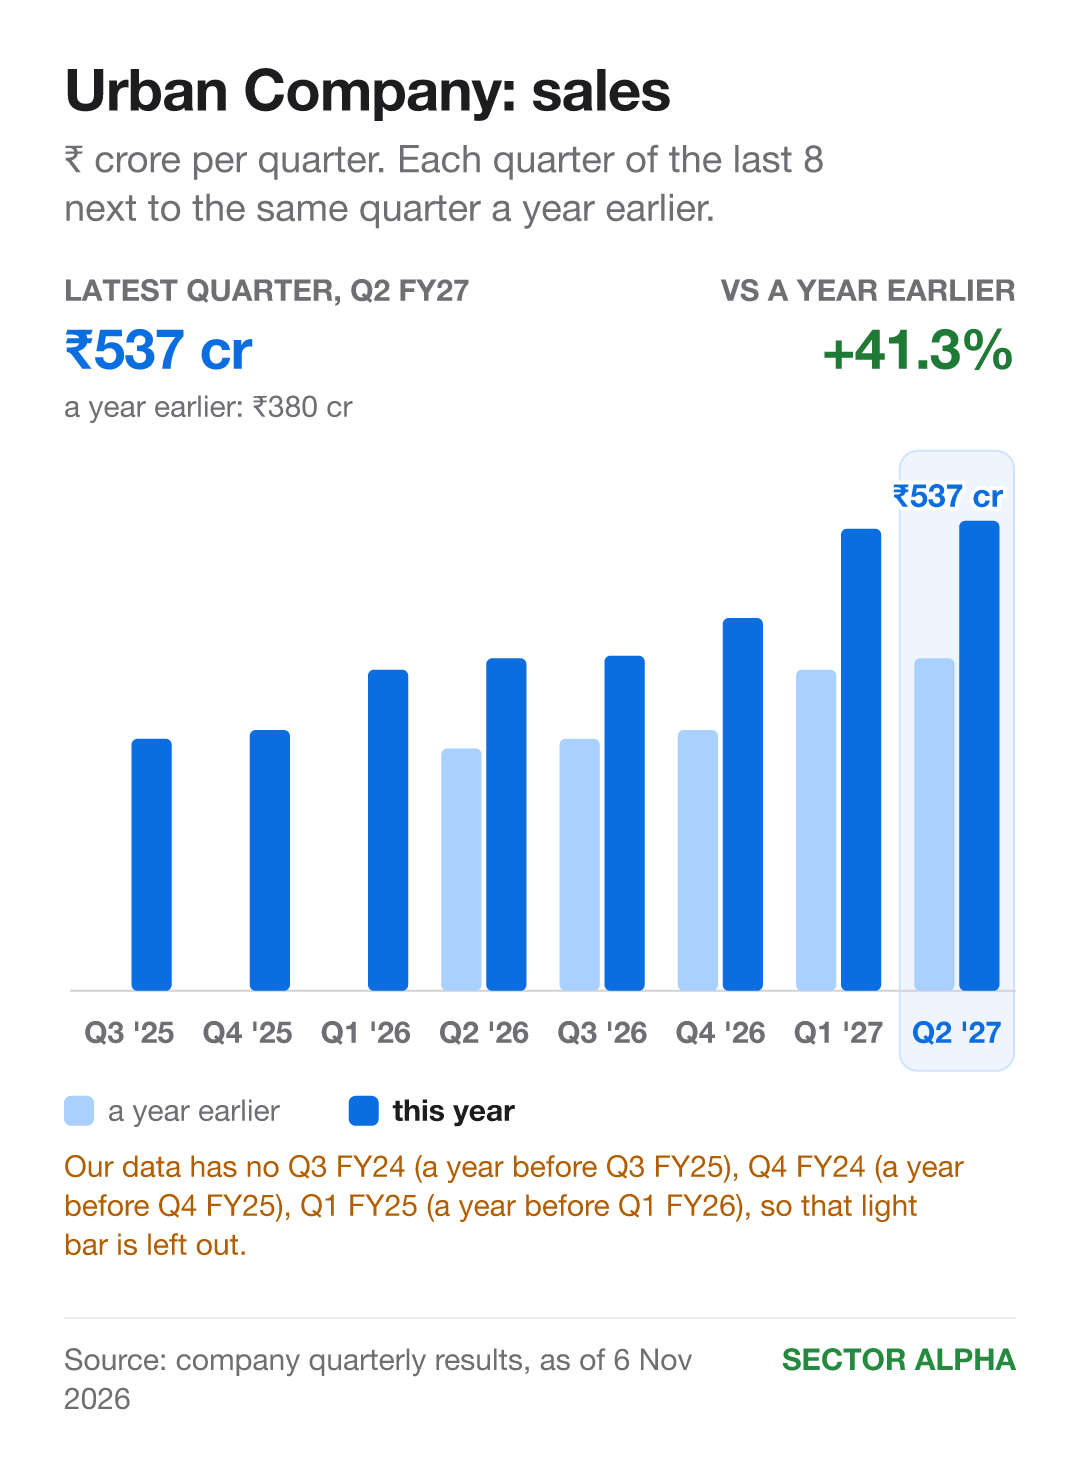
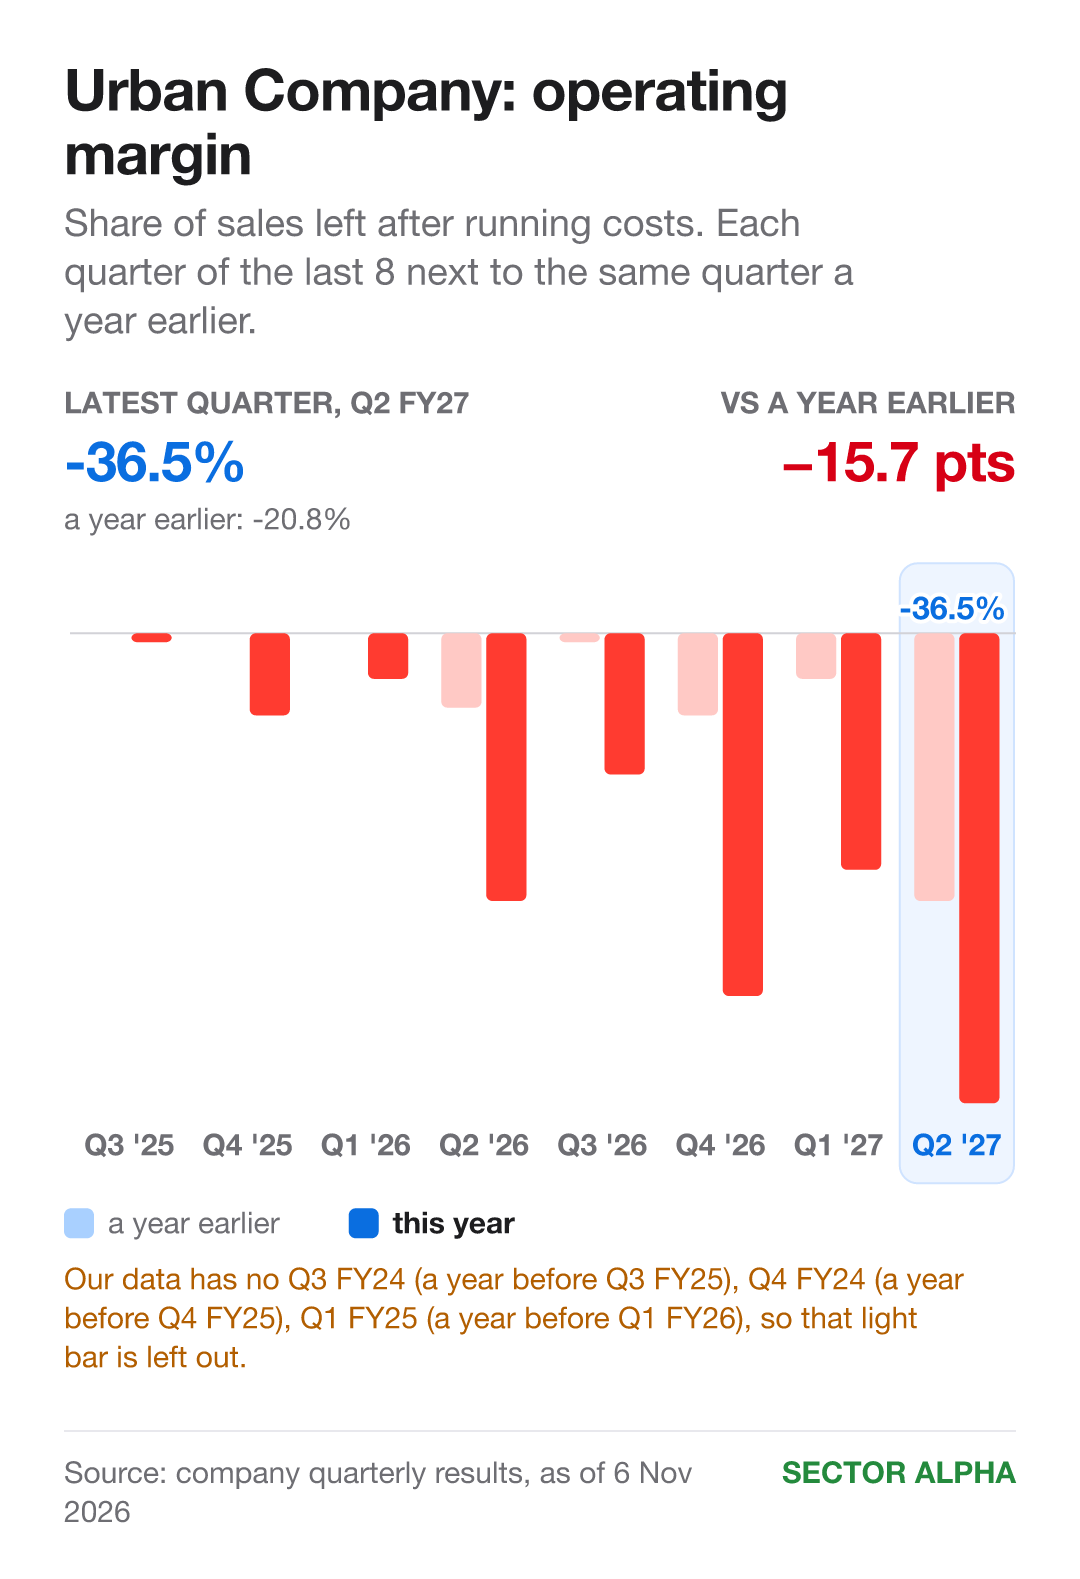
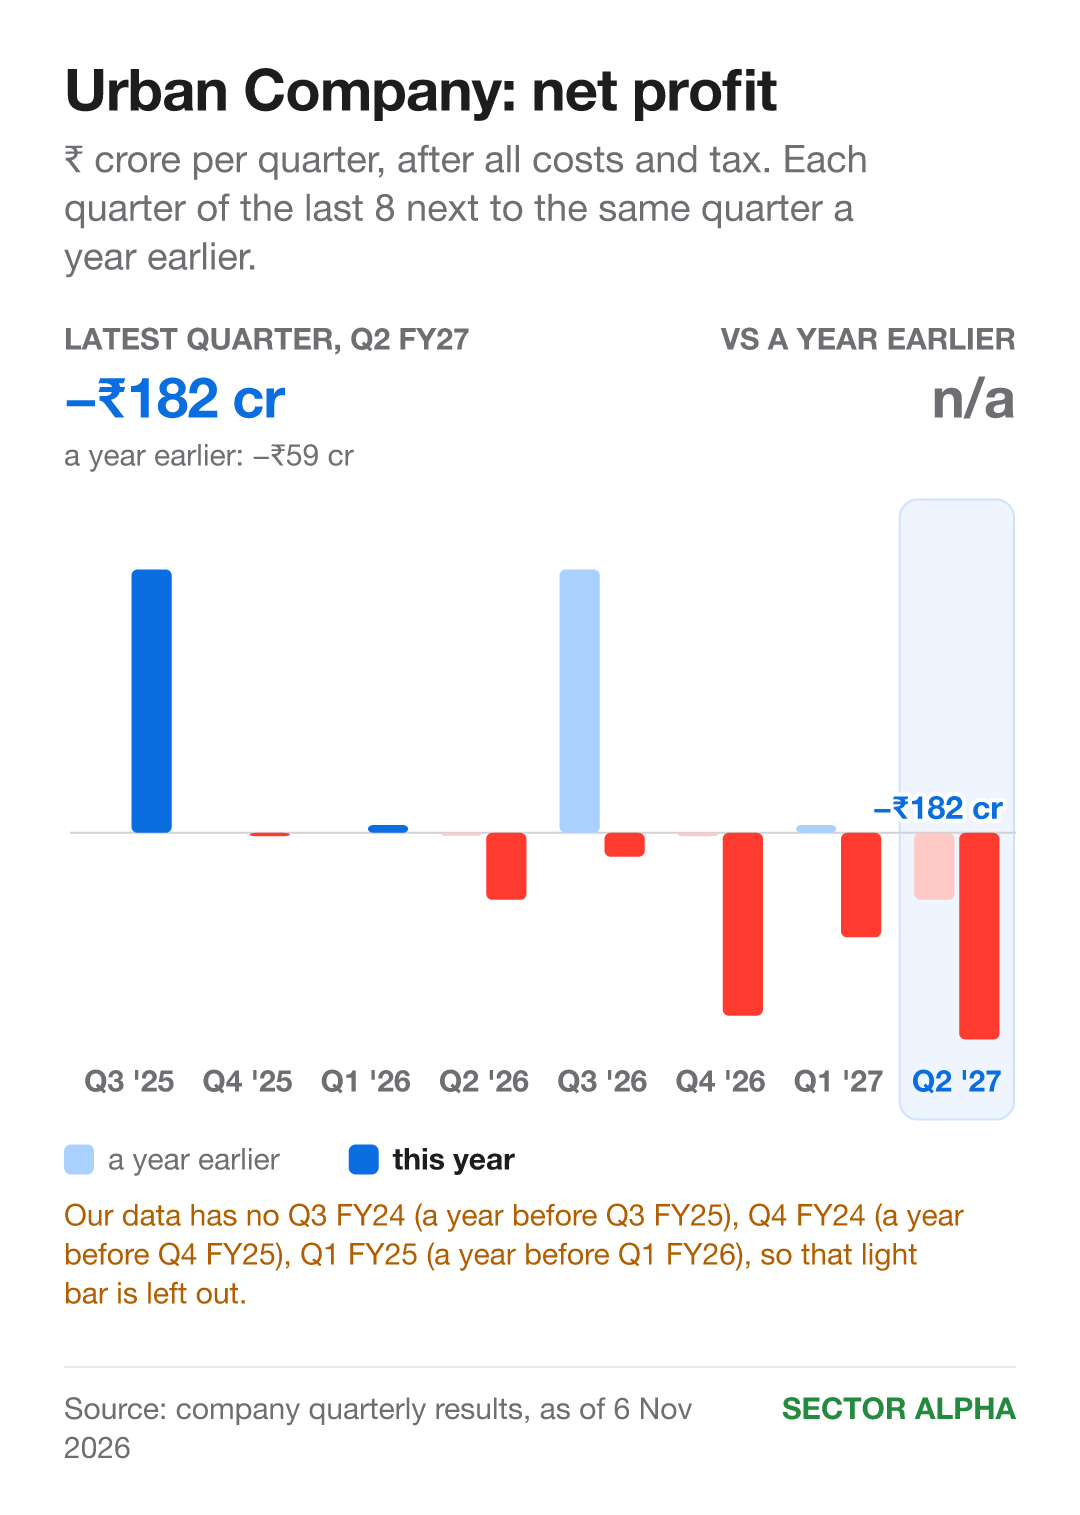
Sales: ₹380 cr → ₹537 cr. Up 41.3%. Higher in 5 of 5 quarters. Margin: -20.8% → -36.5%. Down 15.7 points. Lower in all 5. Net profit: loss of ₹59 cr → loss of ₹182 cr. Worse in all 5.
Only 5 quarters, because year-earlier figures are missing for Q3 FY24, Q4 FY24 and Q1 FY25.
Why it matters: without InstaHelp, the rest of the business made ₹30 crore of operating profit by the company’s own measure, management said.
Price, earnings and P/E
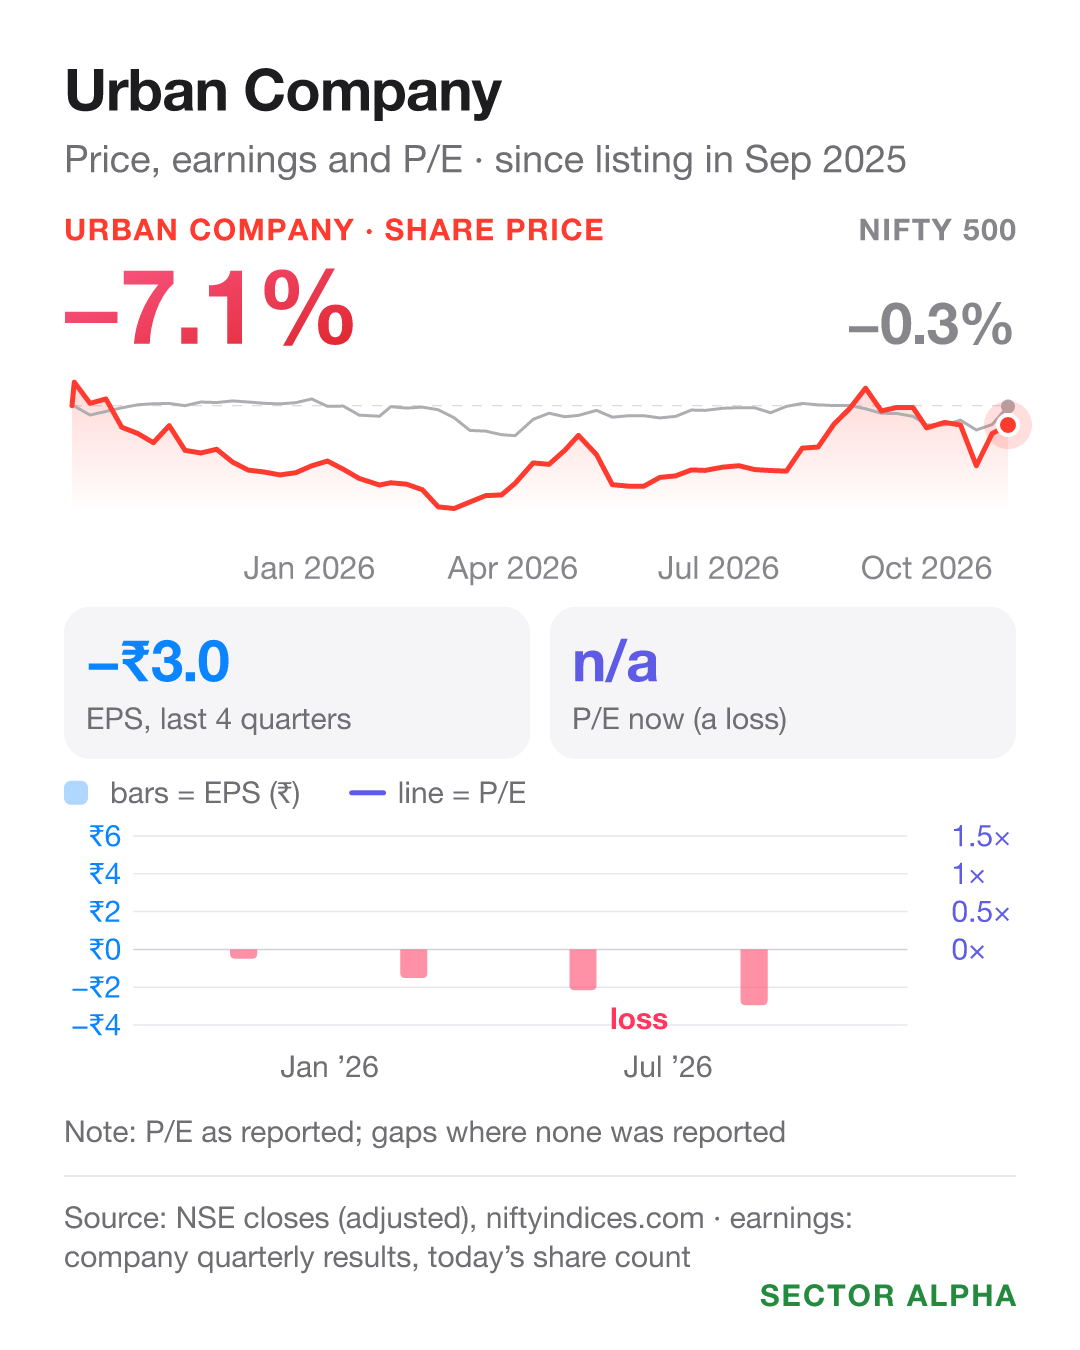
Earnings per share, last 4 quarters: profit of ₹1.1 → loss of ₹3. Share price, same year: up 10%.
No P/E (price ÷ earnings per share) on 6 Nov 2026: earnings are a loss.
What led to it
Home services in India: up 26.3% on a year ago.
Outside India: up 66.2% on a year ago.
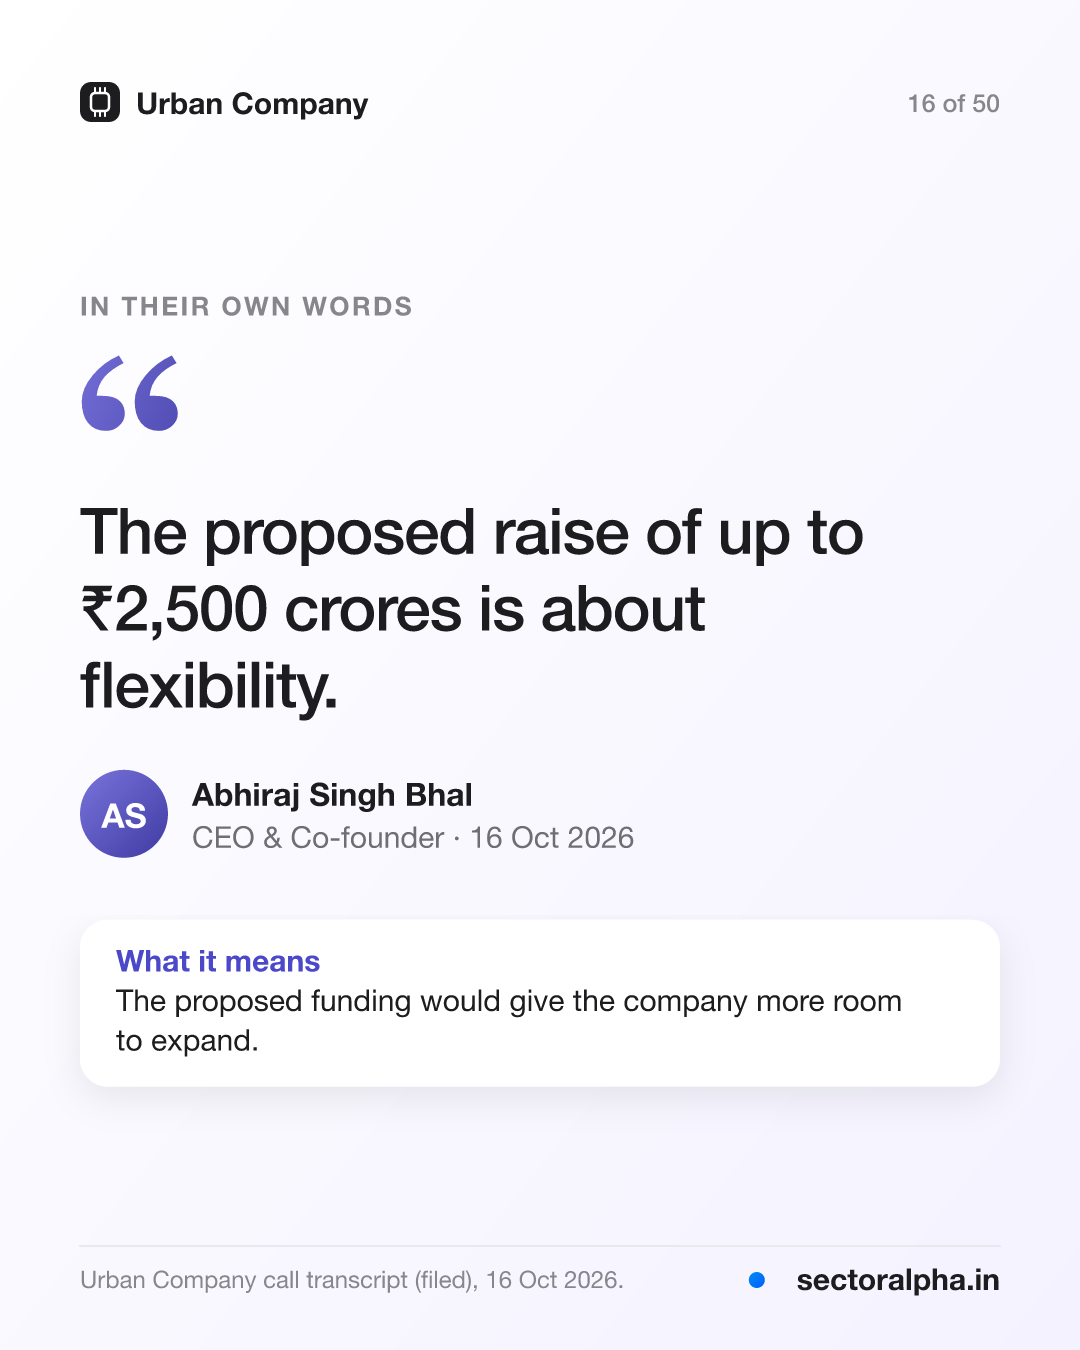
Changed plan: in May, management said it was well placed to fund InstaHelp’s growth. In October, it proposed raising up to ₹2,500 crore.
RNFI Services (Q2 FY27)
RNFI sells digital money services through its website and app, to businesses and their customers.
Share price, last 3 months: up 13.9%.
Each quarter vs a year earlier
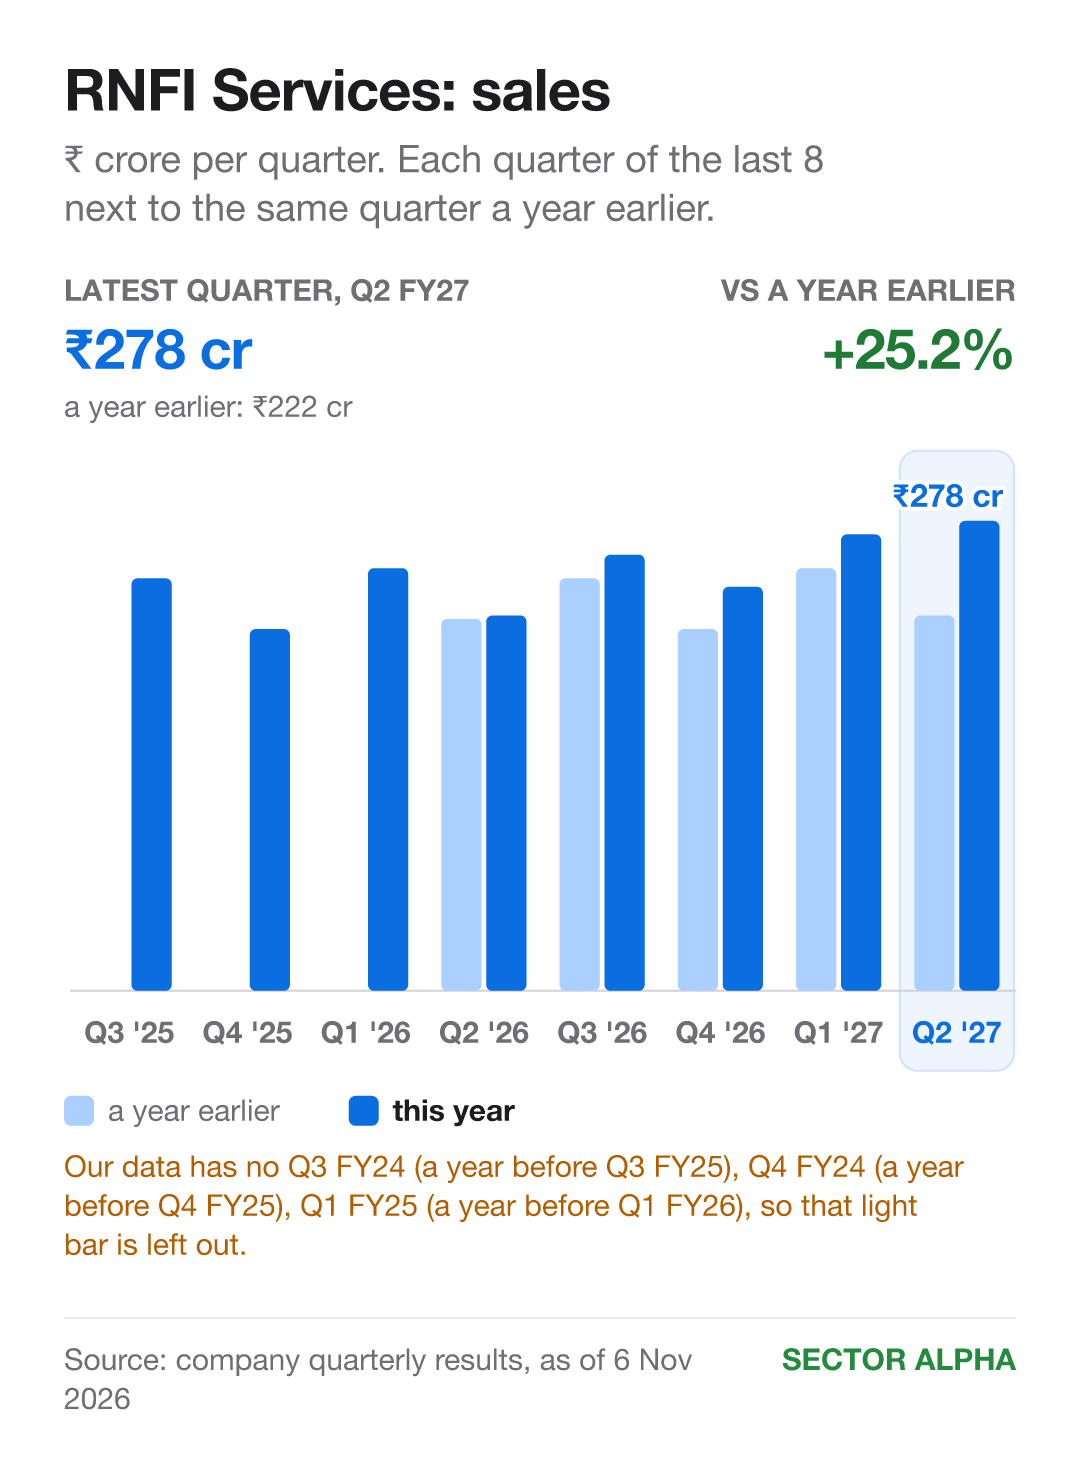
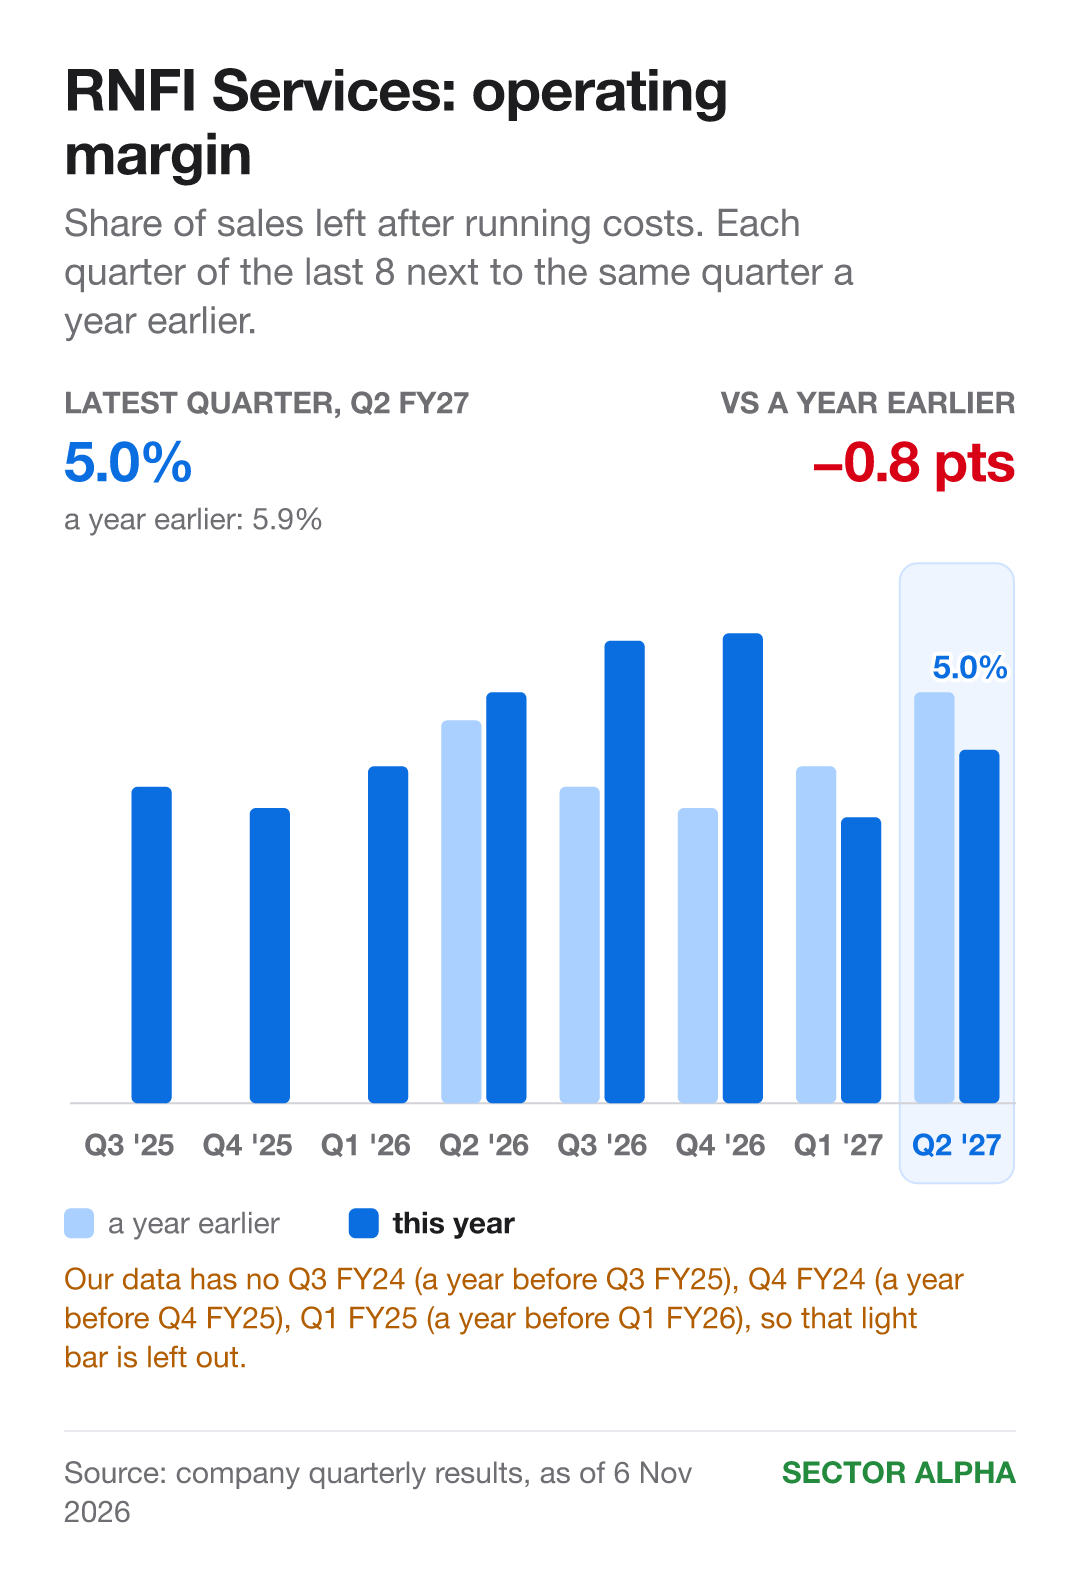
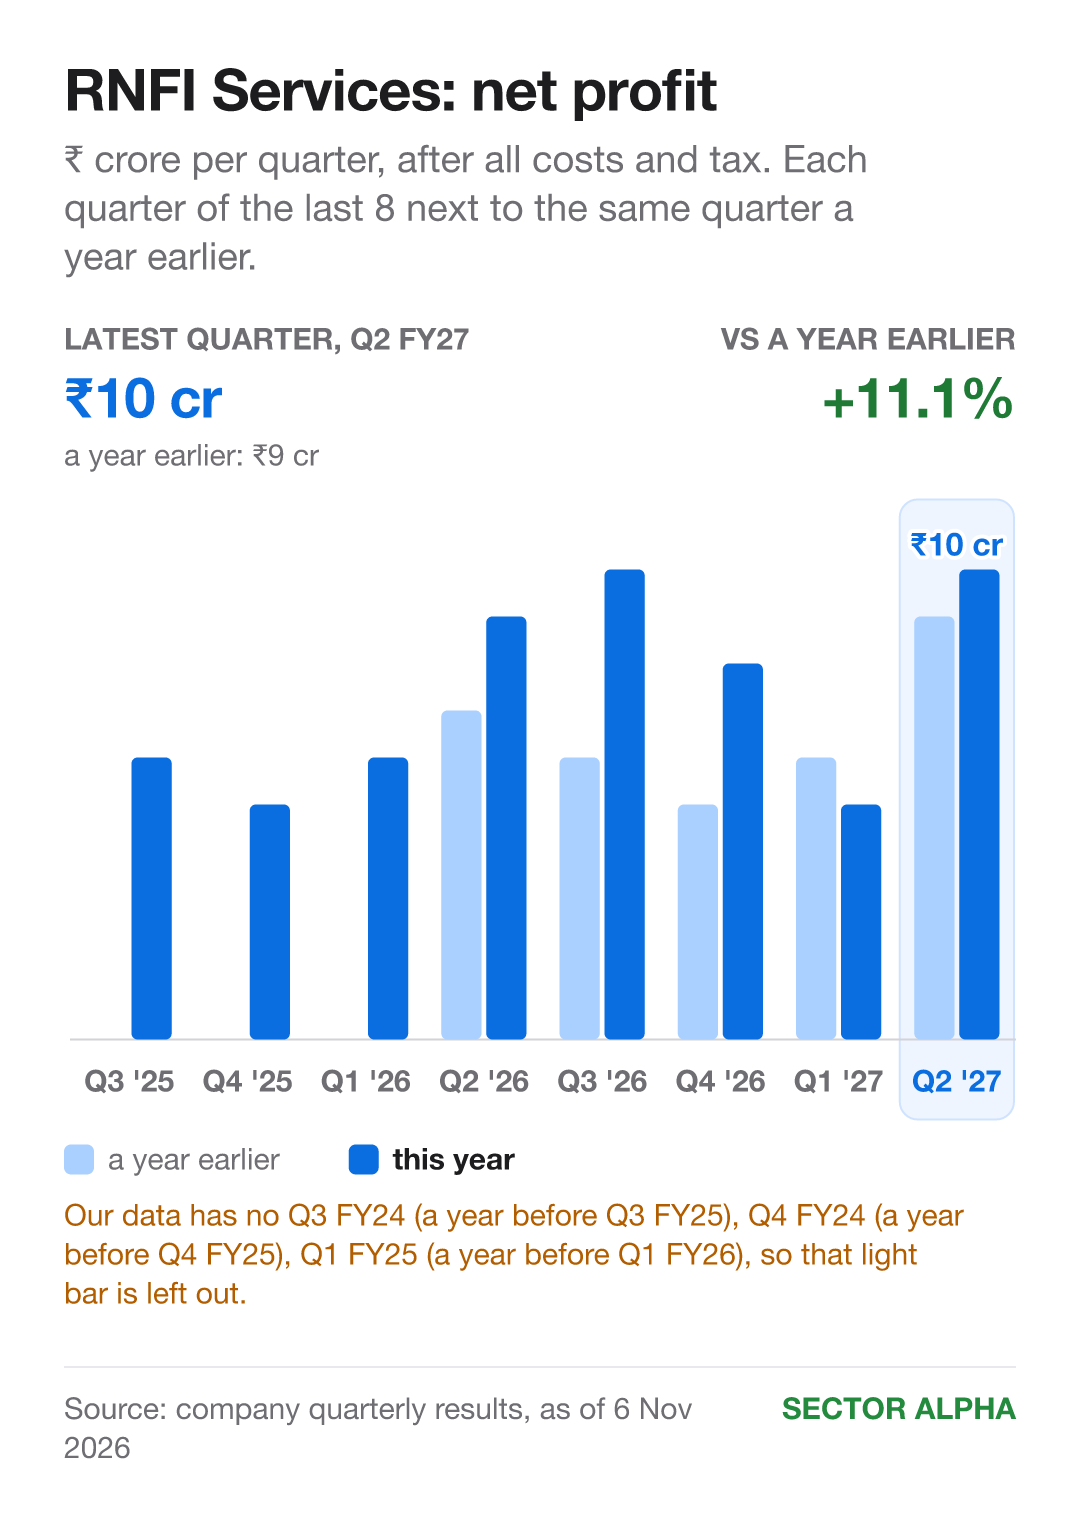
Sales: ₹222 cr → ₹278 cr. Up 25.2%. Higher in 5 of 5 quarters. Margin: 5.9% → 5%. Down slightly. Higher in 3 of 5. Net profit: ₹9 cr → ₹10 cr. Up 11.1%. Higher in 4 of 5.
Only 5 quarters for RNFI, because year-earlier figures are missing for Q3 FY24, Q4 FY24 and Q1 FY25.
Price, earnings and P/E
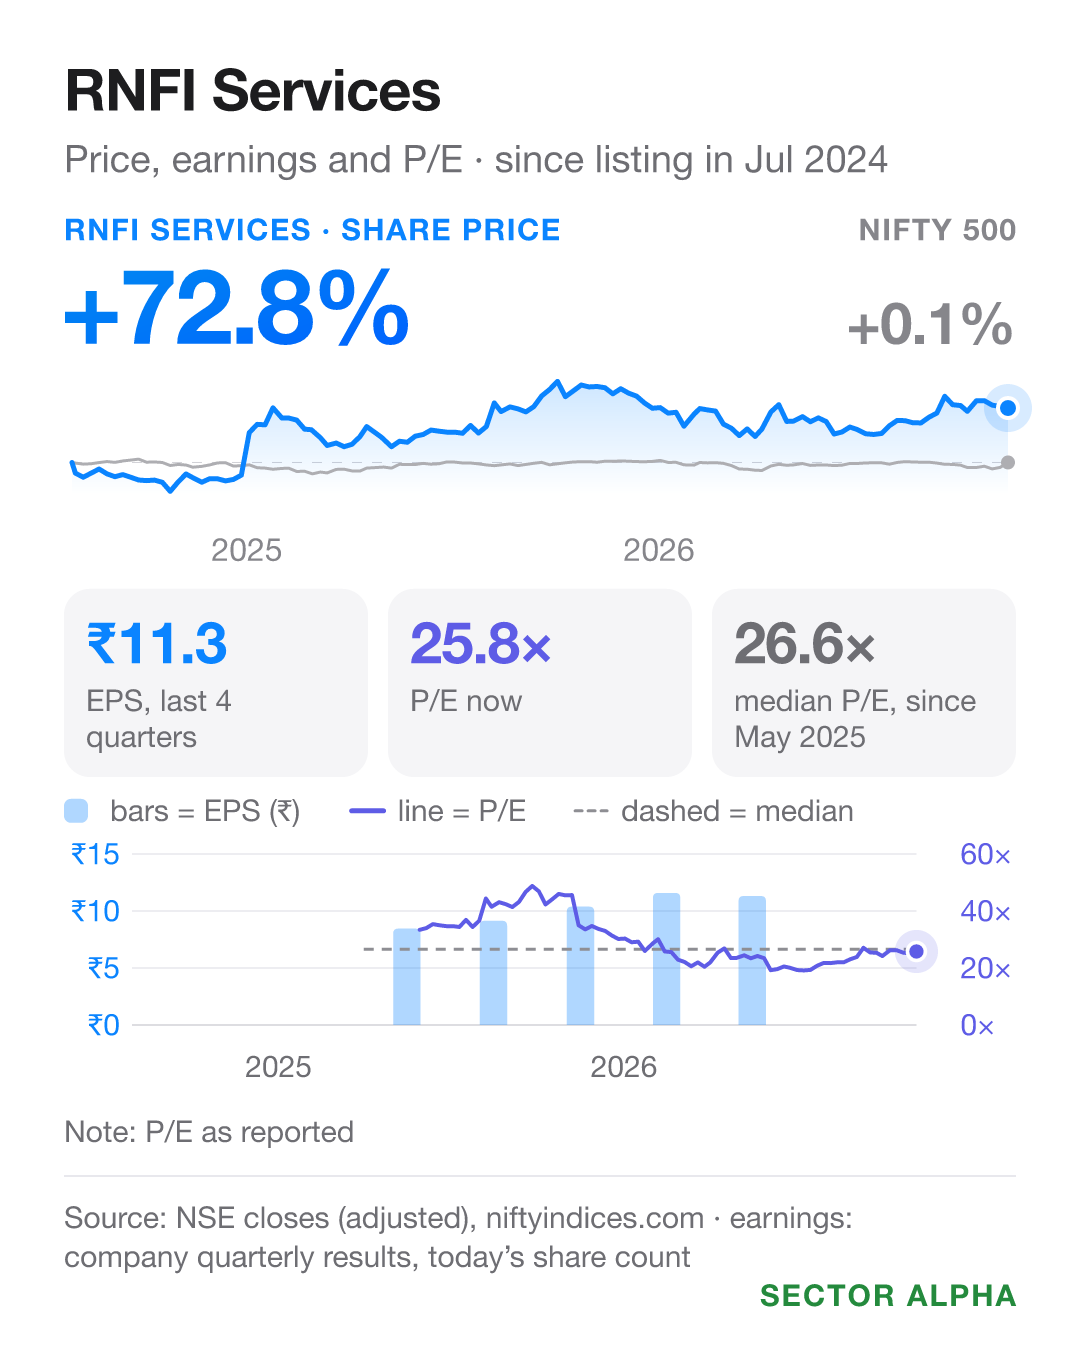
Earnings per share, 4 quarters to June 2026: ₹8.5 → ₹11.3. Up 34%. Share price, past year: down 16%.
Earnings ran ahead of the price. So P/E (price ÷ earnings per share) fell from about 41 to 26 by 6 Nov 2026.
What led to it
No earnings call for Jul to Sep 2026 in my records, so I can’t give management’s reasons. What stands out: other income of ₹5 crore, set against ₹10 crore of profit.
Pine Labs (Q2 FY27)
Pine Labs helps shops take payments at the checkout, and helps them get financing.
Other income: ₹26 crore, set against ₹39 crore of profit.
Each quarter vs a year earlier
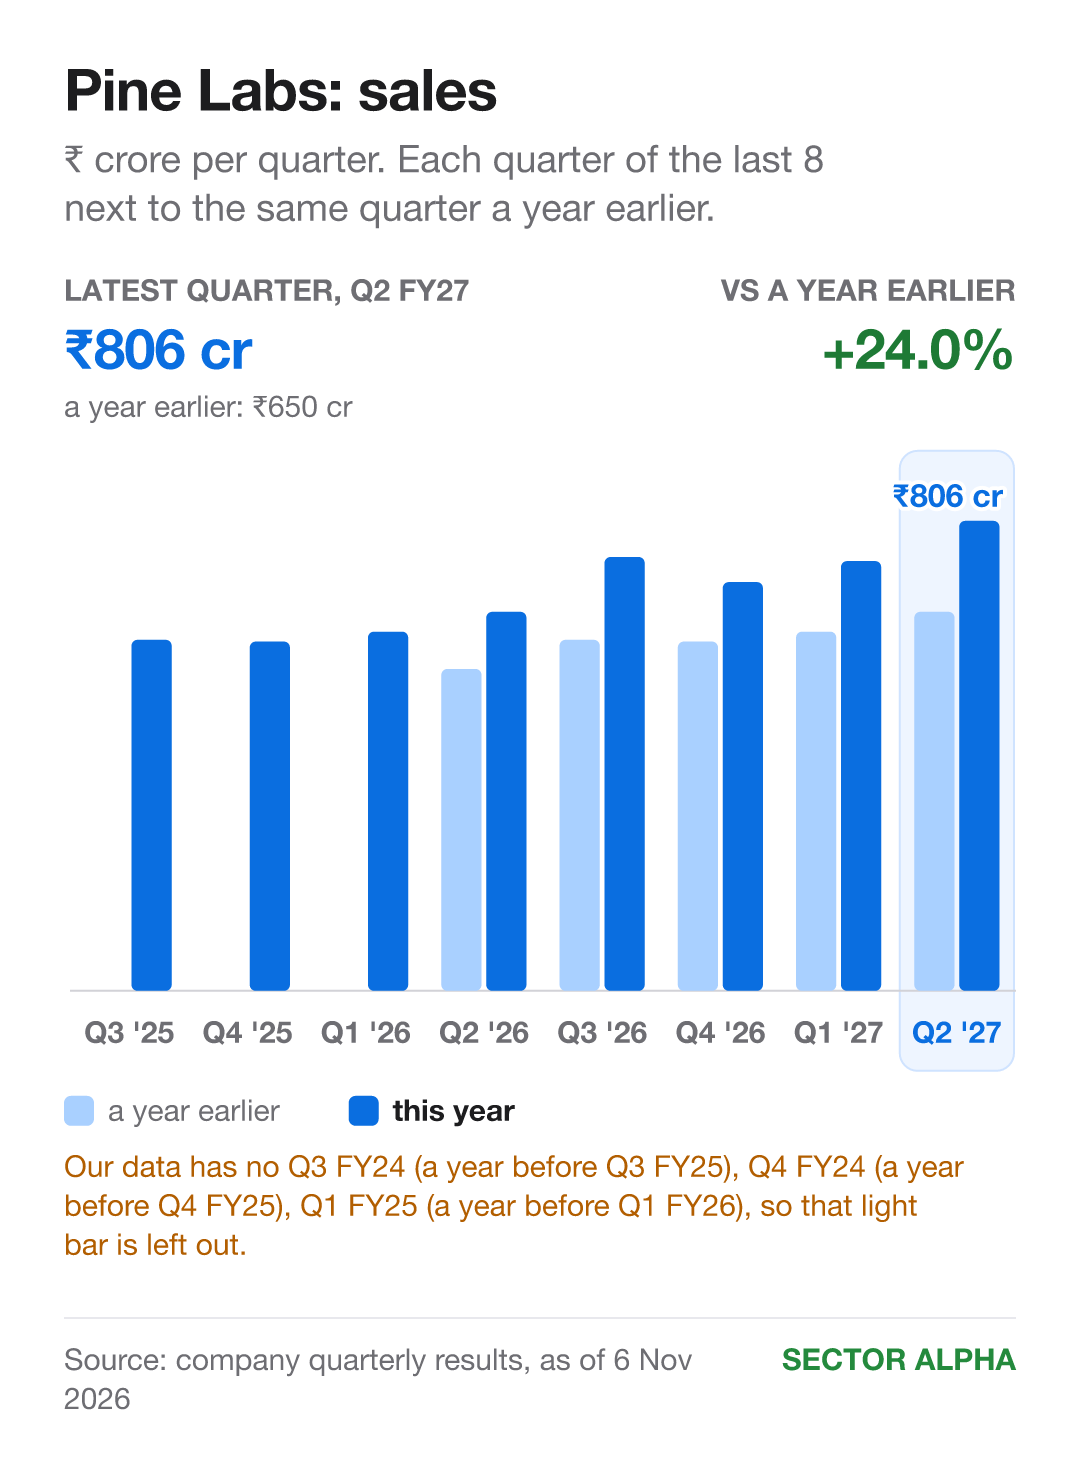
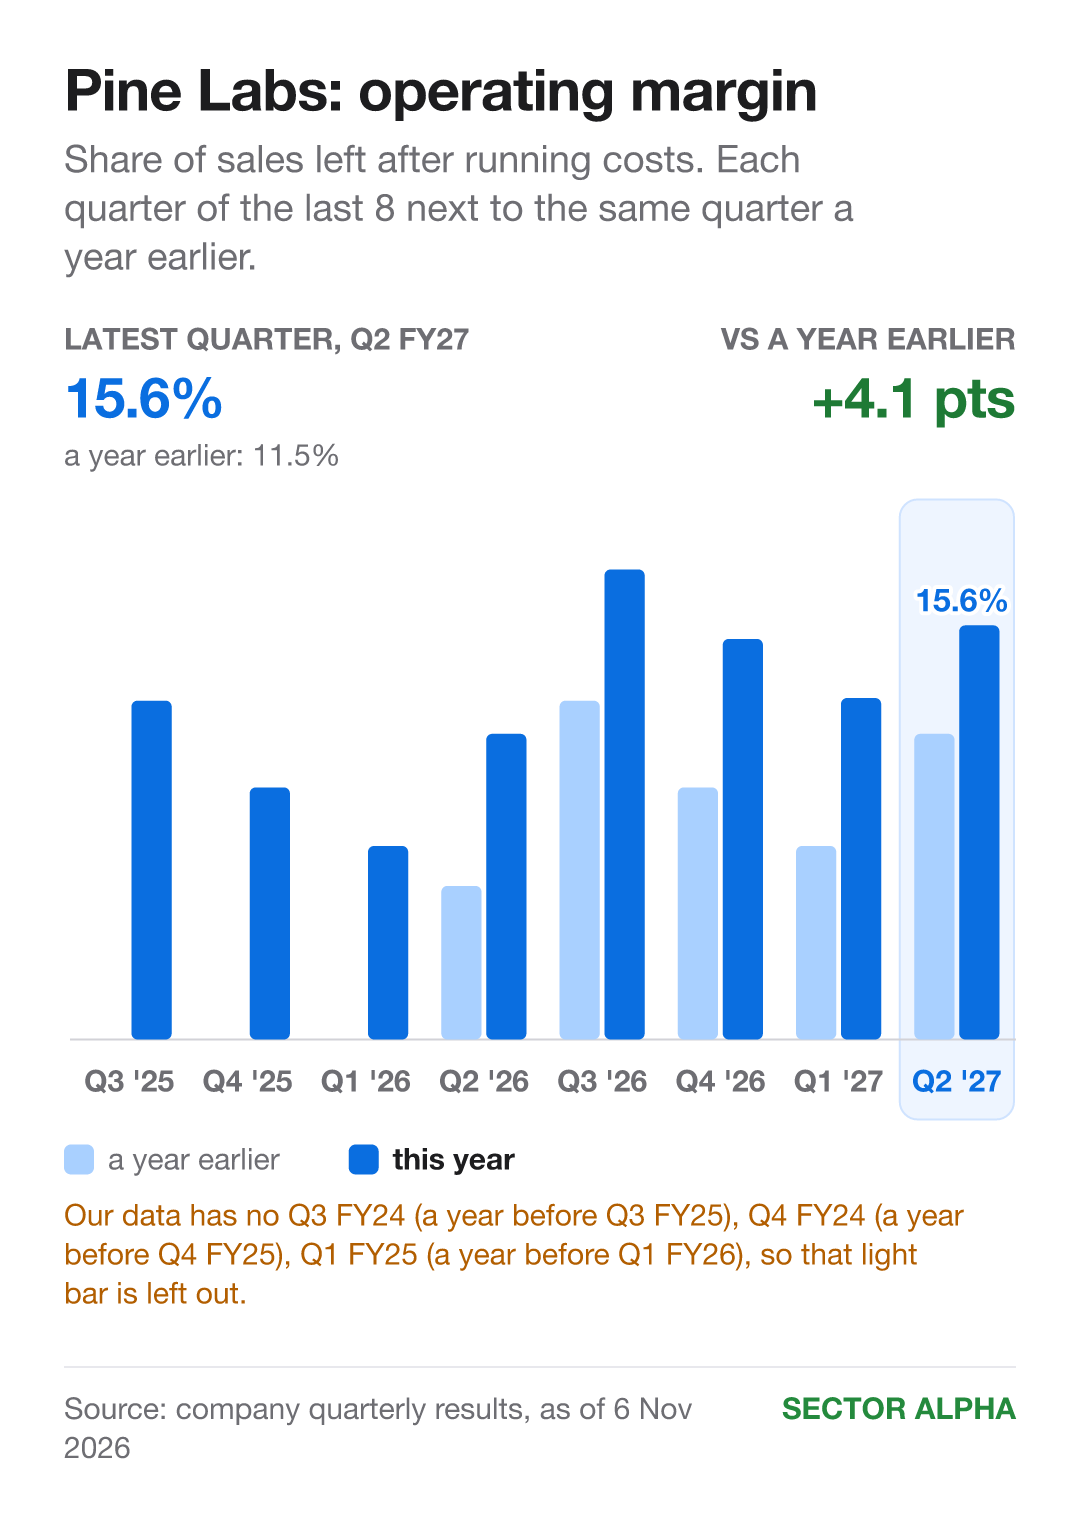
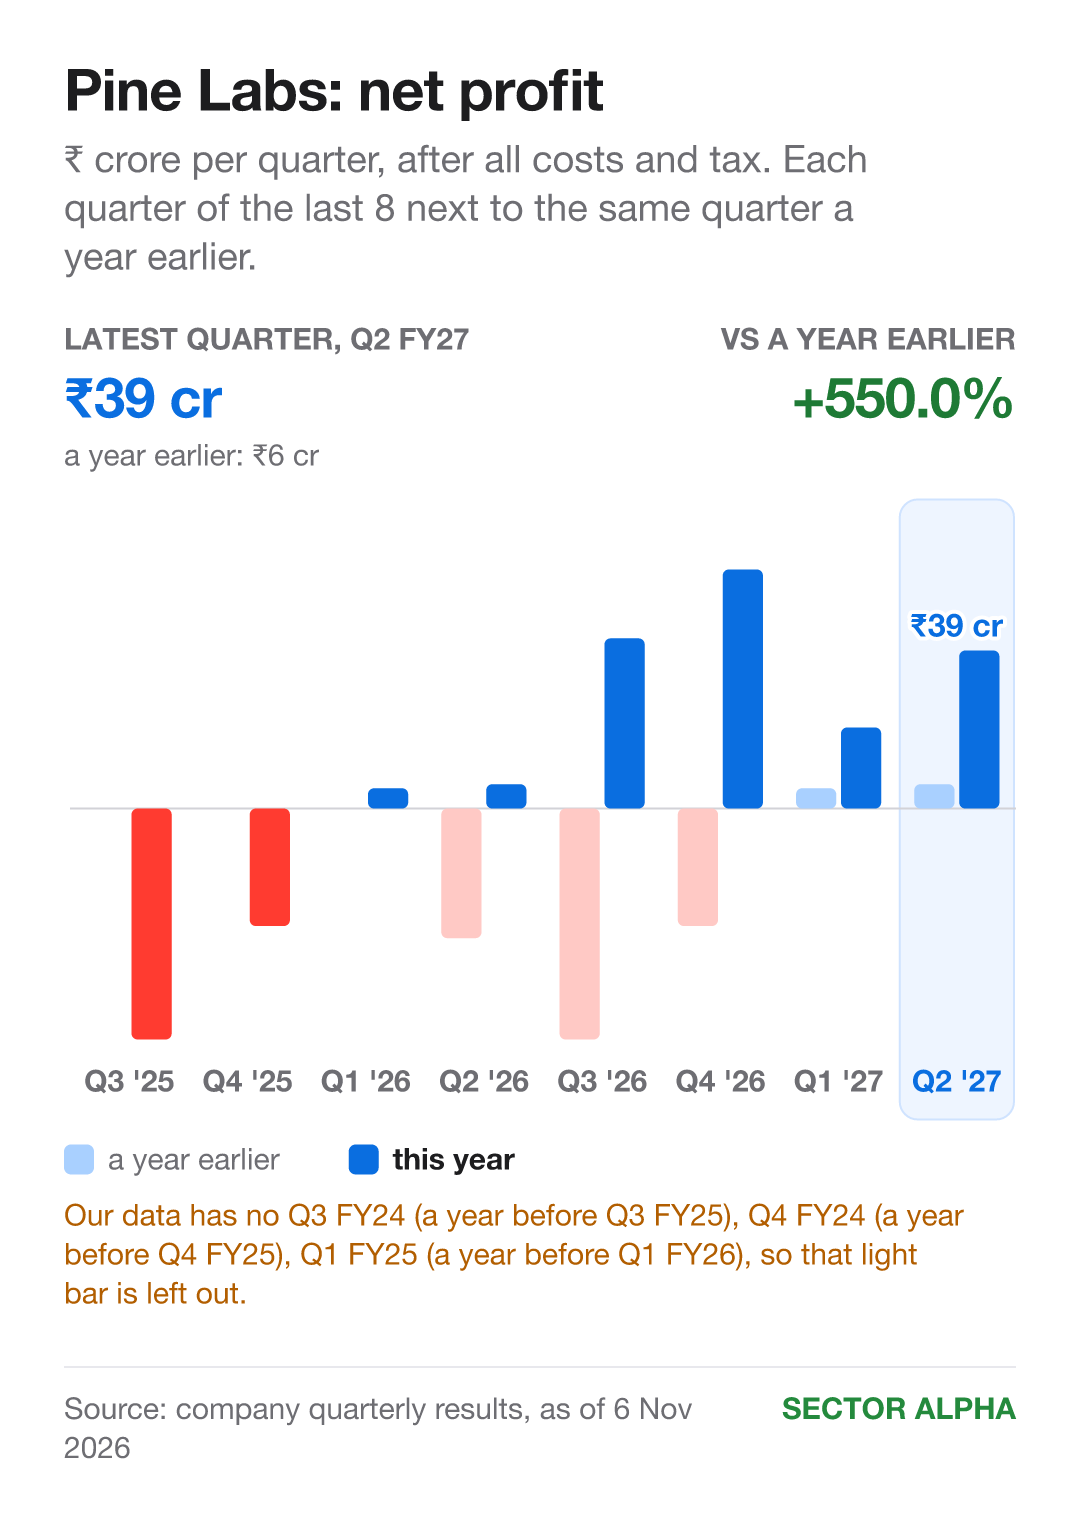
Sales: ₹650 cr → ₹806 cr. Up 24%. Higher in 5 of 5 quarters. Margin: 11.5% → 15.6%. Up 4.1 points. Higher in 5 of 5. Net profit: ₹6 cr → ₹39 cr. Higher in 5 of 5.
Only 5 quarters, because year-earlier figures are missing for Q3 FY24, Q4 FY24 and Q1 FY25.
Why it matters: management raised its full-year sales growth goal to above 23.5%, from 21% to 23.5% before.
Price, earnings and P/E
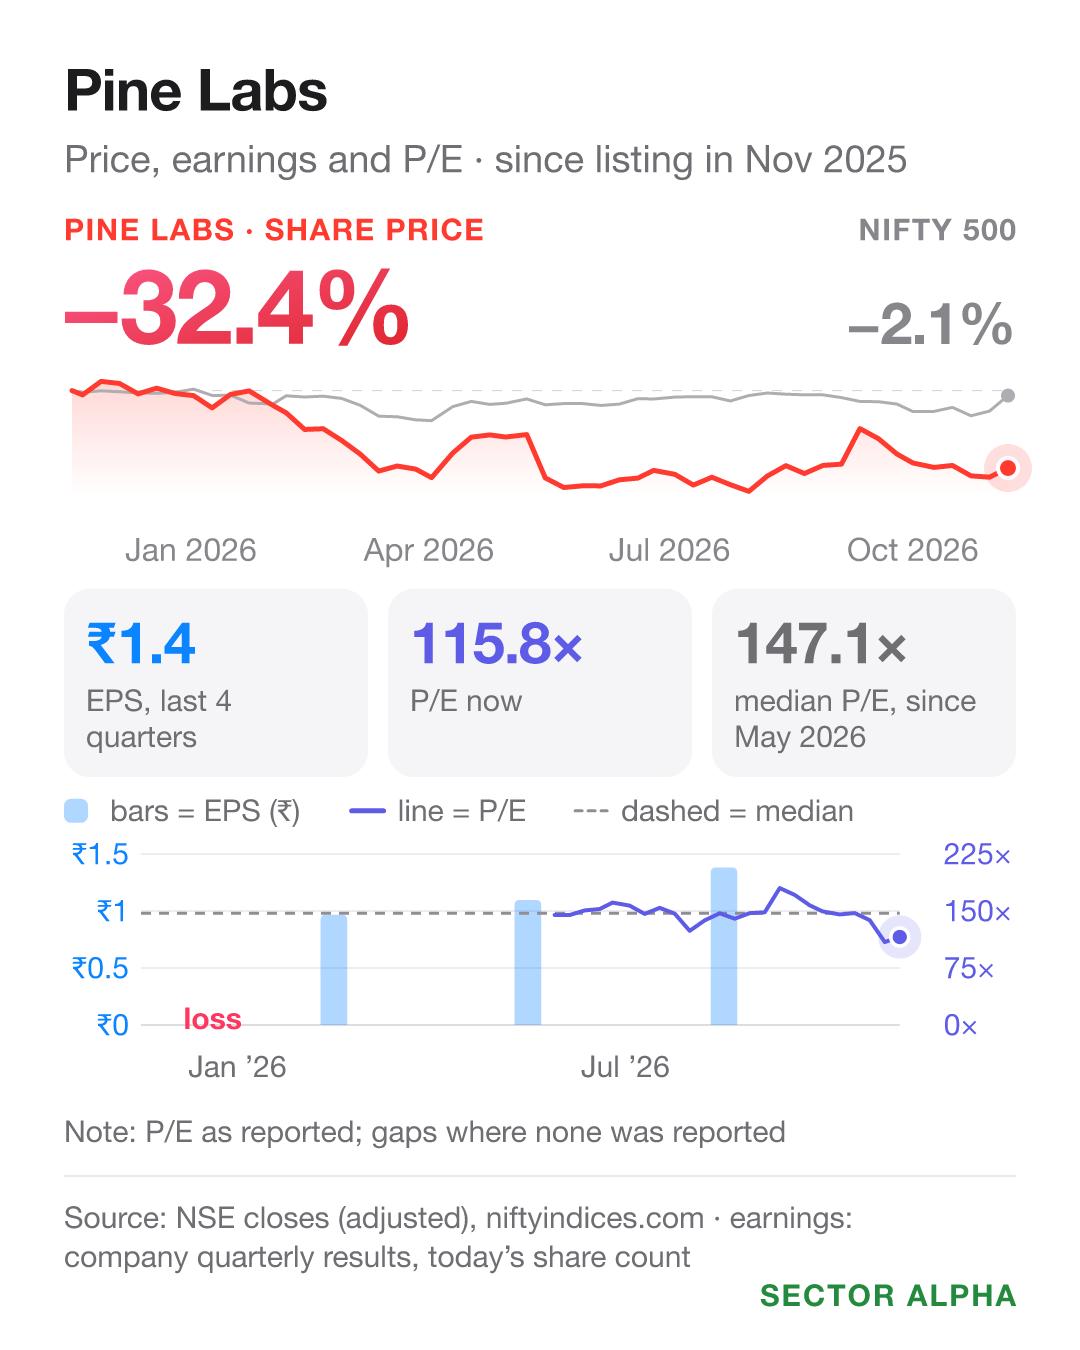
Earnings per share, last 4 quarters: loss of ₹0.6 → profit of ₹1.4. Share price: no one-year change. It listed on 14 Nov 2025.
A year ago there was no P/E (price ÷ earnings per share): earnings were a loss. P/E on 6 Nov 2026: 115.8.
What led to it
Shops paying more through it: sales up 24%, and management raised its growth goal for the year.
Margin goal: in July, management said the FY27 margin would not fall below FY26’s. In October, it said at least 21%, by its own measure.
MobiKwik (Q2 FY27)
MobiKwik offers digital money services to people and shops.
Other income: ₹7 crore, set against ₹12 crore of profit.
Each quarter vs a year earlier
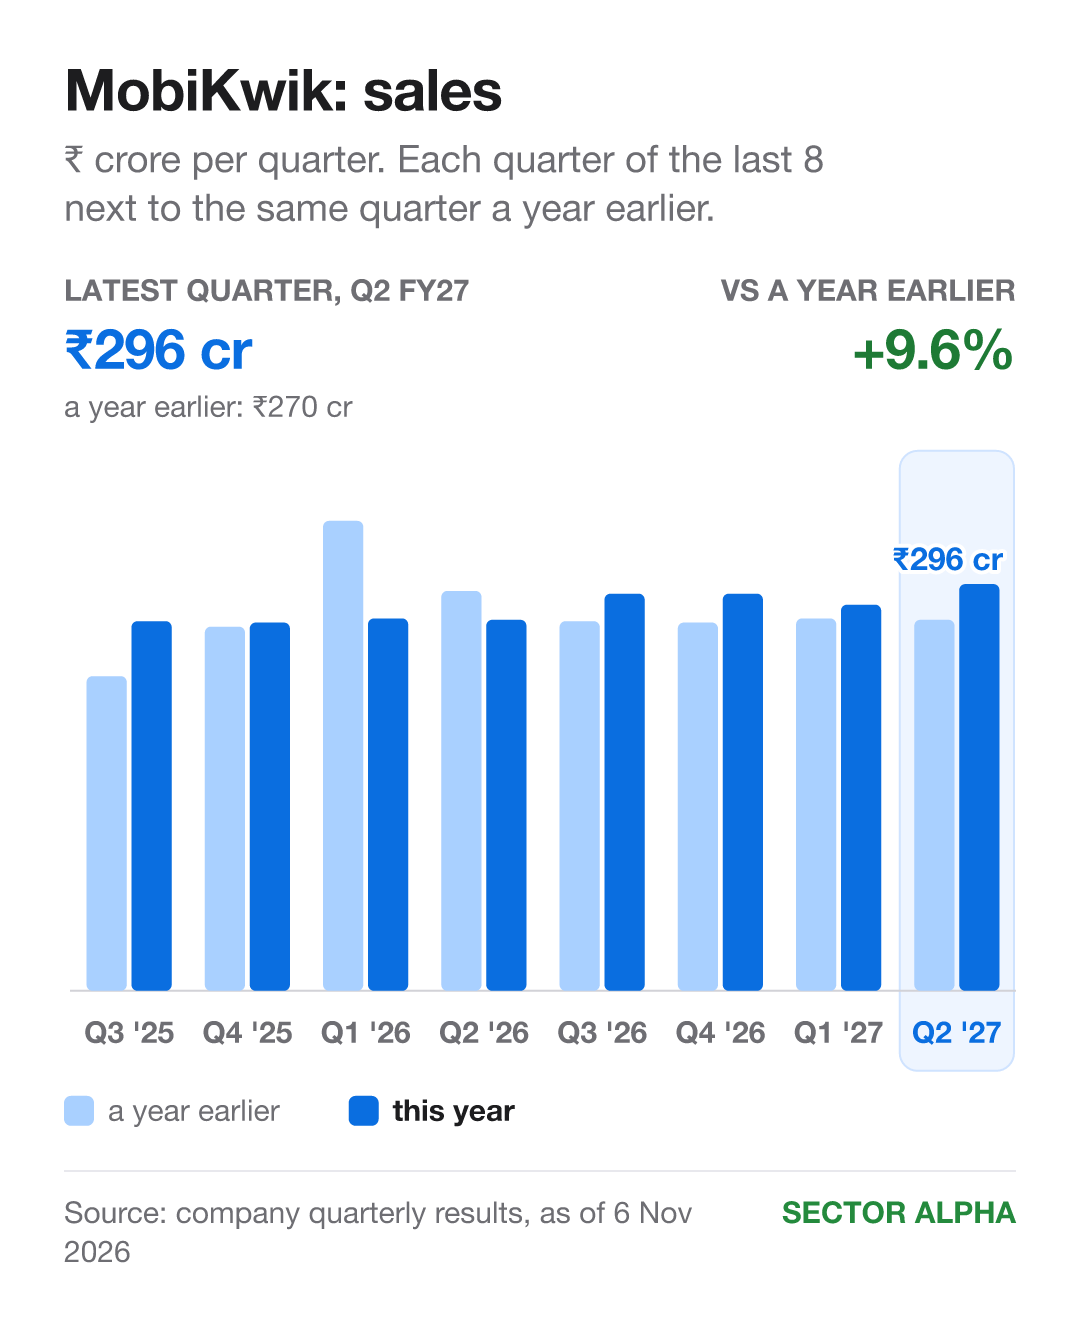
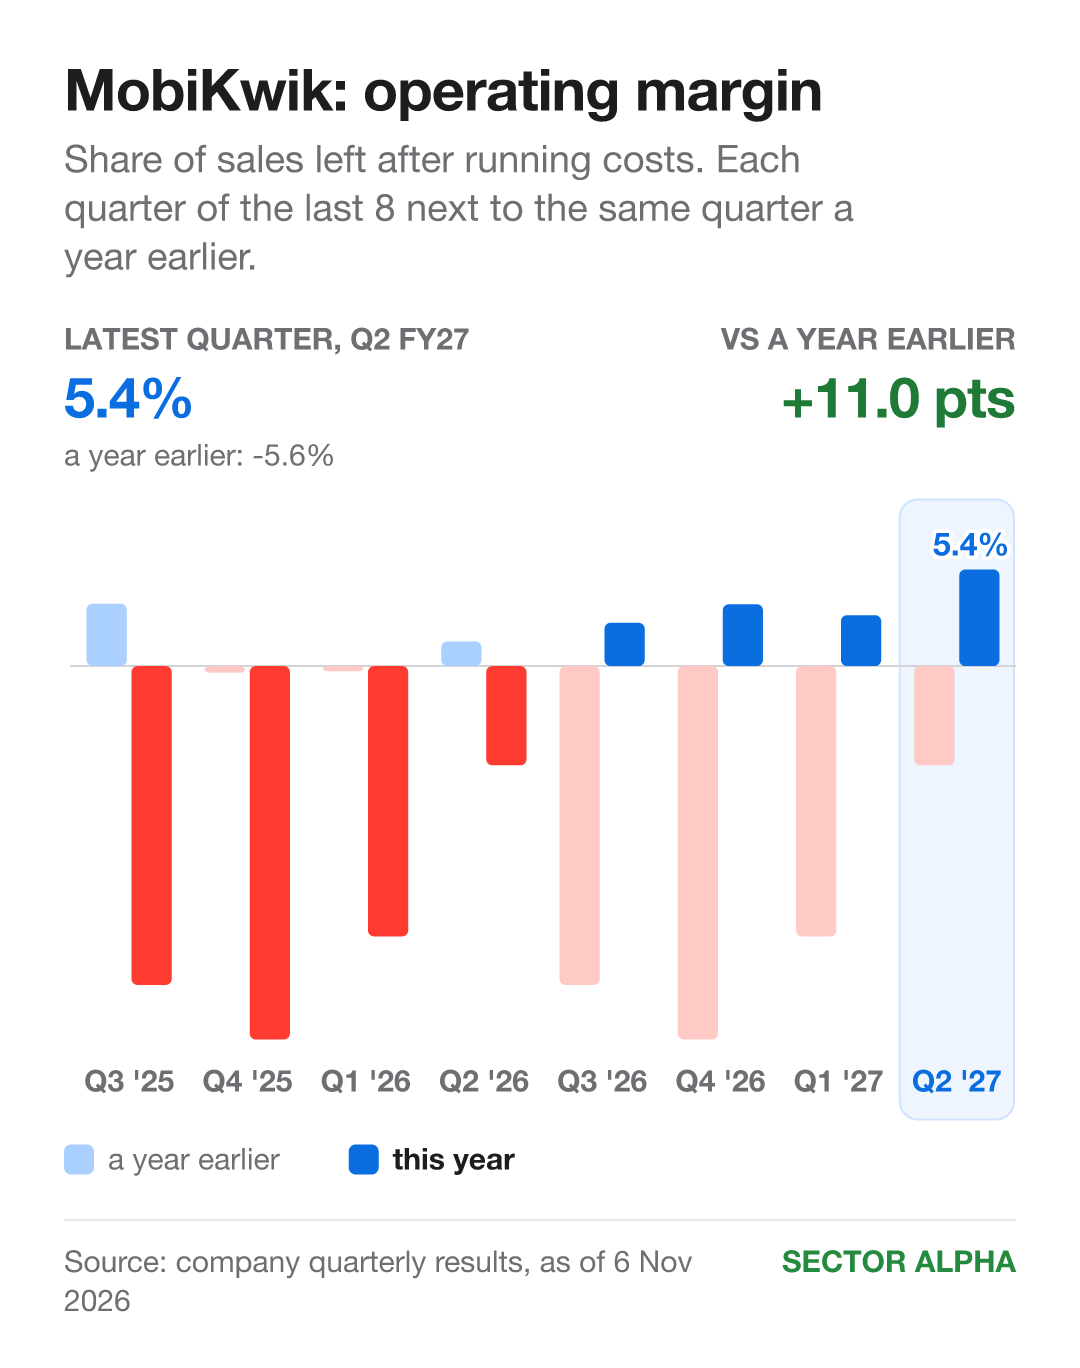
Sales: ₹270 cr → ₹296 cr. Up 9.6%. Higher in 6 of the last 8 quarters. Margin: -5.6% → 5.4%. Up 11 points. Higher in 4 of 8. Net profit: loss of ₹29 cr → profit of ₹12 cr. Higher in 4 of 8.
Price, earnings and P/E
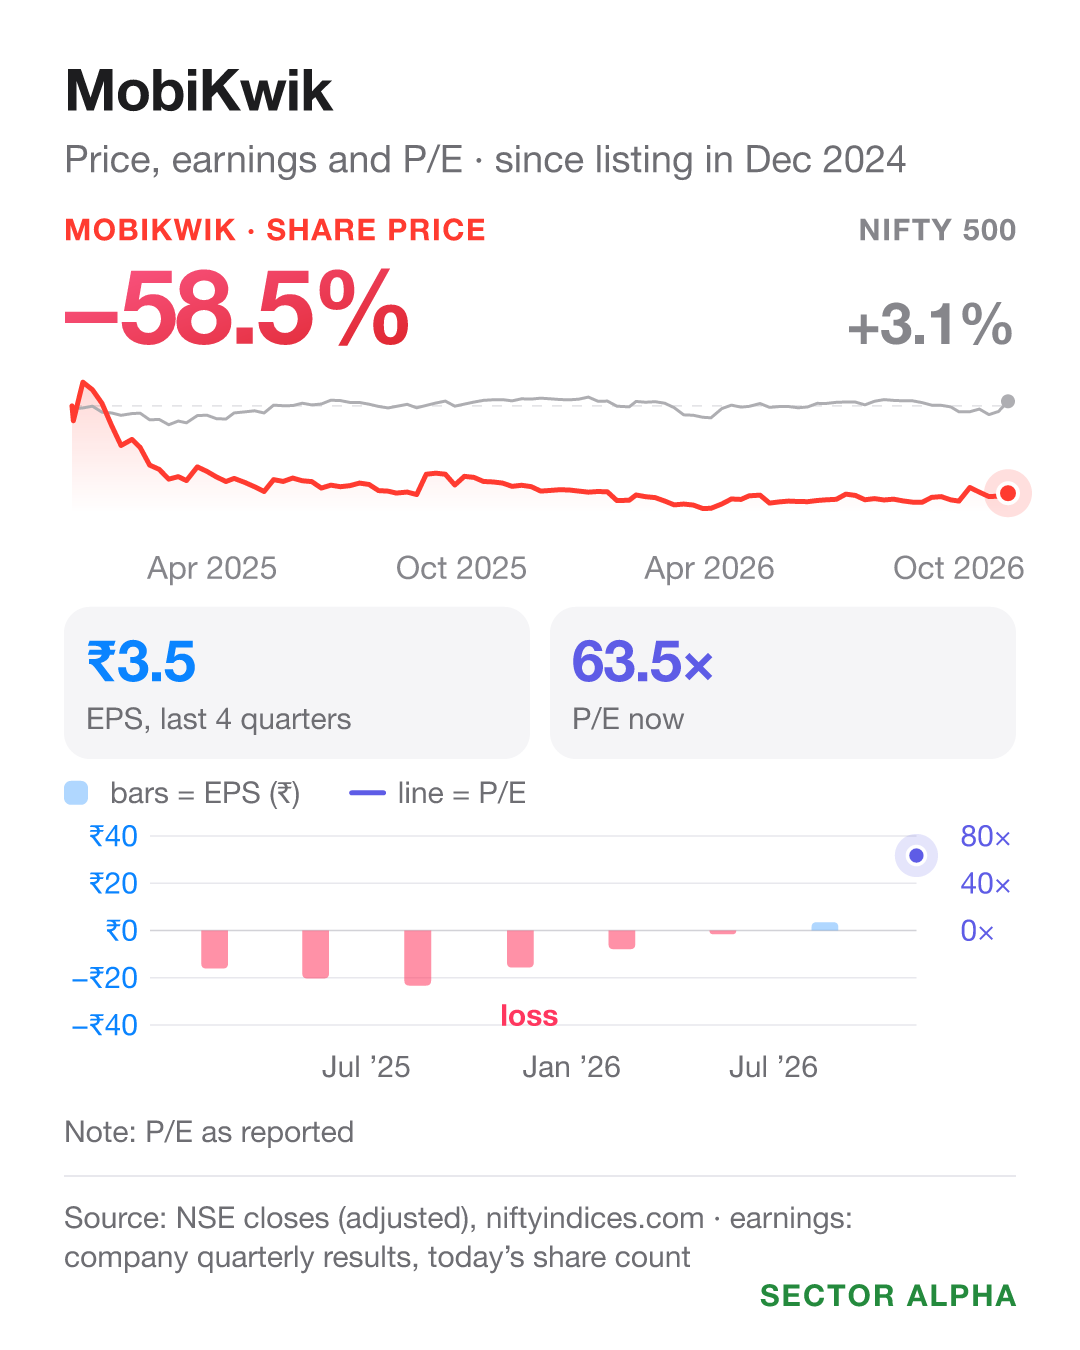
Earnings per share, last 4 quarters: loss of ₹23 → profit of ₹3.5. Share price, same year: down 8%.
A year ago there was no P/E (price ÷ earnings per share): earnings were a loss. P/E on 6 Nov 2026: 63.5. It is the first P/E: four-quarter earnings turned positive only with July to September.
What led to it
No earnings call for Jul to Sep 2026 in my records, so I can’t give management’s reasons. What stands out: sales rose 9.6% while running costs fell slightly, from ₹286 crore to ₹280 crore.
Macfos (Q2 FY27)
Macfos runs Robu.in, an online shop for parts used in robots, drones and electric bikes.
Share price, last 3 months: down 14.1%, the worst of the ten.
Each quarter vs a year earlier
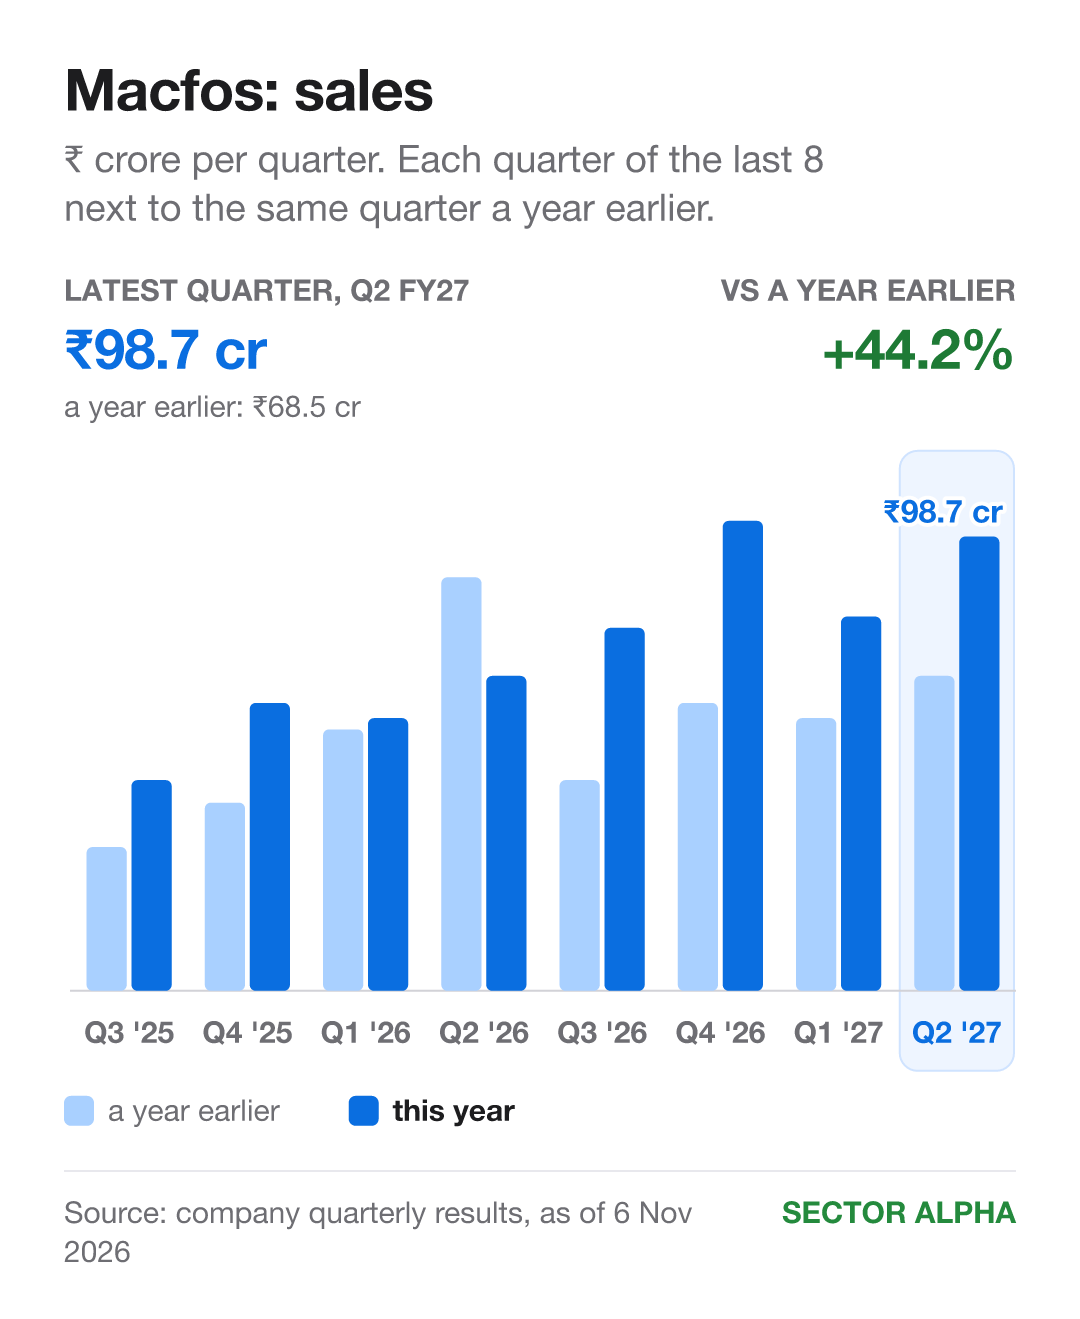
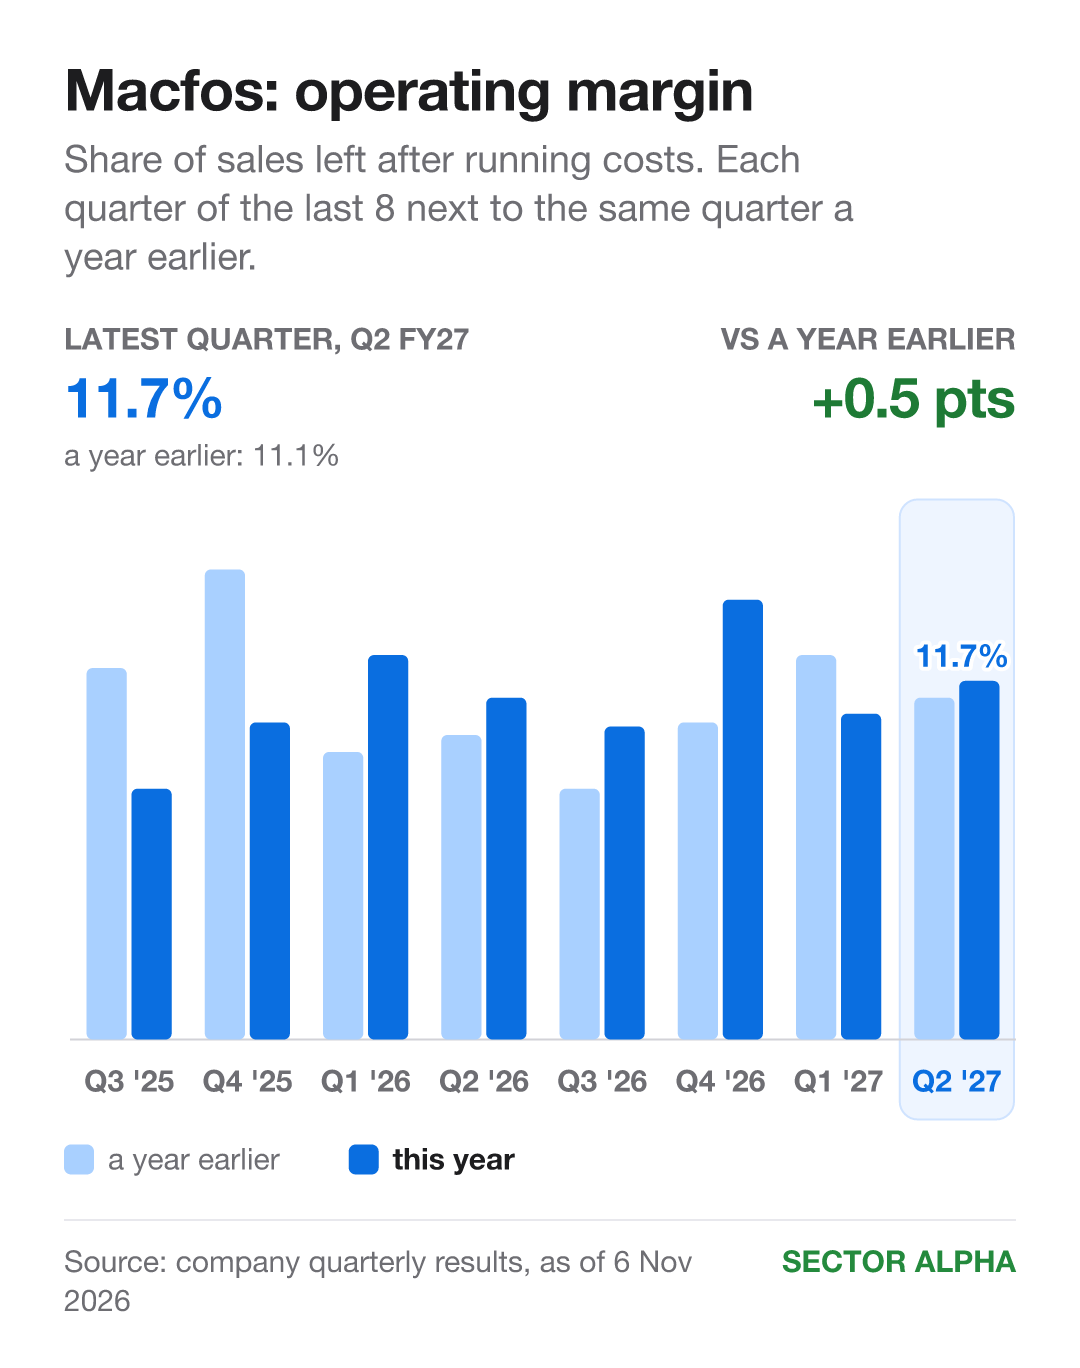
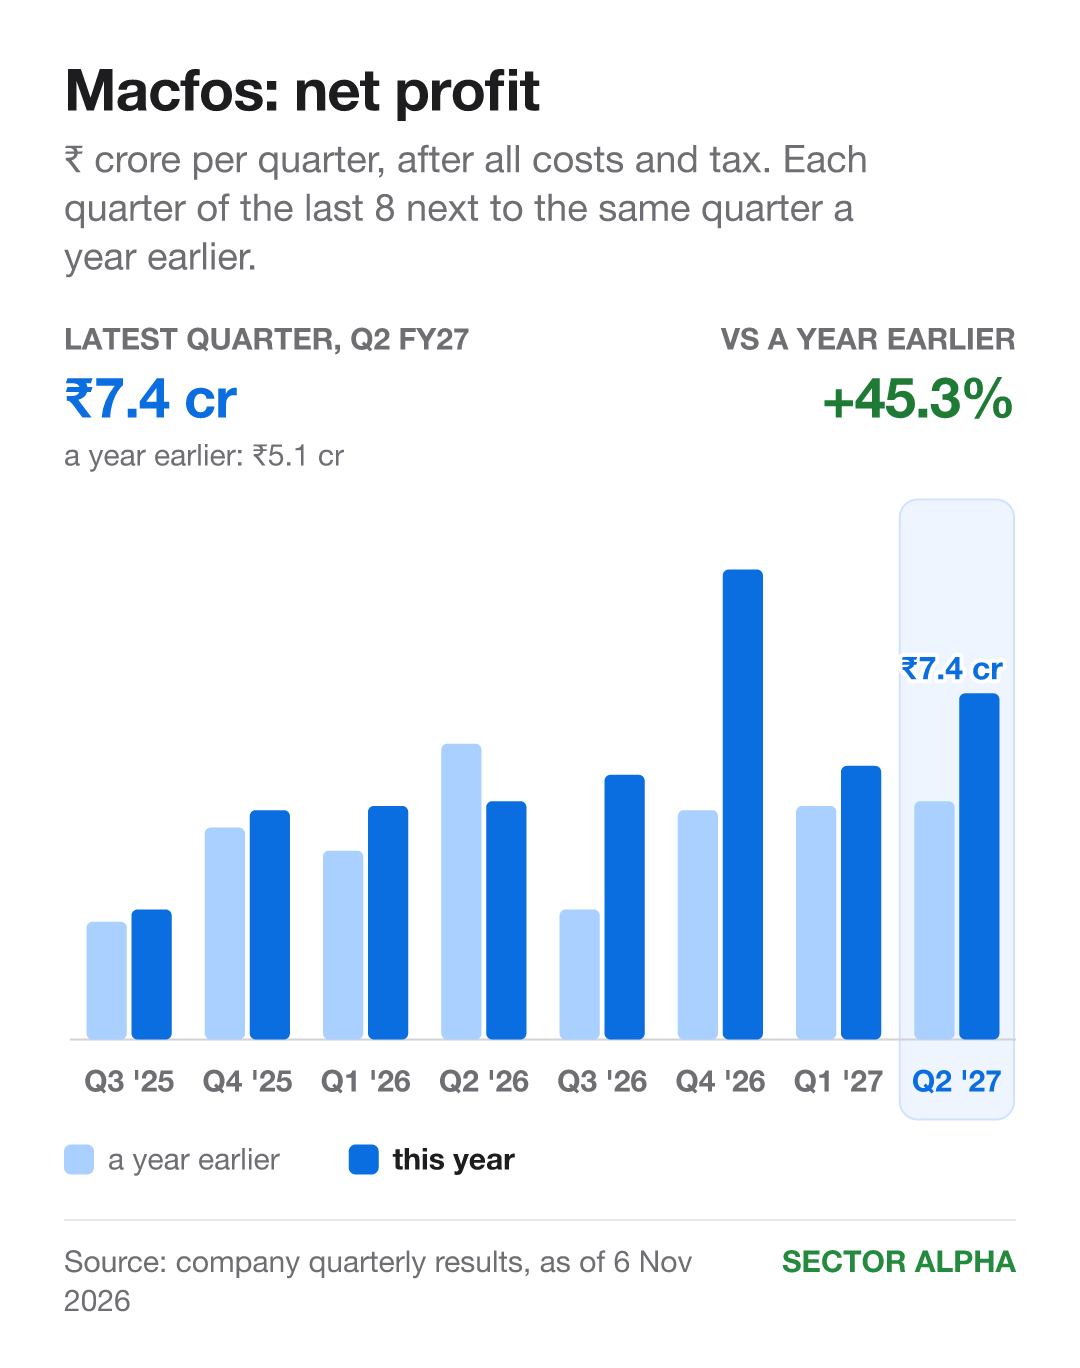
Sales: ₹68.5 cr → ₹98.7 cr. Up 44.2%. Higher in 7 of the last 8 quarters. Margin: 11.1% → 11.7%. Up slightly. Higher in 5 of 8. Net profit: ₹5.1 cr → ₹7.4 cr. Up 45.3%. Higher in 7 of 8.
Price, earnings and P/E
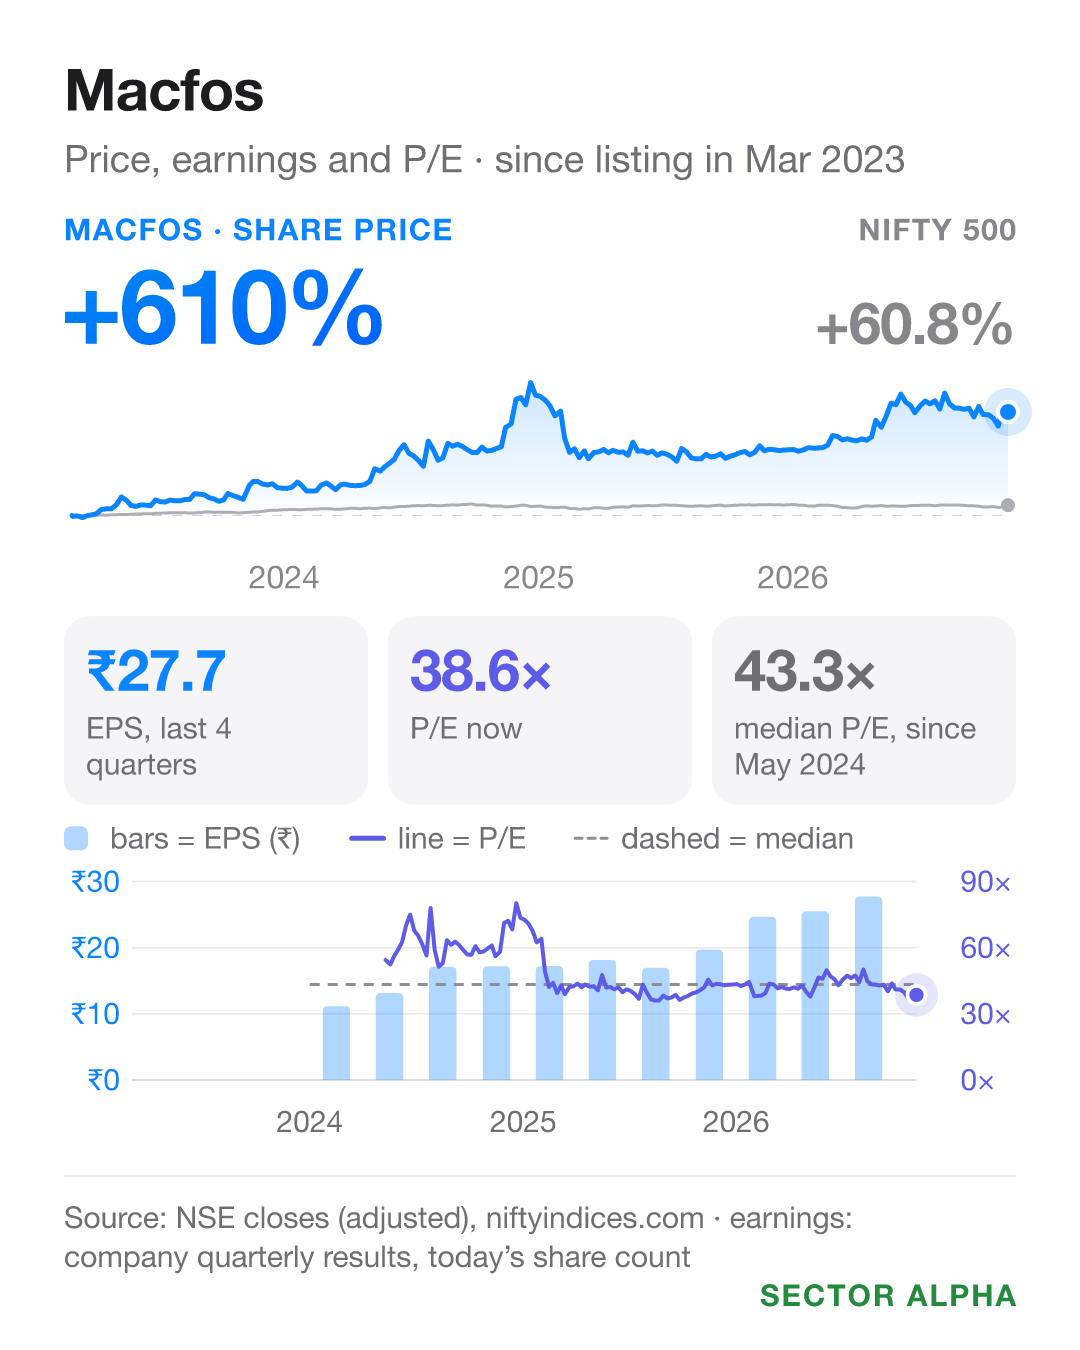
Earnings per share, last 4 quarters: ₹17 → ₹27.7. Up 63%. Share price, same year: up 51%.
Earnings ran ahead of the price. So P/E (price ÷ earnings per share) fell from about 42 to 39 by 6 Nov 2026.
What led to it
No earnings call for Jul to Sep 2026 in my records, so I can’t give management’s reasons. What stands out: profit grew as fast as sales, so the growth is not coming at the cost of margin.
TBO Tek (Q2 FY27)
TBO Tek brings flights, hotels and other travel options together on online booking platforms.
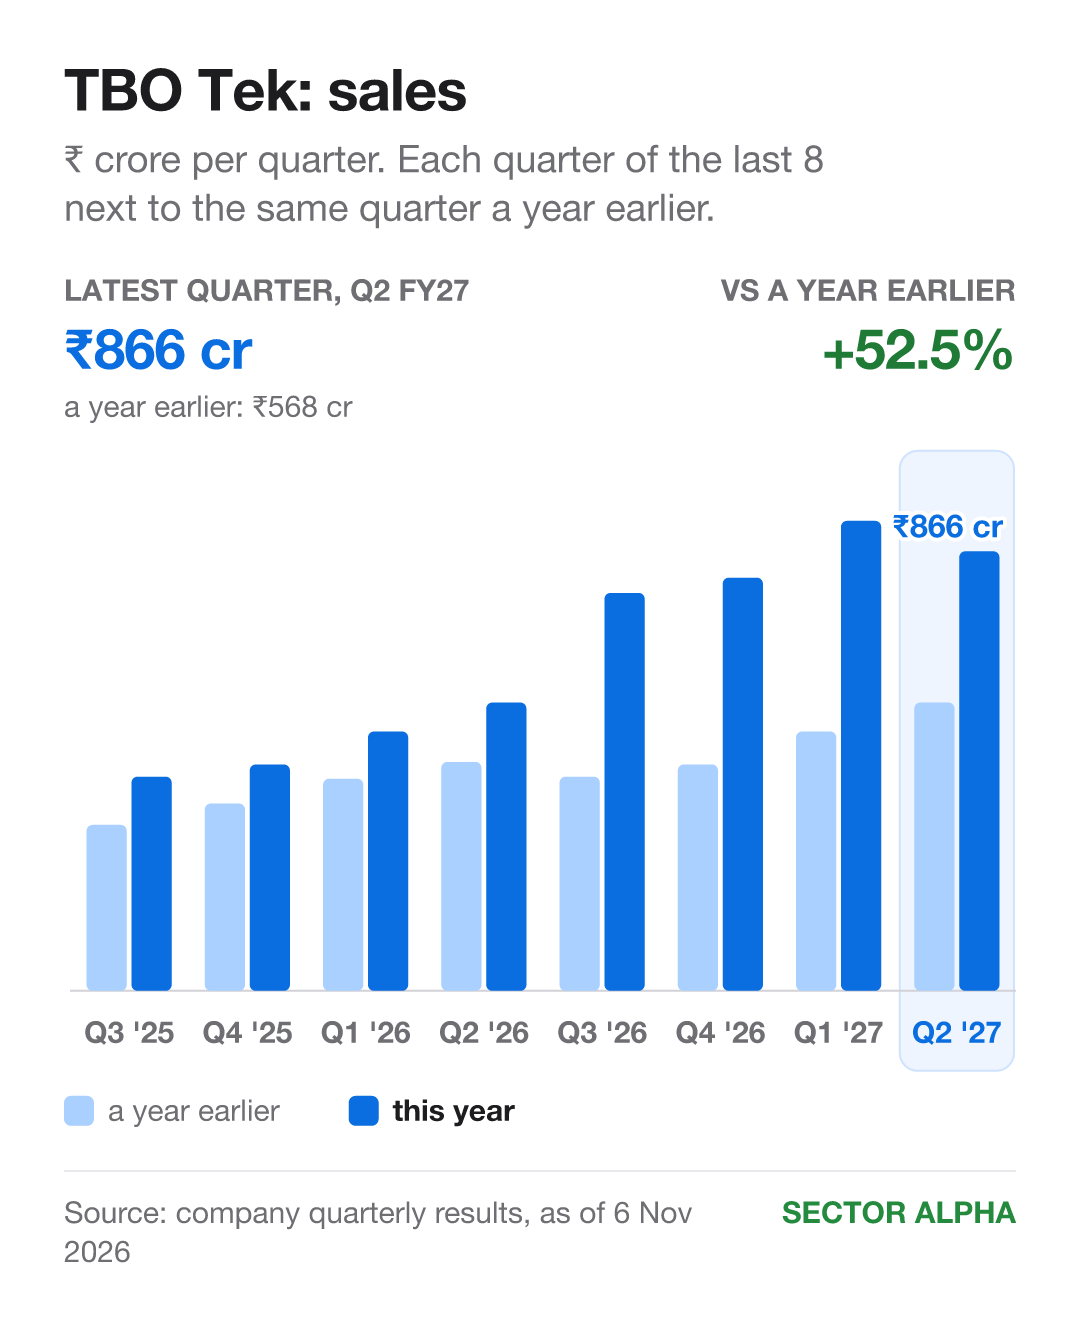
Sales vs Apr to Jun 2026: down, ₹926 crore → ₹866 crore.
Each quarter vs a year earlier
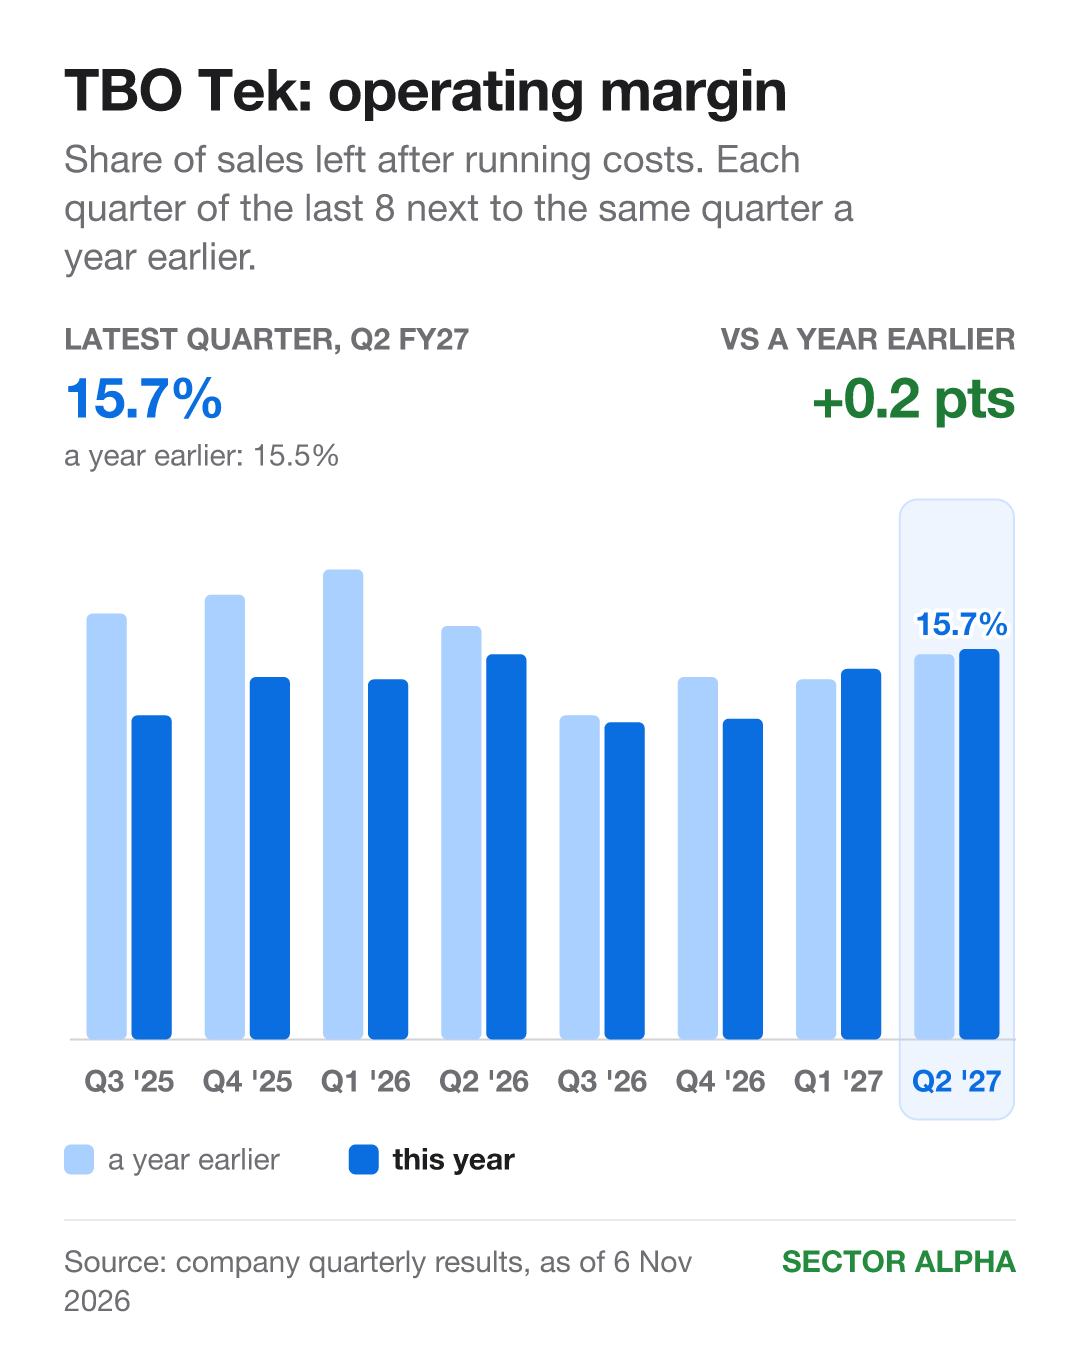
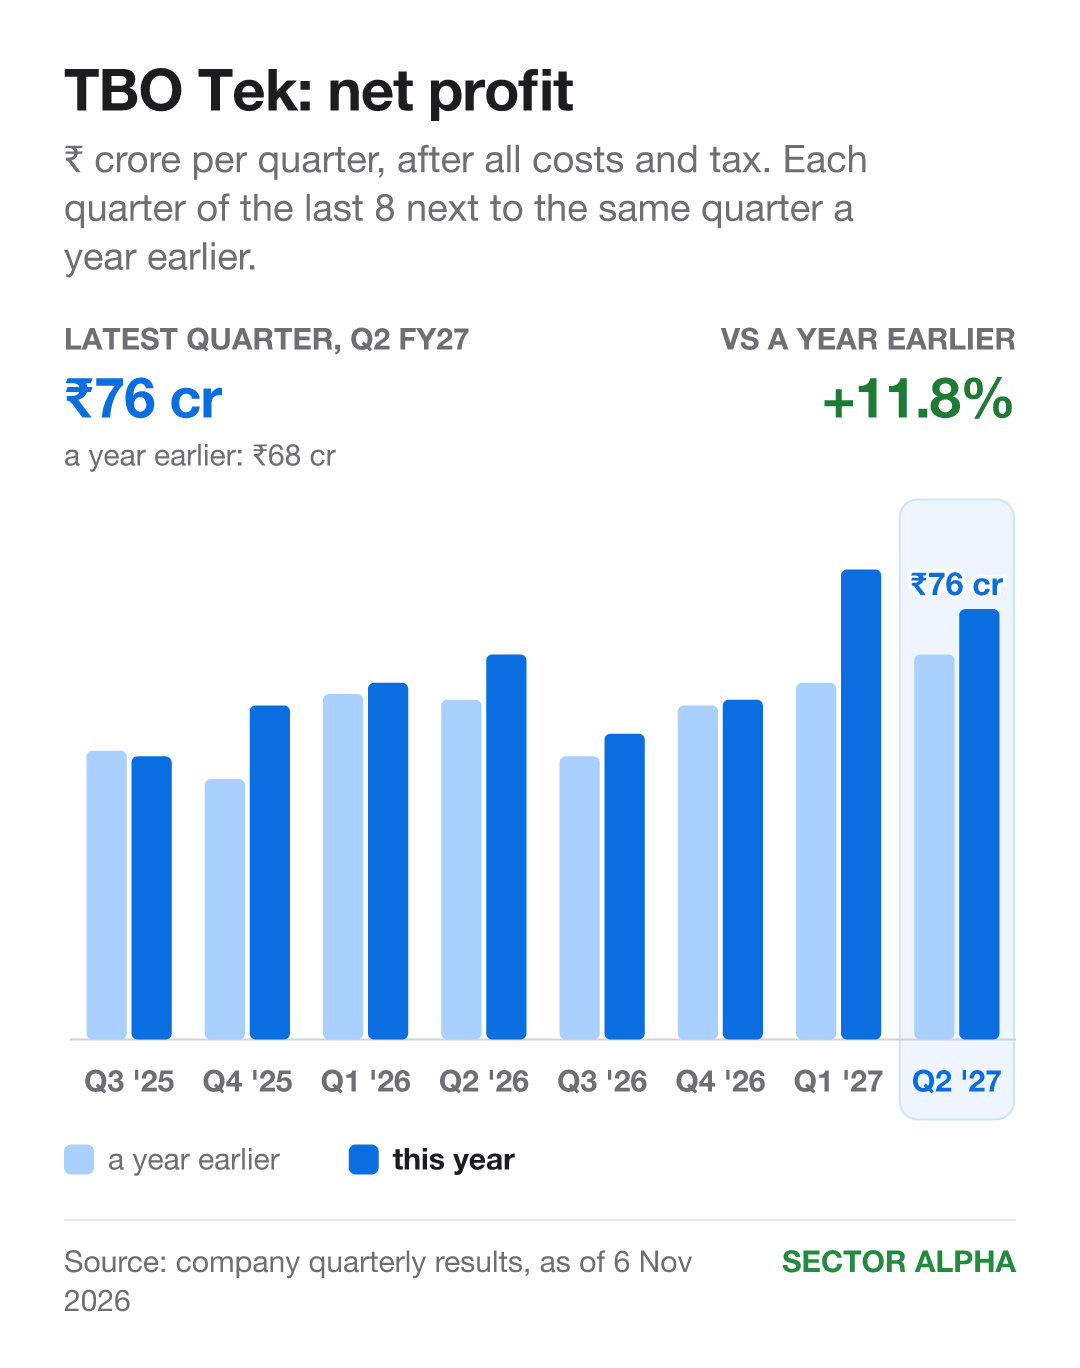
Sales: ₹568 cr → ₹866 cr. Up 52.5%. Higher in 8 of the last 8 quarters. Margin: 15.5% → 15.7%. Up slightly. Higher in only 2 of 8. Net profit: ₹68 cr → ₹76 cr. Up 11.8%. Higher in 7 of 8.
Price, earnings and P/E
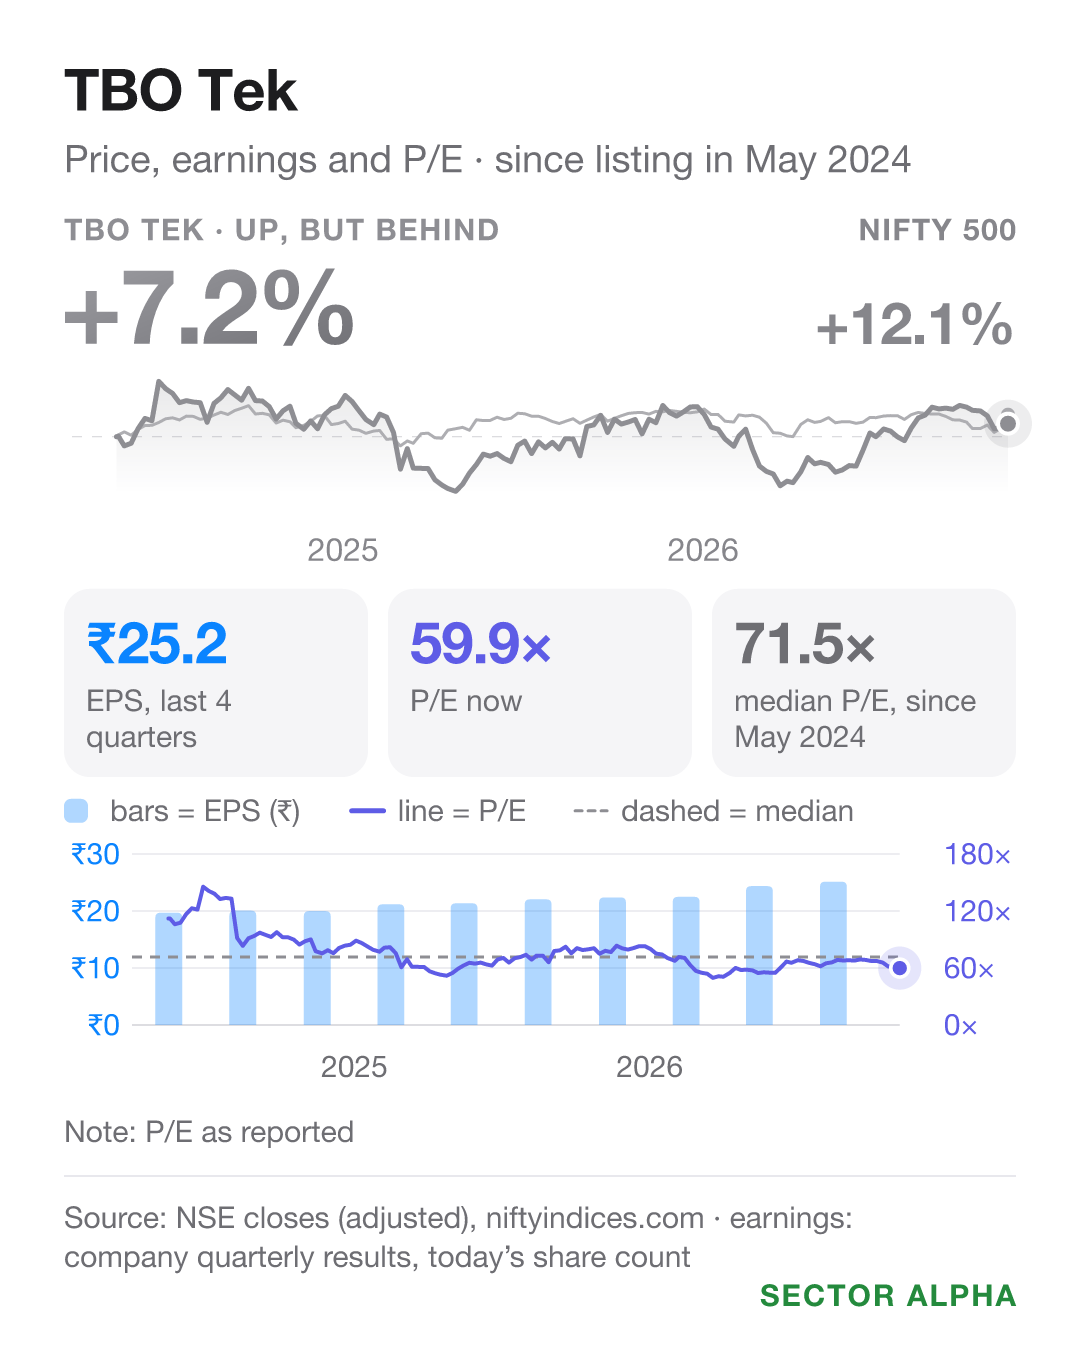
Earnings per share, last 4 quarters: ₹22 → ₹25.2. Up 14%. Share price, same year: down 0.9%.
Earnings ran ahead of the price. So P/E (price ÷ earnings per share) fell from about 69 to 60 by 6 Nov 2026.
What led to it
No earnings call for Jul to Sep 2026 in my records, so I can’t give management’s reasons. What stands out: profit grew far slower than sales, 11.8% against 52.5%.
Info Edge (Q2 FY27)
Info Edge runs online sites for jobs, property, matchmaking and education.
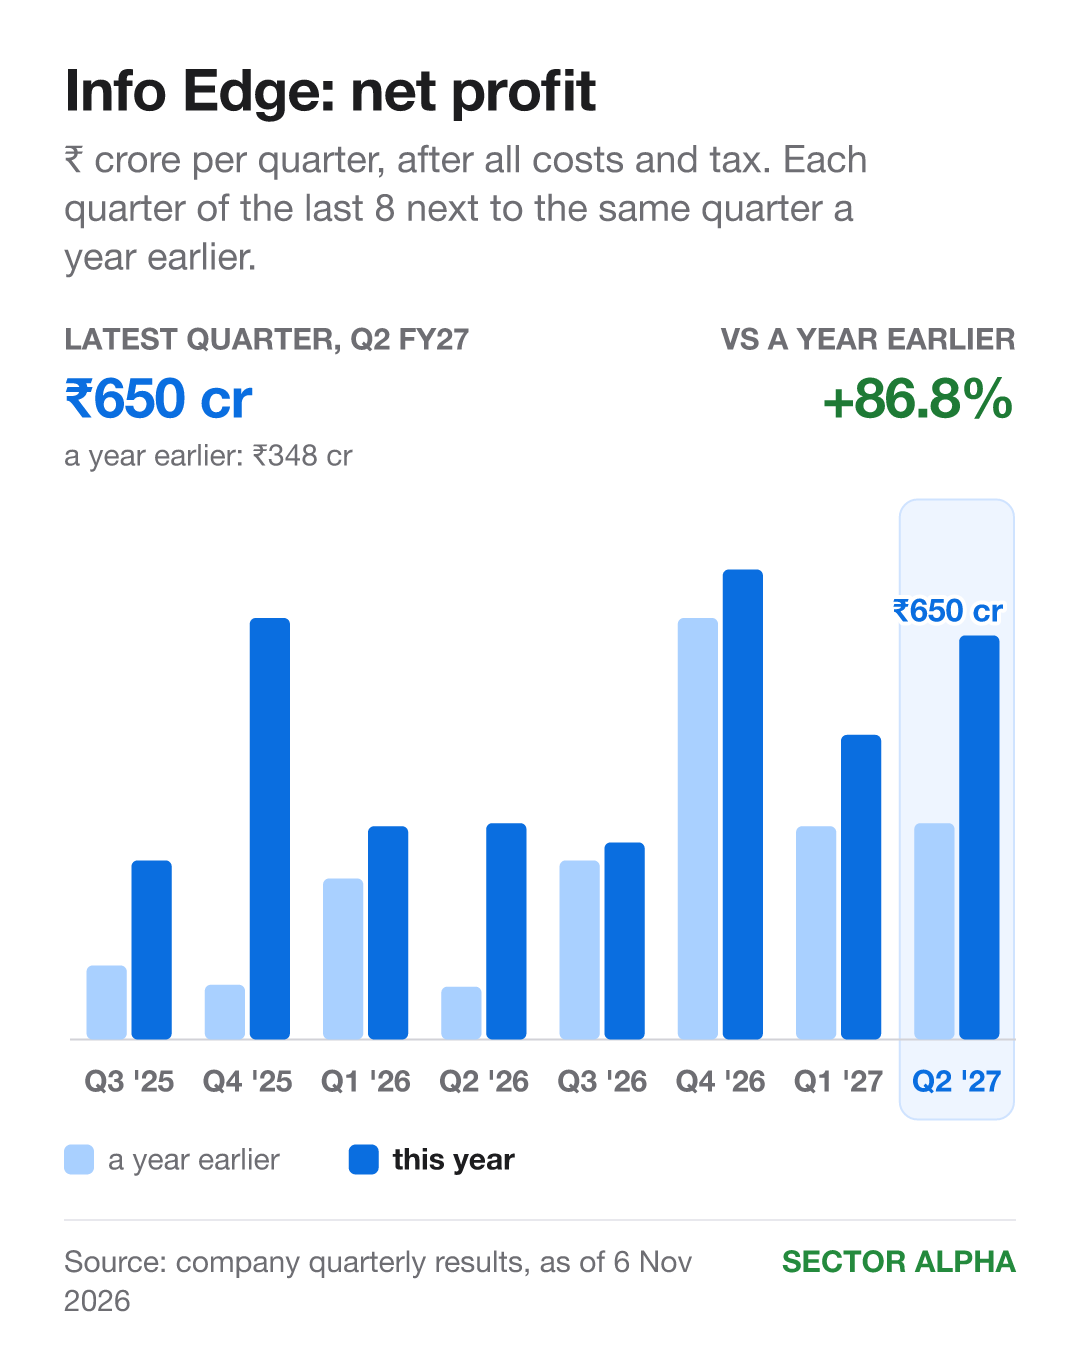
Other income: ₹432 crore, set against ₹650 crore of profit.
Each quarter vs a year earlier
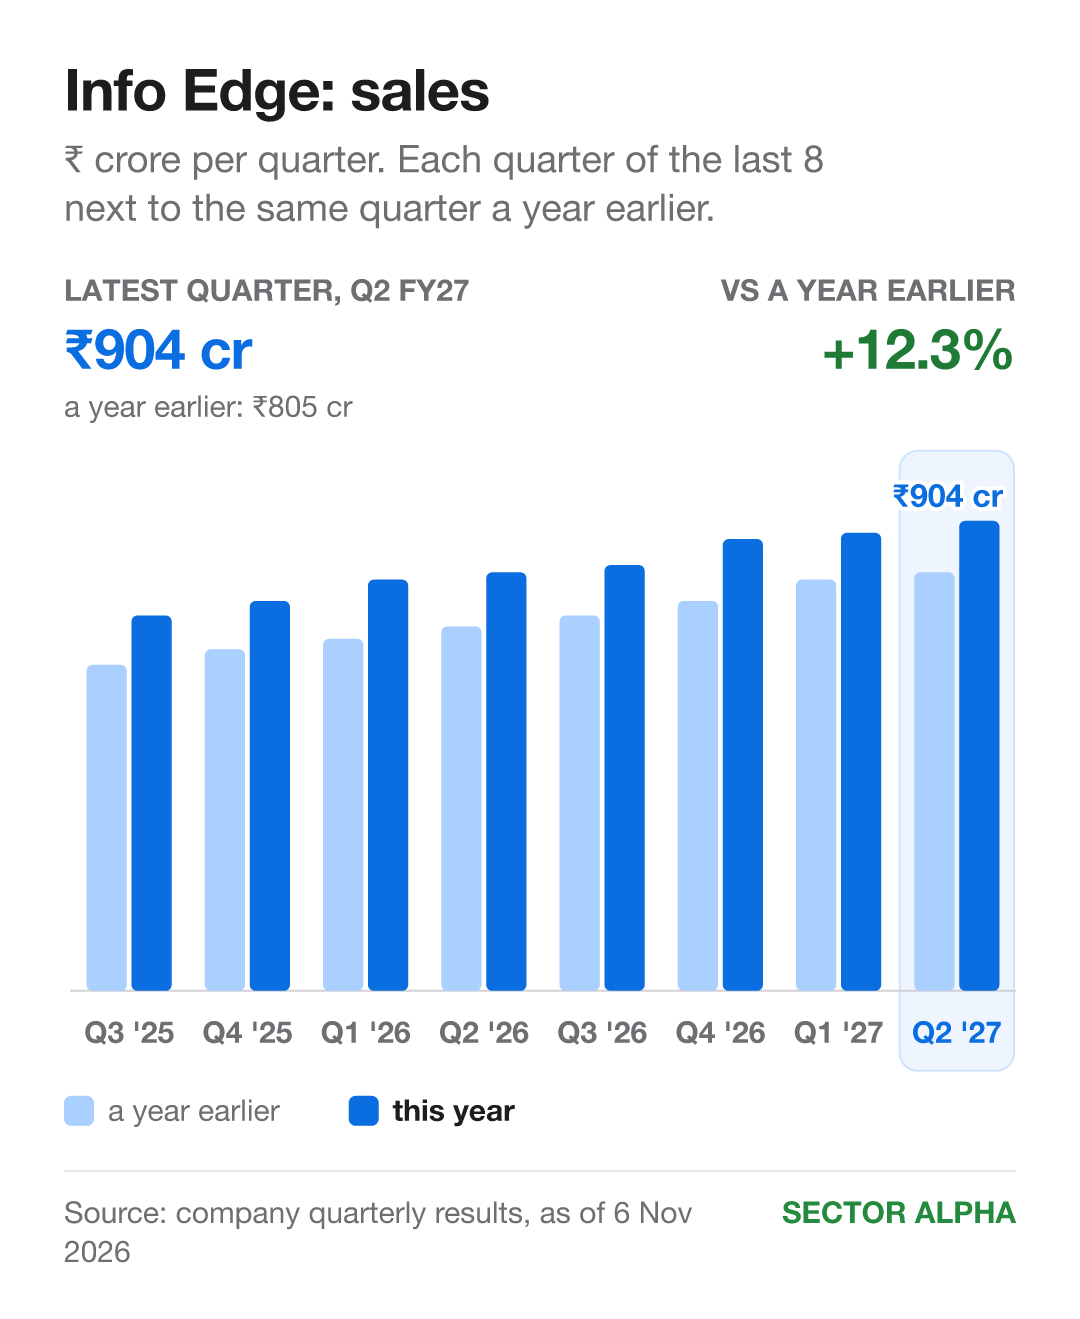
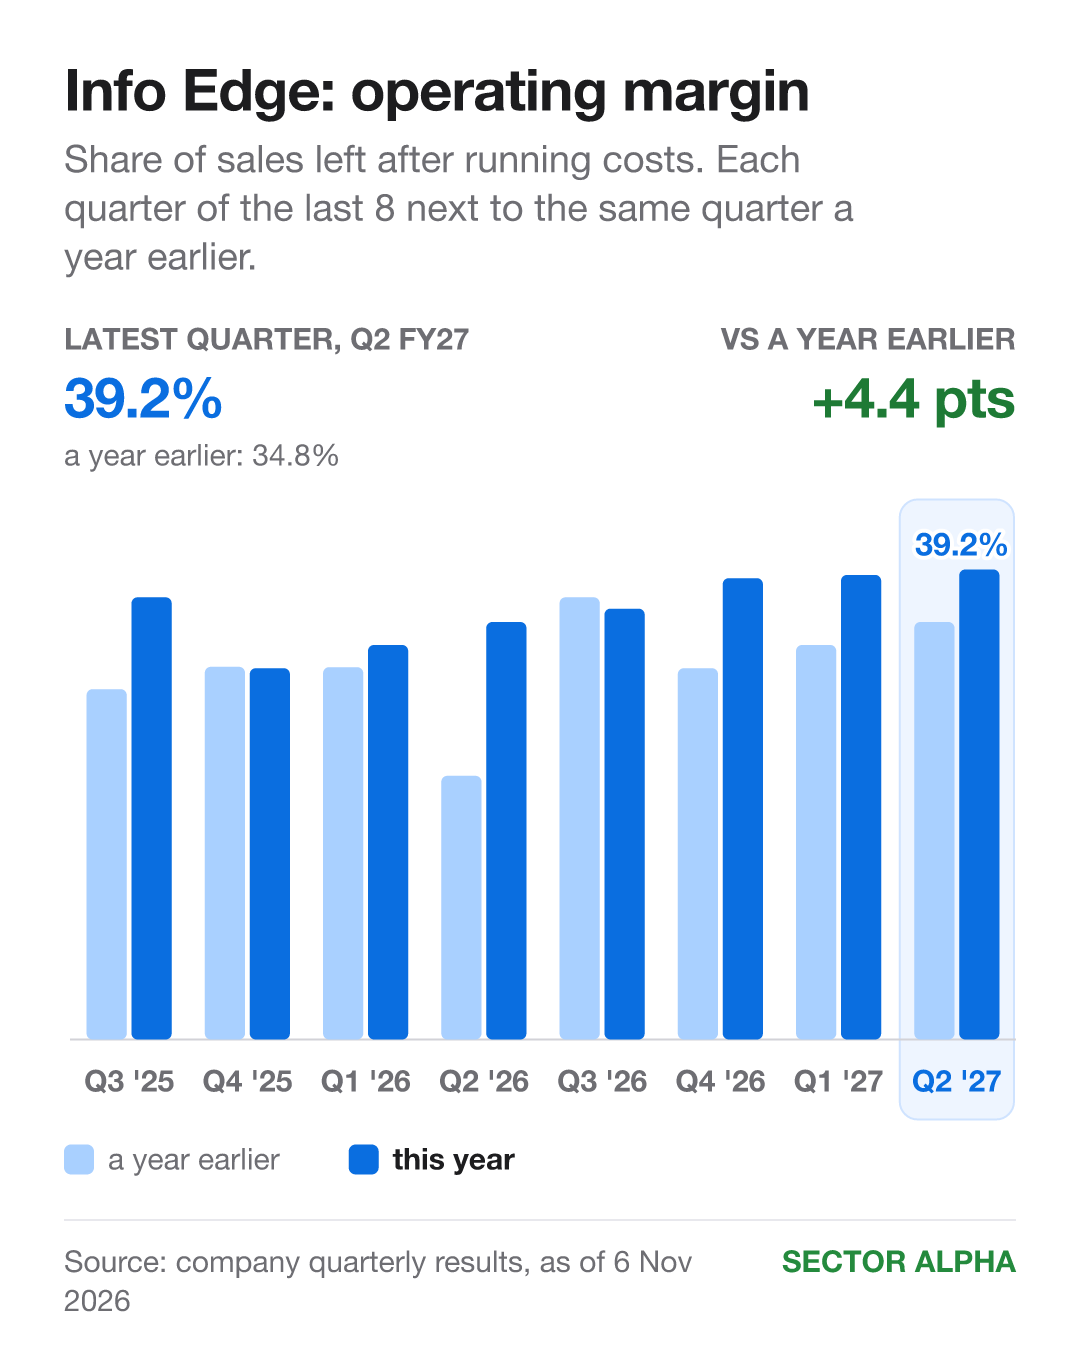
Sales: ₹805 cr → ₹904 cr. Up 12.3%. Higher in 8 of the last 8 quarters. Margin: 34.8% → 39.2%. Up 4.4 points. Higher in 6 of 8. Net profit: ₹348 cr → ₹650 cr. Up 86.8%. Higher in 8 of 8.
Price, earnings and P/E
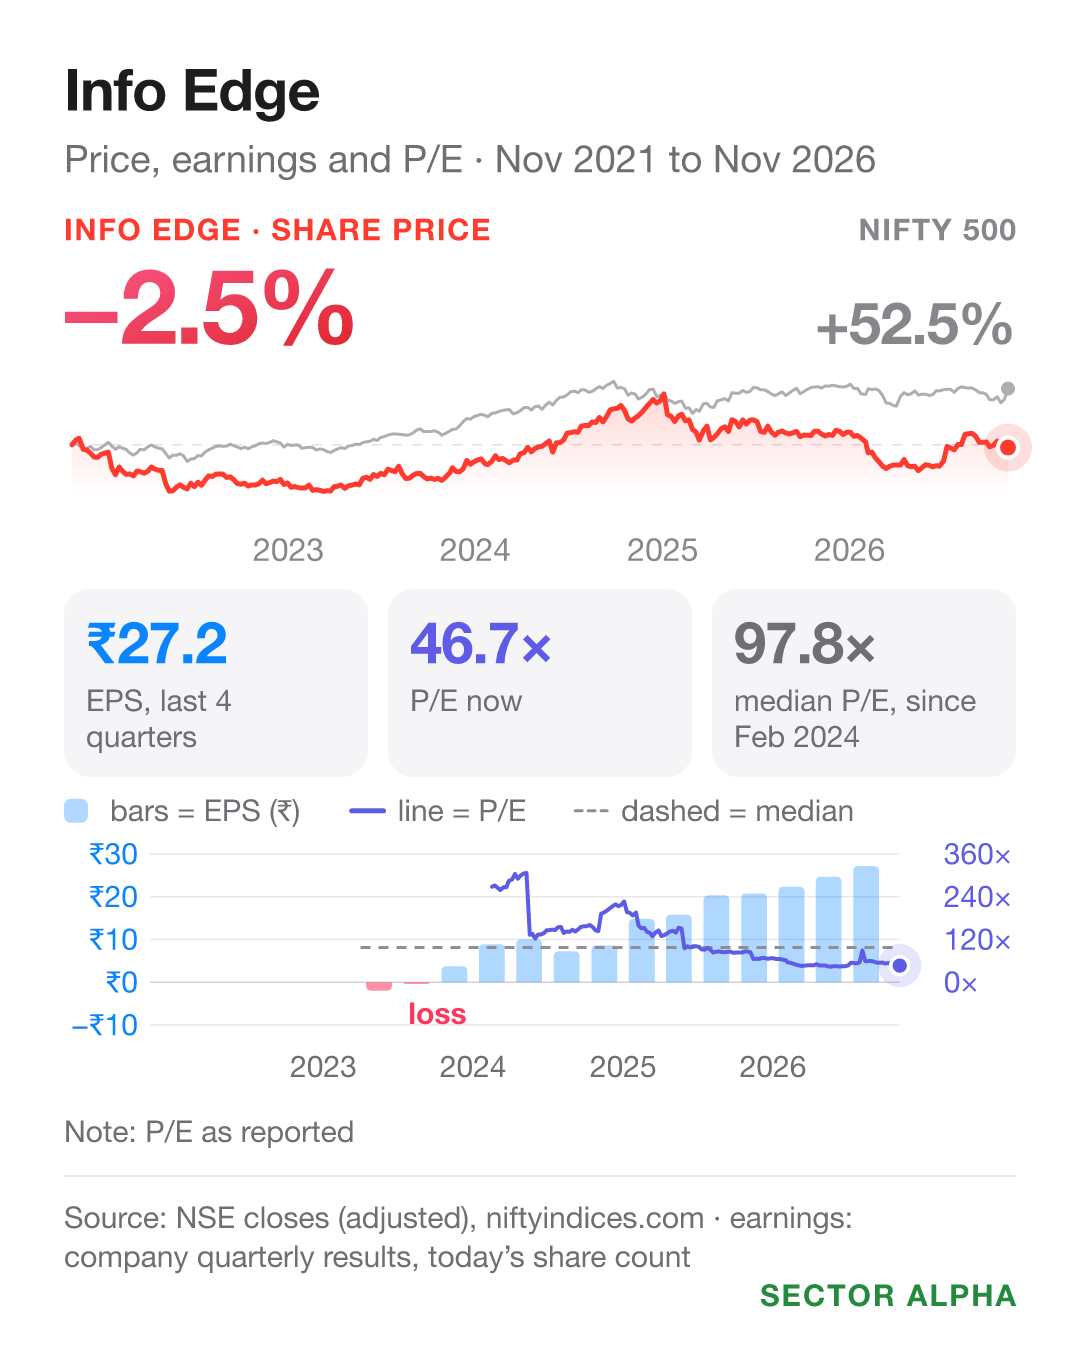
Earnings per share, last 4 quarters: ₹20.3 → ₹27.2. Up 34%. Share price, same year: down 10%.
Earnings rose while the price fell. So P/E (price ÷ earnings per share) fell from about 69 to 47 by 6 Nov 2026.
What led to it
Recruitment: billings, the amounts charged to customers, up 13%.
Property: enquiries up 33% on a year ago.
Education: Shiksha billings down 27%, as AI changed how people search.
Changed number: in August, management said its AI recruiting tool was live at more than 4,000 customers. In October, it said 2,000 were trying it, with no reason given.
Just Dial (Q2 FY27)
Just Dial helps people find local businesses through its app, websites, voice and text services.
Other income: ₹55 crore, set against ₹108 crore of profit.
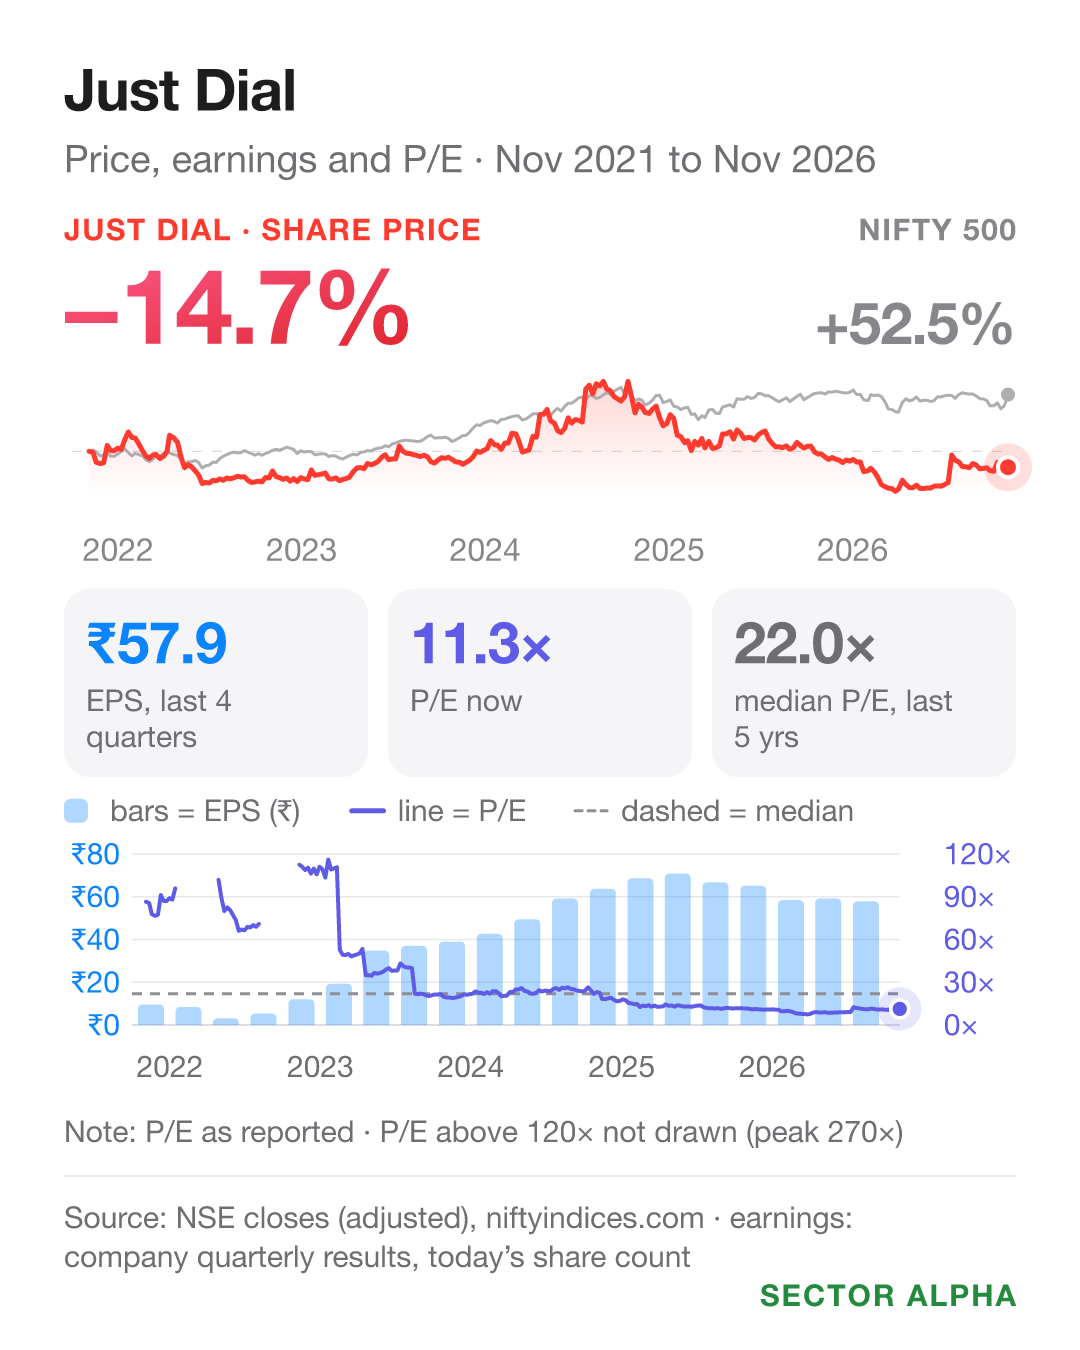
Share price, last 3 months: down 0.6%, just ahead of the NIFTY 500 (down 1.1%).
Each quarter vs a year earlier
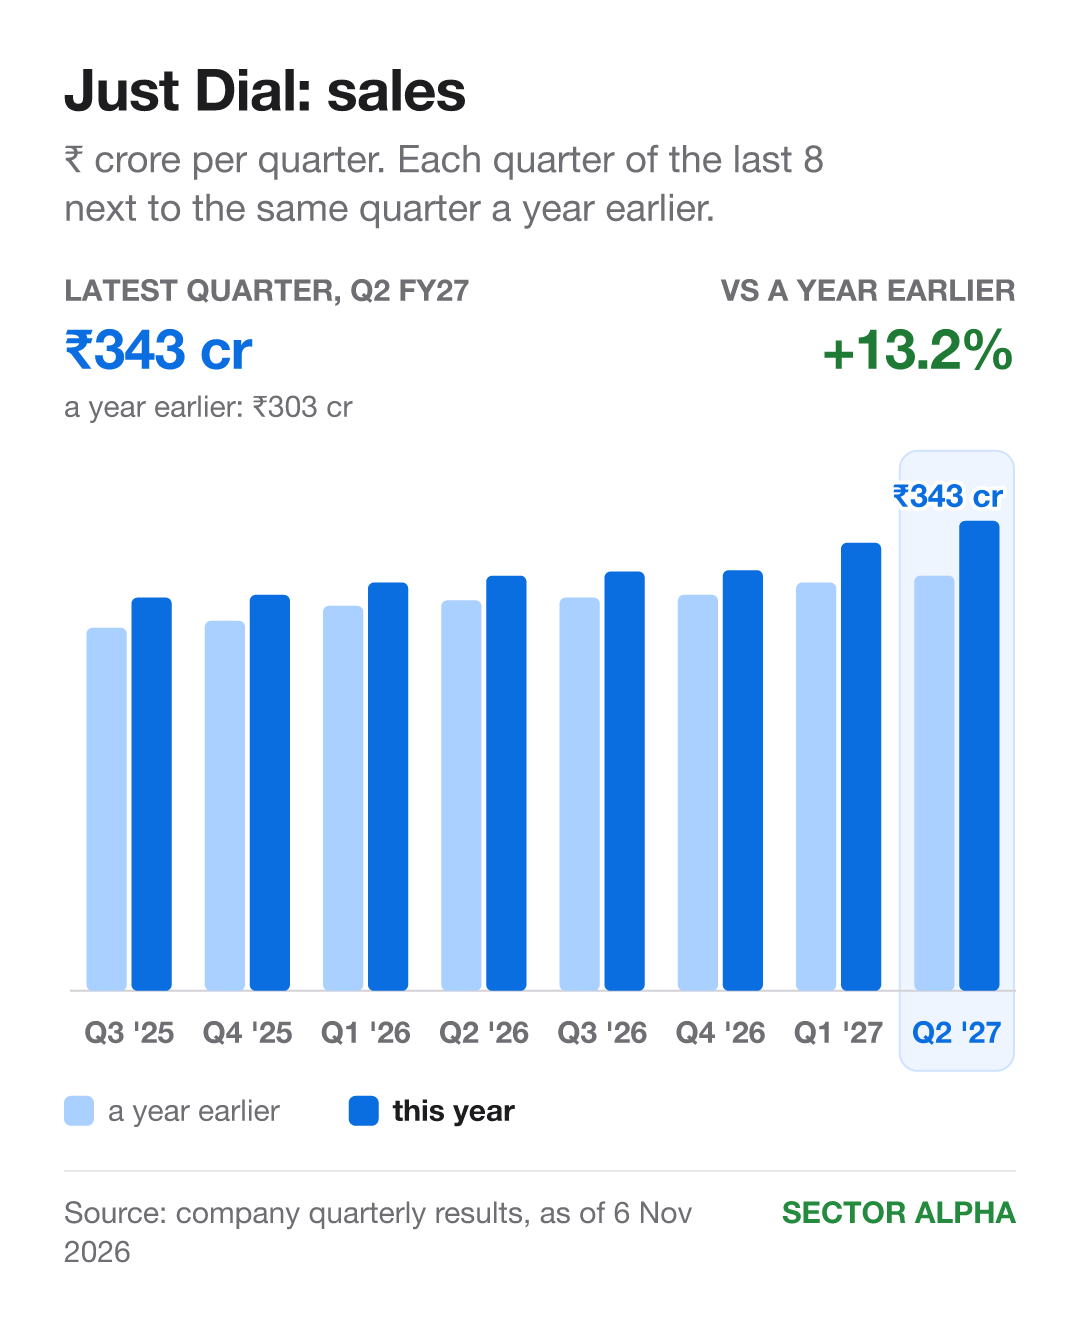
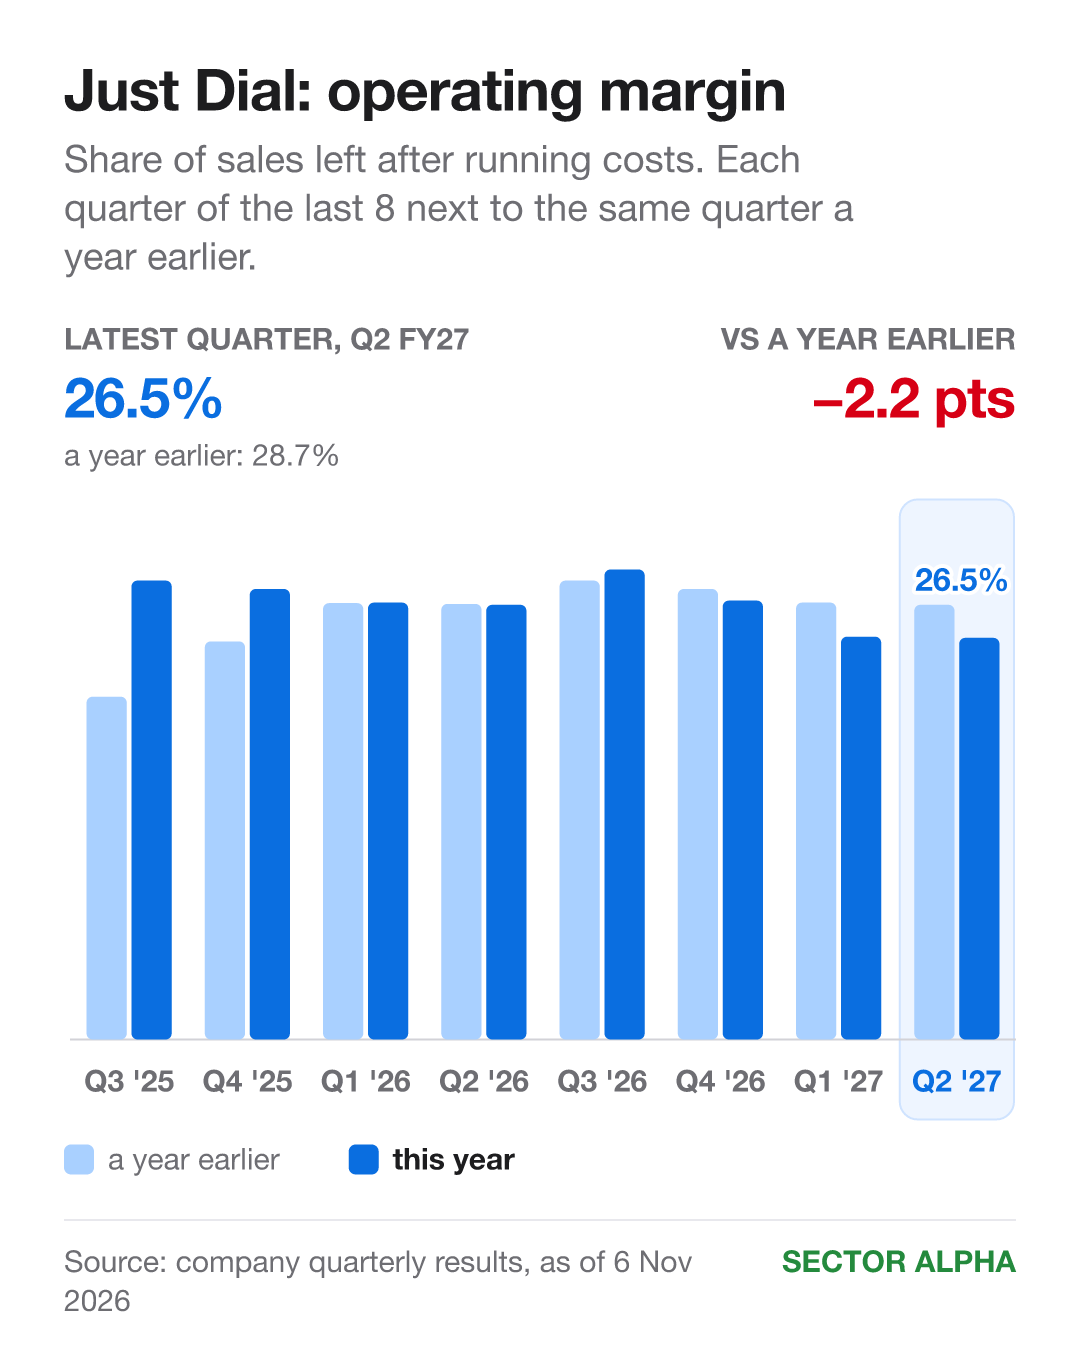
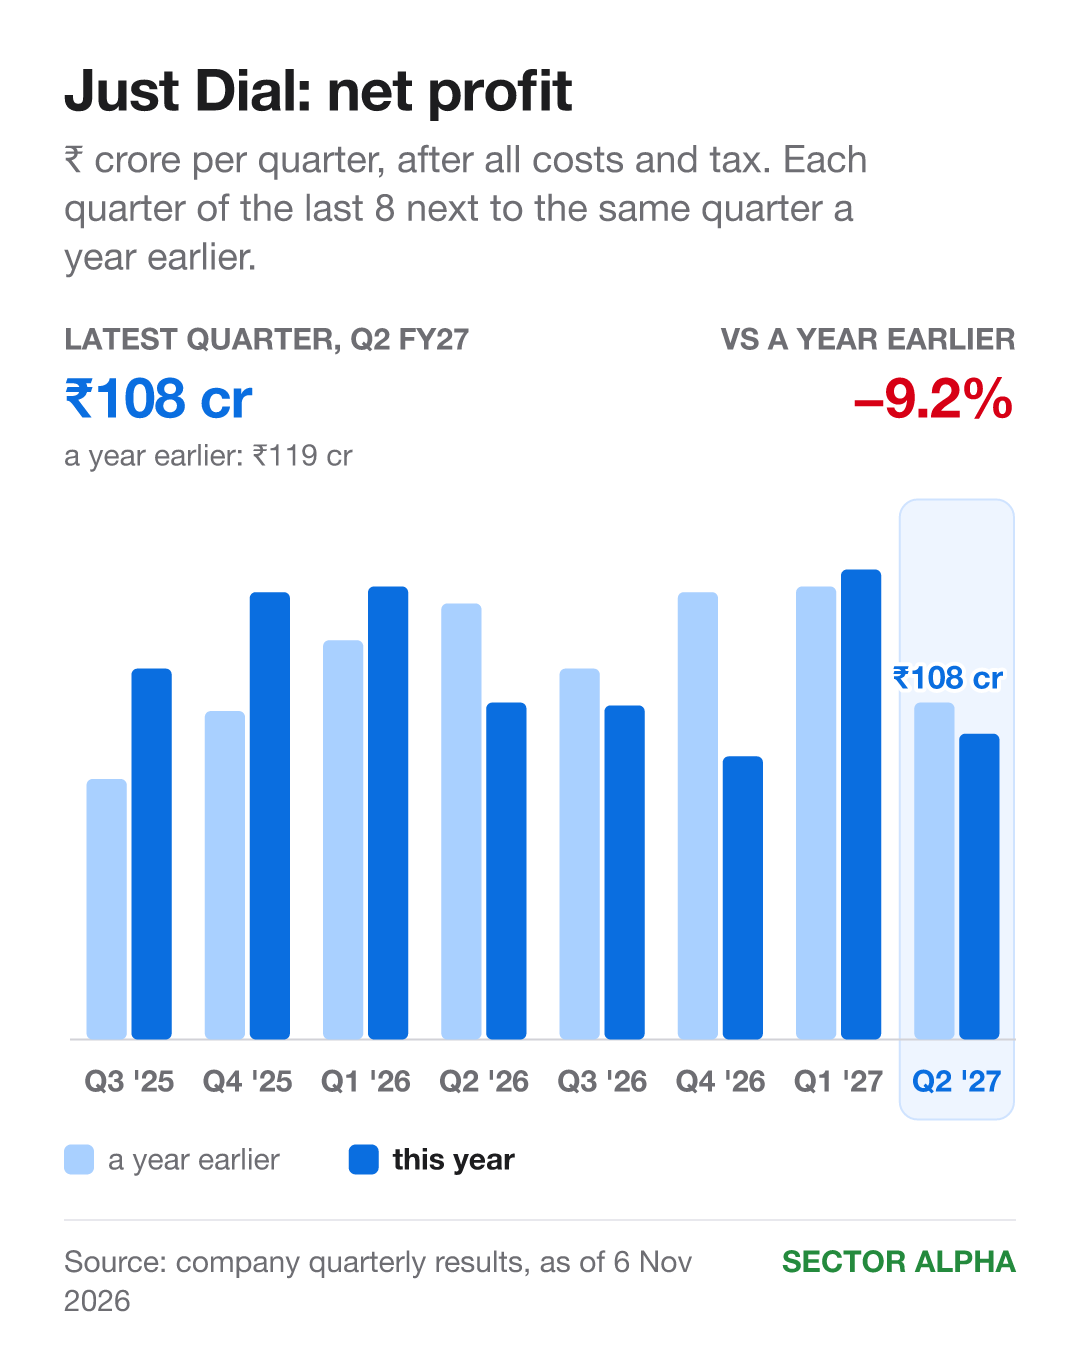
Sales: ₹303 cr → ₹343 cr. Up 13.2%. Higher in 8 of the last 8 quarters. Margin: 28.7% → 26.5%. Down 2.2 points. Higher in 4 of 8. Net profit: ₹119 cr → ₹108 cr. Down 9.2%. Higher in 4 of 8.
Price, earnings and P/E
Earnings per share, last 4 quarters: ₹66.8 → ₹57.9. Down 13%. Share price, same year: down 10%.
Earnings and price both fell. So P/E (price ÷ earnings per share) stayed at about 11 through 6 Nov 2026.
What led to it
No earnings call for Jul to Sep 2026 in my records, so I can’t give management’s reasons. What stands out: sales grew 13.2% but profit fell, because other income dropped from ₹73 crore to ₹55 crore.
IndiaMART (Q2 FY27)
IndiaMART is an online marketplace where businesses find suppliers.
Paying suppliers: 2,17,000, down 615 in the quarter. Subscribers on its Silver plan keep leaving.
Each quarter vs a year earlier
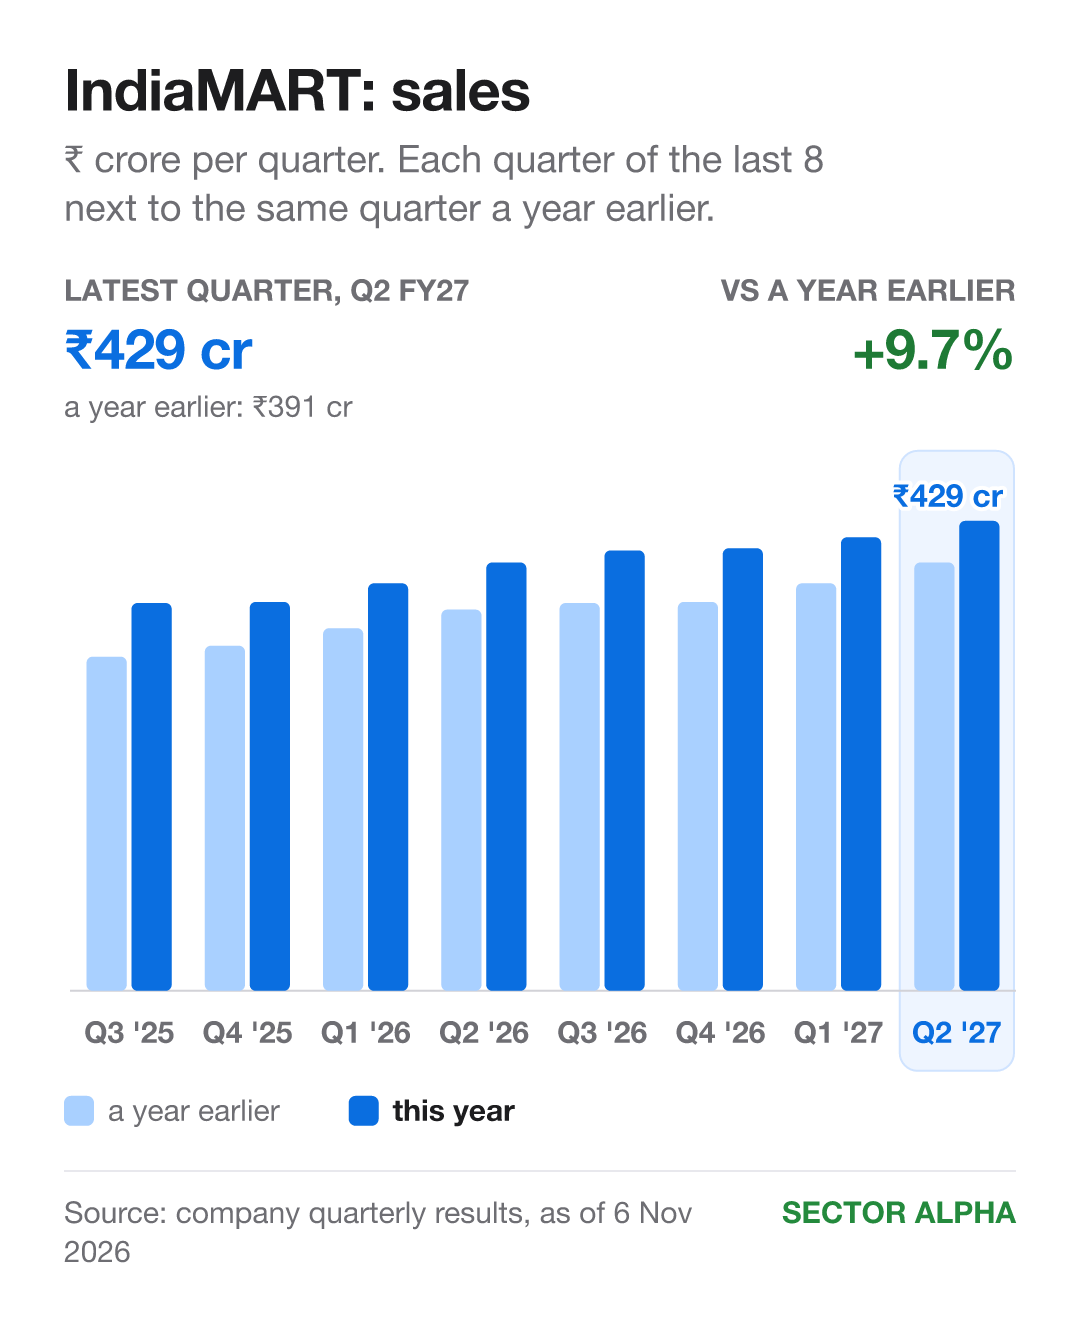
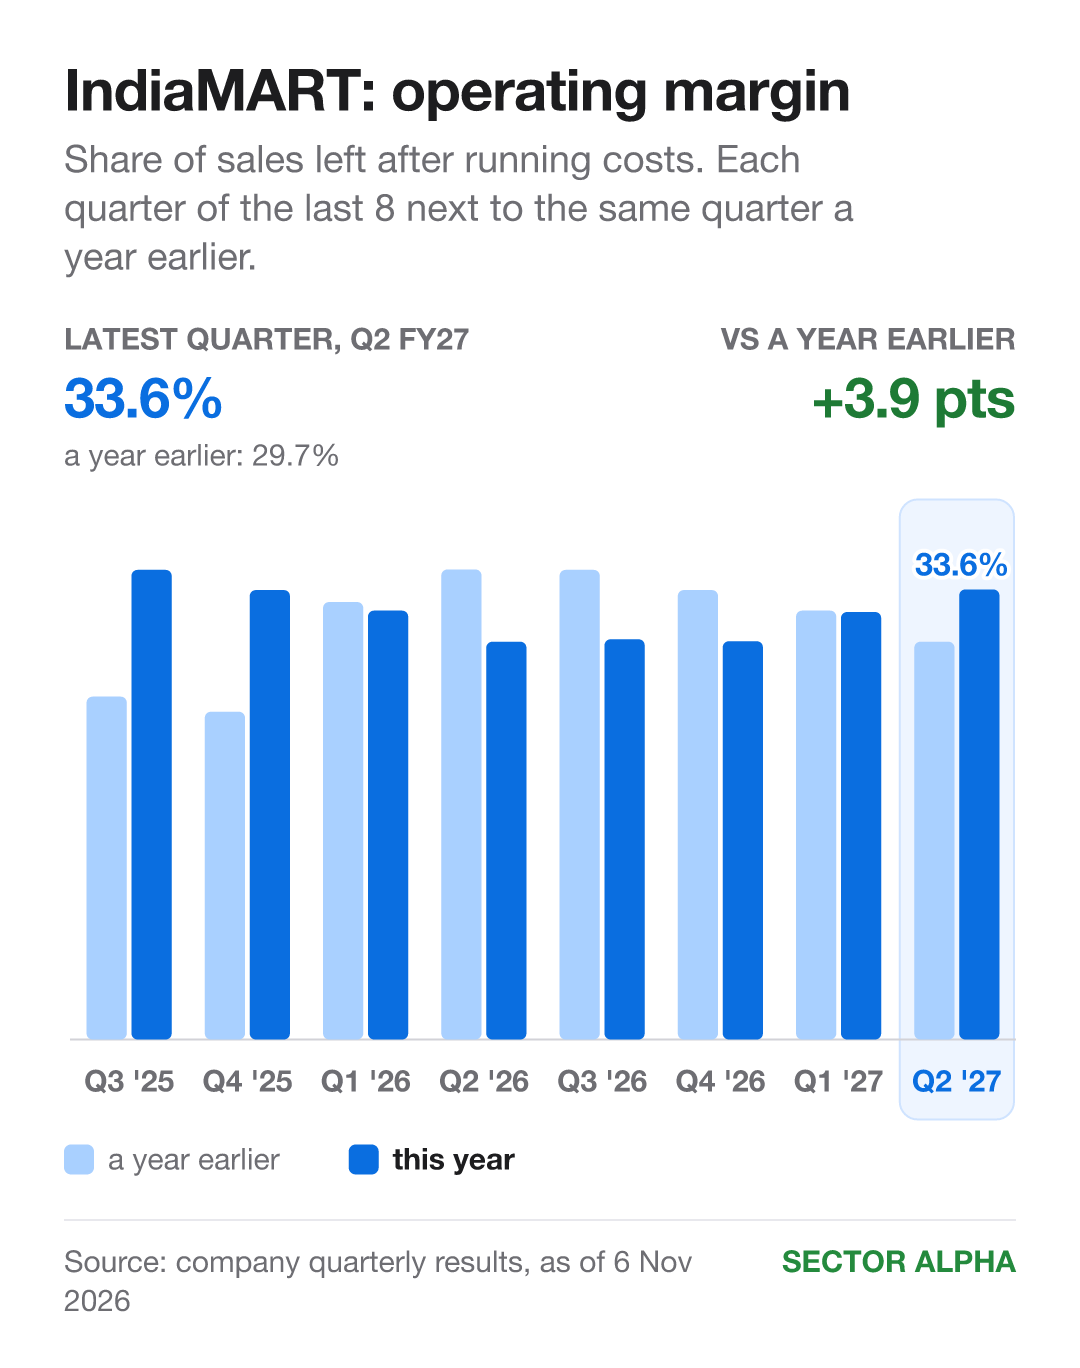
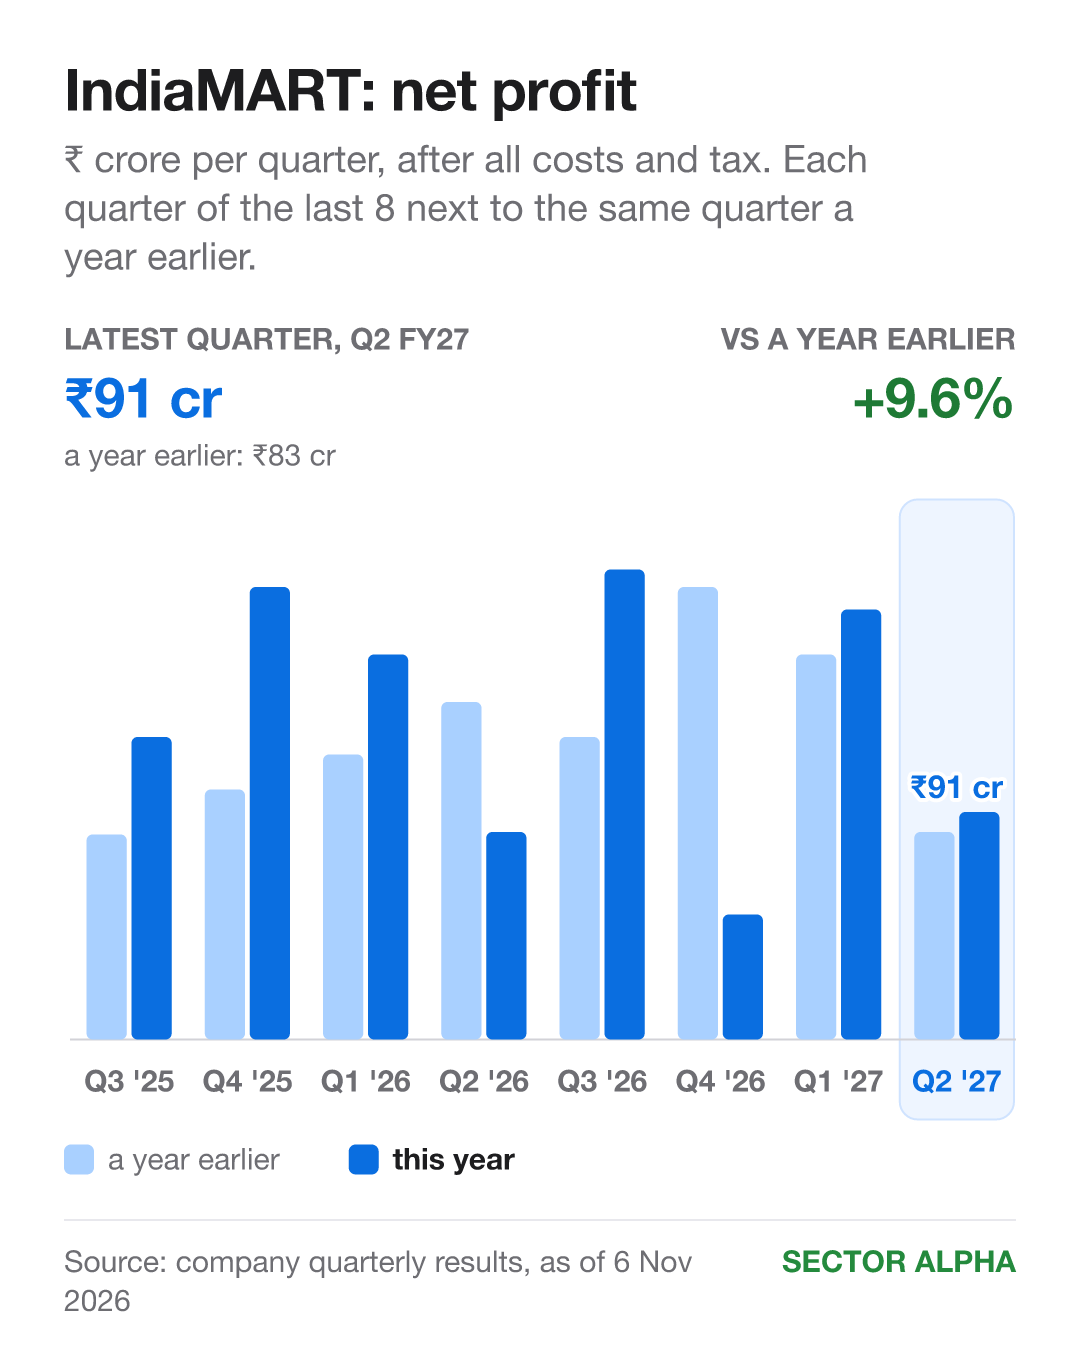
Sales: ₹391 cr → ₹429 cr. Up 9.7%. Higher in 8 of the last 8 quarters. Margin: 29.7% → 33.6%. Up 3.9 points. Higher in only 3 of 8. Net profit: ₹83 cr → ₹91 cr. Up 9.6%. Higher in 6 of 8.
Growth held back: IndiaMART is not pushing to add new suppliers until fewer Silver subscribers leave.
Price, earnings and P/E
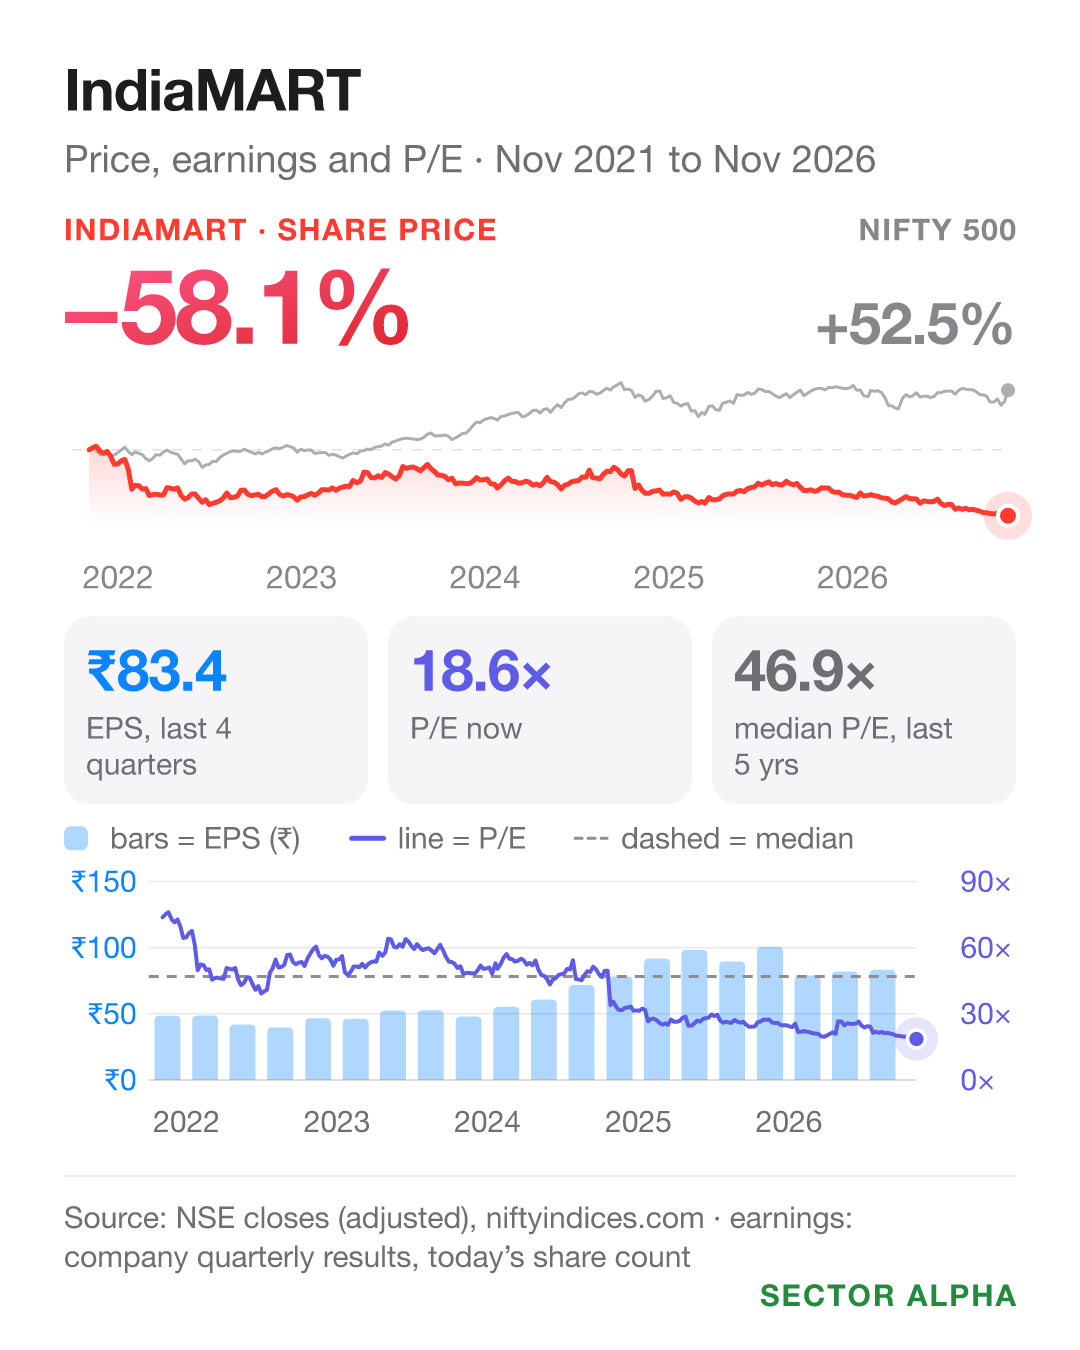
Earnings per share, last 4 quarters: ₹89.6 → ₹83.4. Down 7%. Share price, same year: down 37%.
The price fell much faster than earnings. So P/E (price ÷ earnings per share) fell from about 28 to 19 by 6 Nov 2026.
What led to it
Collections: ₹443 crore collected from customers.
BUSY accounting software: revenue ₹37 crore.
Other income: minus ₹8 crore, mainly from changes in bond values.
Changed plan: in July, management said it was working to get more buyer enquiries. In October, it said it accepts losing 10% to 20% of enquiries to keep its data away from AI search tools.
What to track
Paytm sales: above ₹2,648 crore a quarter.
Urban Company loss: below ₹182 crore a quarter.
Urban Company break-even: management’s goal is Oct to Dec 2027.
Pine Labs margin: above 15.6%.
UPI fee start date: Paytm and Pine Labs both wait on it.
Macfos sales: above ₹98.7 crore a quarter.
Info Edge recruitment billings: growth above 13%.
IndiaMART paying suppliers: above 2,17,000.
Every quarter and every call for these companies is on the sector page: sectoralpha.in/sectors/e-commerce-platform-utility
— Roshan, Sector Alpha